| Param | Original file | Final file |
|---|---|---|
| Filename | modeM0/AS1T02_073T01_9000002260_15323cztM0_level2.evt | modeM0/AS1T02_073T01_9000002260_15323cztM0_level2_quad_clean.evt |
| Size (bytes) | 459,299,520 | 71,504,640 |
| Size | 438.0 MB | 68.2 MB |
| Events in quadrant A | 3,218,019 | 429,567 |
| Events in quadrant B | 3,270,437 | 435,459 |
| Events in quadrant C | 3,390,369 | 424,707 |
| Events in quadrant D | 3,576,382 | 408,704 |
| Mode SS | |||
|---|---|---|---|
| Quadrant | BADHDUFLAG | Total packets | Discarded packets |
| A | 0 | 140 | 0 |
| B | 0 | 140 | 0 |
| C | 0 | 140 | 0 |
| D | 0 | 140 | 0 |
| Mode M0 | |||
|---|---|---|---|
| Quadrant | BADHDUFLAG | Total packets | Discarded packets |
| A | 0 | 13821 | 3 |
| B | 0 | 13829 | 2 |
| C | 0 | 13928 | 2 |
| D | 0 | 15117 | 2 |
| Mode M9 | |||
|---|---|---|---|
| Quadrant | BADHDUFLAG | Total packets | Discarded packets |
| A | 0 | 16 | 0 |
| B | 0 | 16 | 0 |
| C | 0 | 16 | 0 |
| D | 0 | 16 | 0 |
| Quadrant | Total seconds | Saturated seconds | Saturation percentage |
|---|---|---|---|
| A | 6684 | 106 | 1.585877% |
| B | 6684 | 112 | 1.675643% |
| C | 6684 | 86 | 1.286655% |
| D | 6684 | 204 | 3.052065% |
Noise dominated data is calculated using 1-second bins in cleaned event files. If a bin has >2000 counts, and if more than 50% of those come from <1% of pixels, then it is considered to be noise-dominated and hence unusable.
| Quadrant | # 1 sec bins | Bins with >0 counts | Bins with >2000 counts | High rate bins dominated by noise | Noise dominated (total time) | Noise dominated (detector-on time) | Marked lightcurve |
|---|---|---|---|---|---|---|---|
| A | 8420 | 6685 | 0 | 0 | 0.00% | 0.00% | 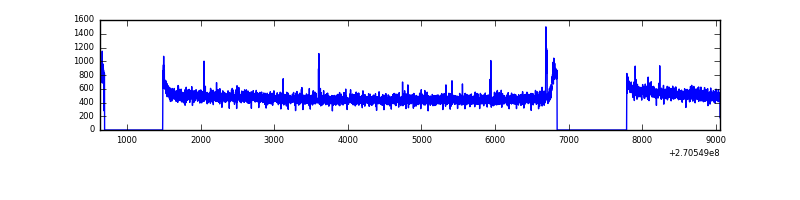 |
| B | 8420 | 6685 | 1 | 1 | 0.01% | 0.01% | 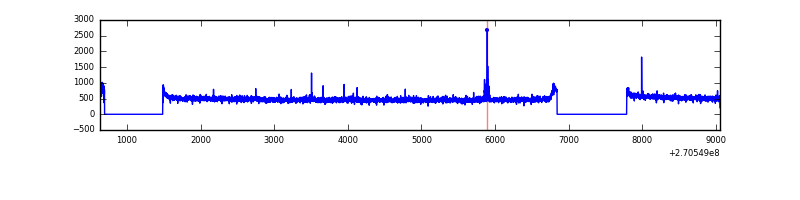 |
| C | 8420 | 6685 | 0 | 0 | 0.00% | 0.00% | 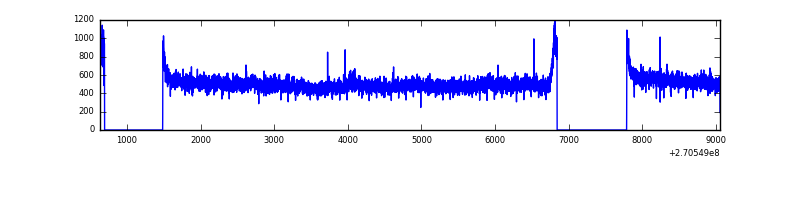 |
| D | 8420 | 6685 | 108 | 108 | 1.28% | 1.62% | 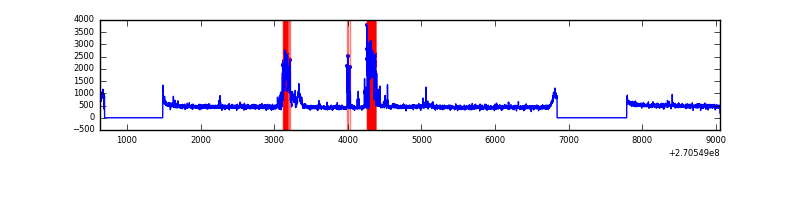 |
Top three noisy pixels from each quadrant. If the there are fewer than three noisy pixels in the level2.evt file, extra rows are filled as -1
| Pixel properties | Quadrant properties | ||||||
|---|---|---|---|---|---|---|---|
| Quadrant | DetID | PixID | Counts | Sigma | Mean | Median | Sigma |
| A | 4 | 2 | 15429 | 86.92 | 832 | 813 | 168.2 |
| A | 0 | 226 | 7004 | 36.82 | 832 | 813 | 168.2 |
| A | 12 | 194 | 6034 | 31.05 | 832 | 813 | 168.2 |
| B | 6 | 36 | 20600 | 123.71 | 826 | 804 | 160.0 |
| B | 12 | 111 | 19621 | 117.6 | 826 | 804 | 160.0 |
| B | 11 | 111 | 17014 | 101.3 | 826 | 804 | 160.0 |
| C | 3 | 233 | 262202 | 1402.03 | 800 | 804 | 186.4 |
| C | 7 | 247 | 10946 | 54.4 | 800 | 804 | 186.4 |
| C | 13 | 61 | 5742 | 26.49 | 800 | 804 | 186.4 |
| D | 2 | 33 | 506821 | 2574.47 | 801 | 777 | 196.6 |
| D | 10 | 70 | 22874 | 112.42 | 801 | 777 | 196.6 |
| D | 2 | 234 | 18613 | 90.74 | 801 | 777 | 196.6 |
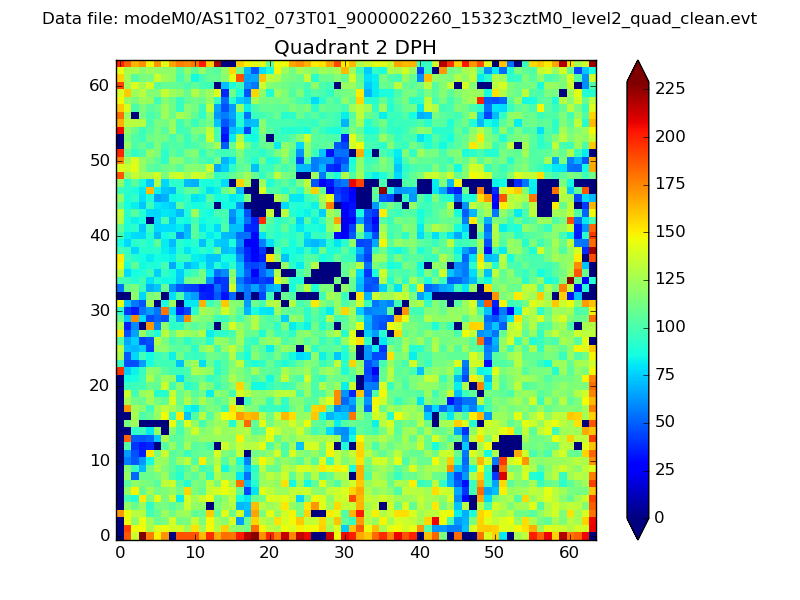
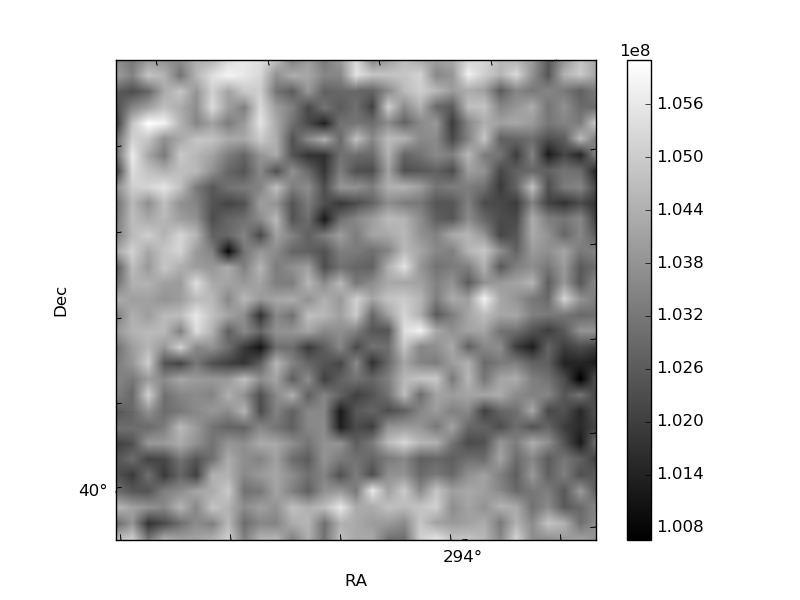
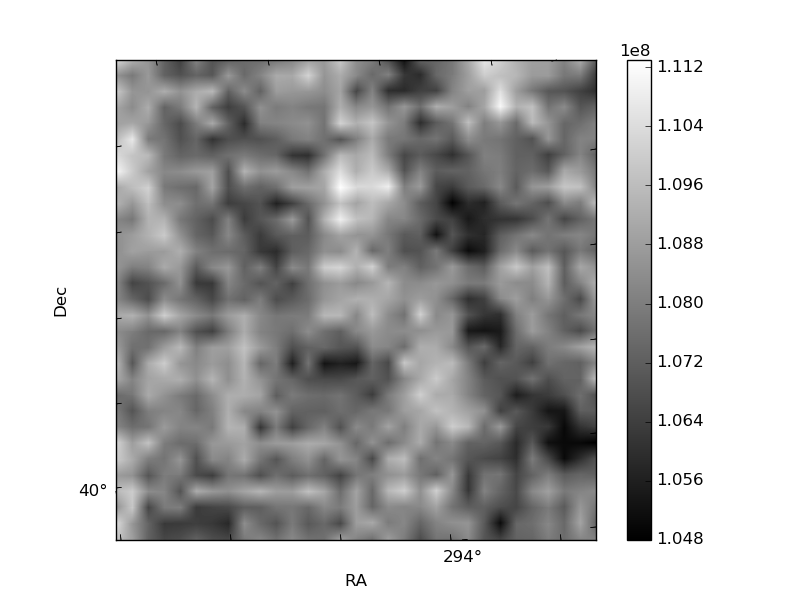
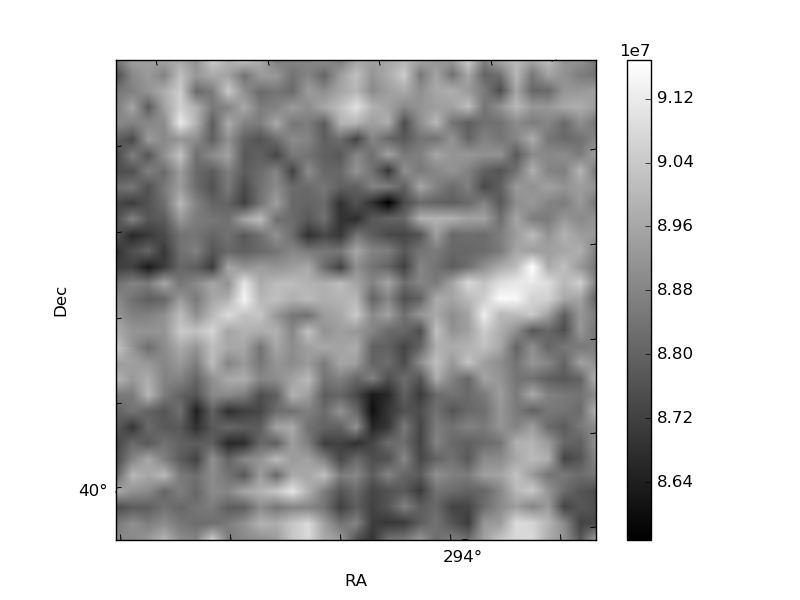
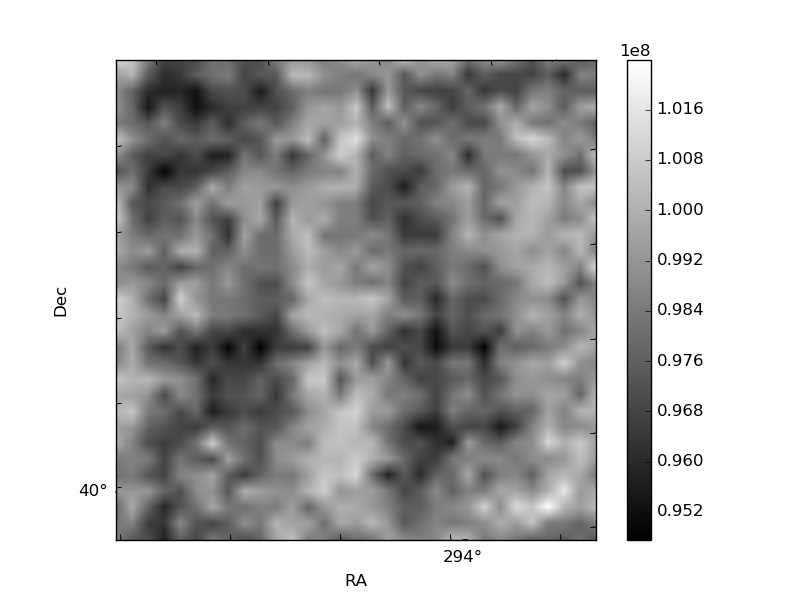
Histogram calculated using DETX and DETY for each event in the final _common_clean file
| Quadrant A | 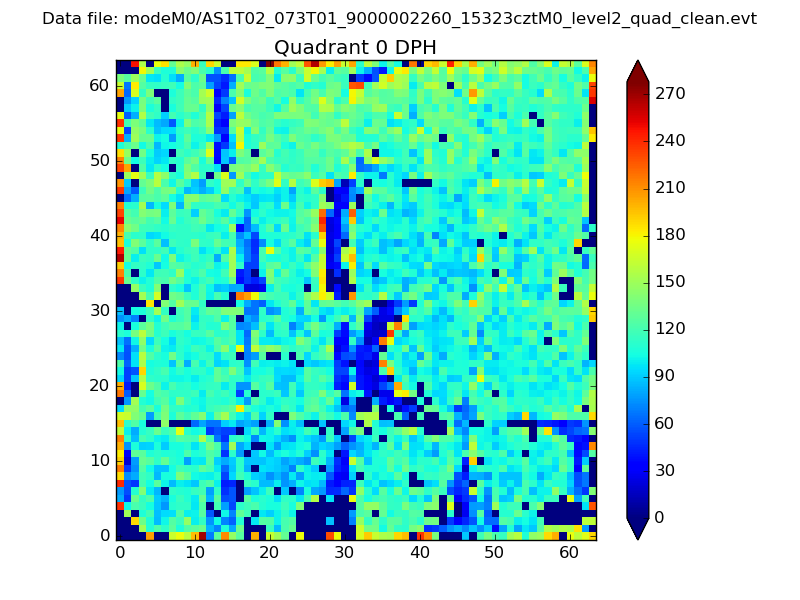 |
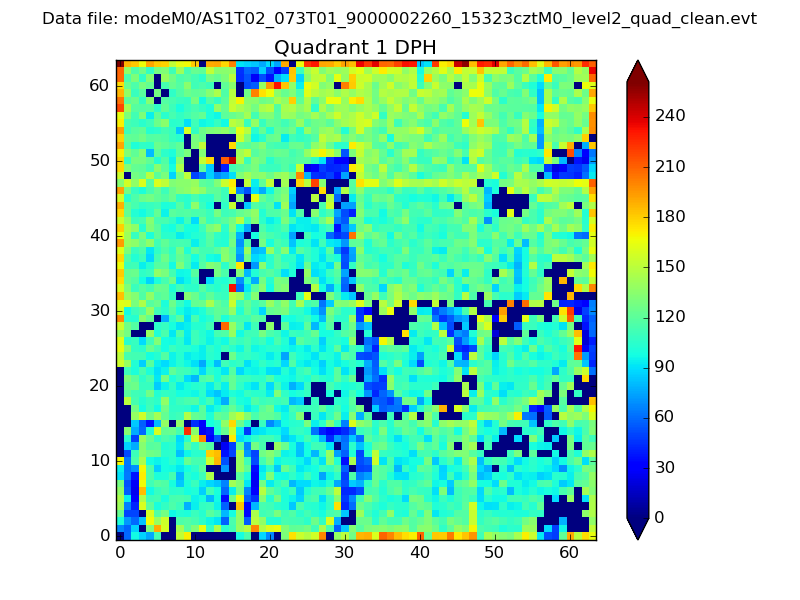 |
Quadrant B |
|---|---|---|---|
| Quadrant D | 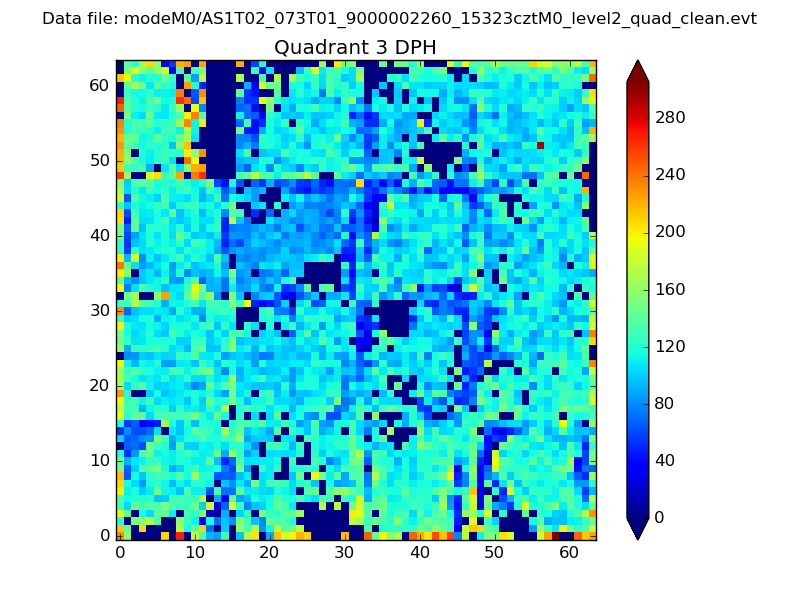 |
 |
Quadrant C |
| Plot type | Count rate plots | Images |
|---|---|---|
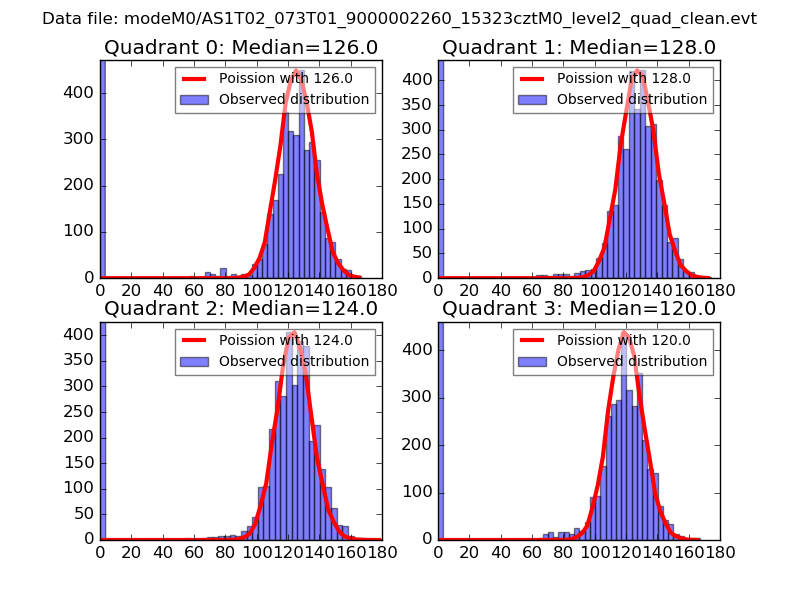
| Comparison with Poisson distribution Blue bars denote a histogram of data divided into 1 sec bins. Red curve is a Poisson curve with rate = median count rate of data. |
 |
 |
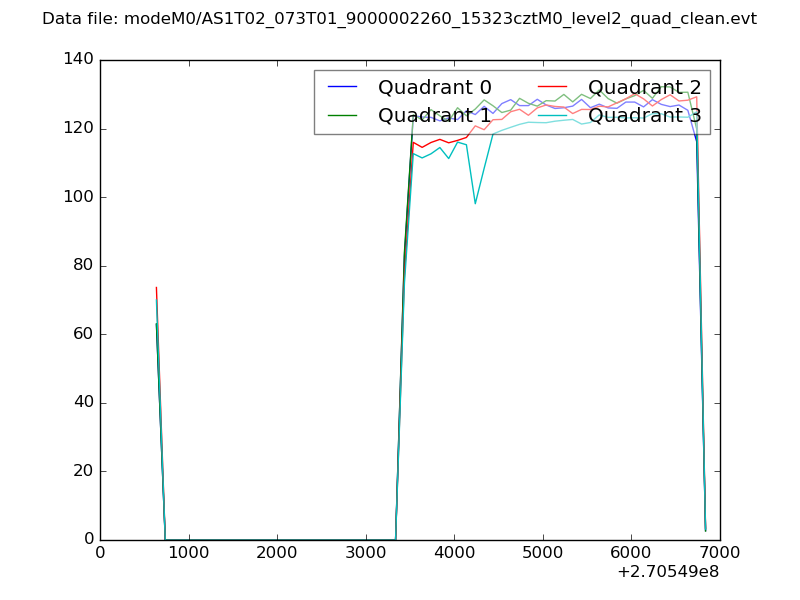
| Quadrant-wise count rates Data is divided into 100 sec bins |
 |
|
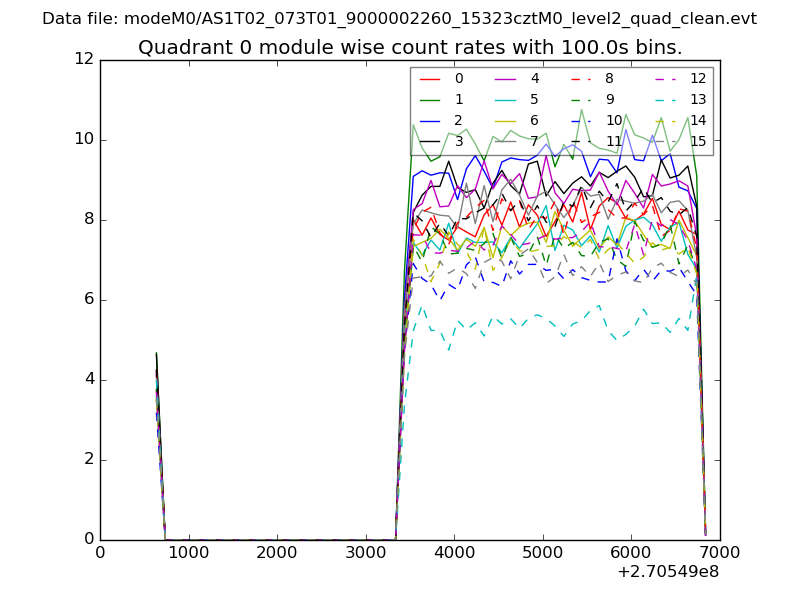
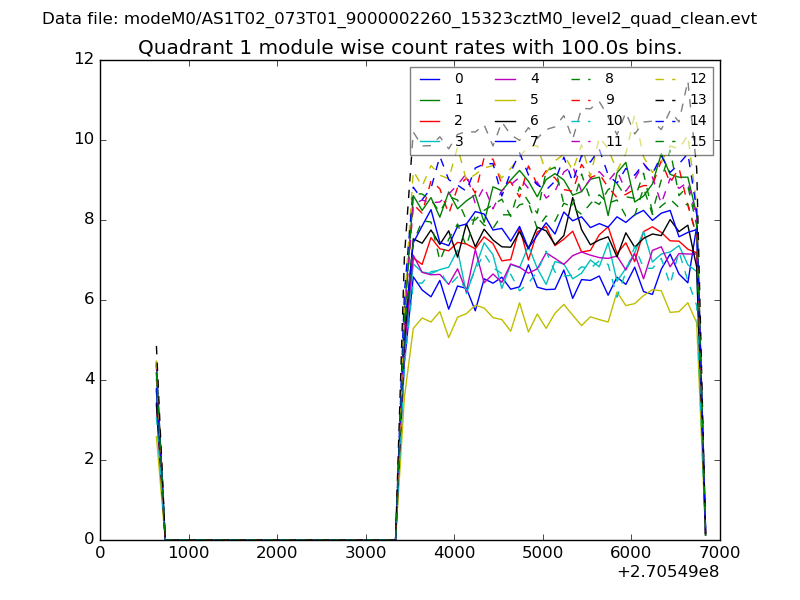
| Module-wise count rates for Quadrant A Data is divided into 100 sec bins |
 |
 |
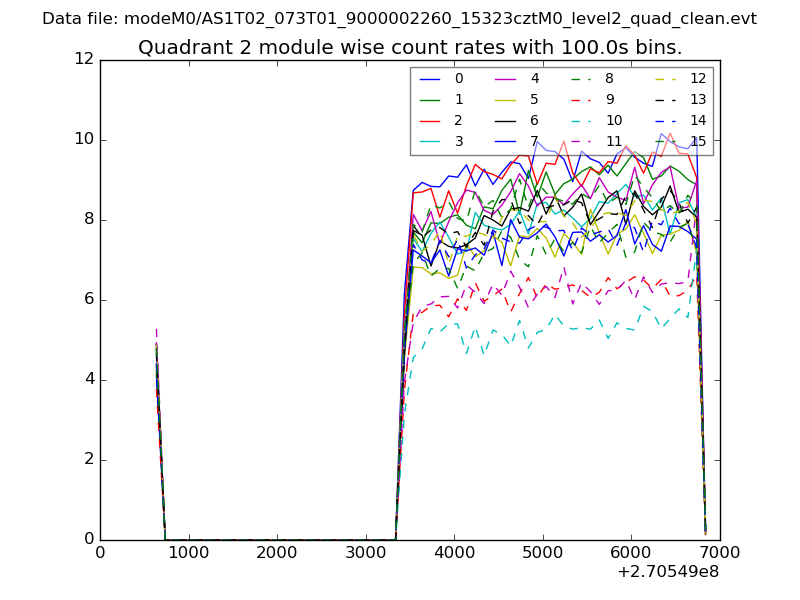
| Module-wise count rates for Quadrant B Data is divided into 100 sec bins |
 |
 |
| Module-wise count rates for Quadrant C Data is divided into 100 sec bins |
 |
 |
| Module-wise count rates for Quadrant D Data is divided into 100 sec bins |
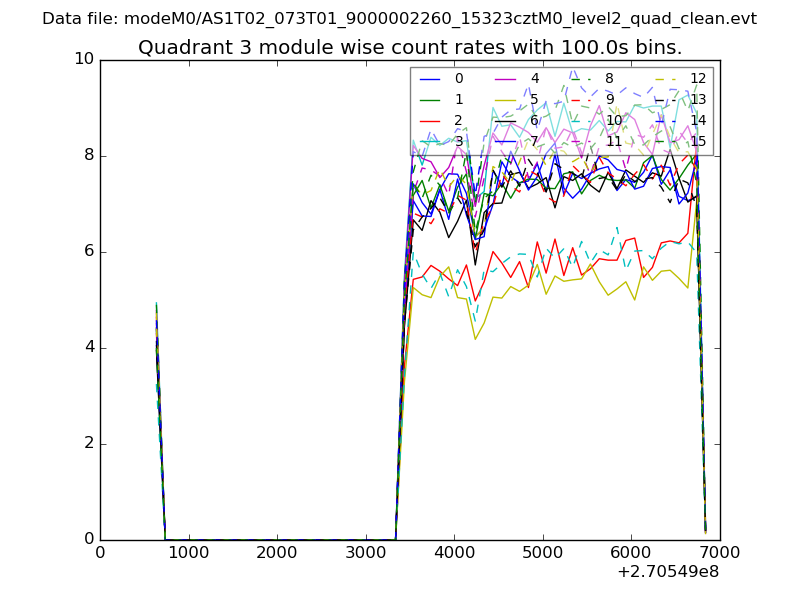 |
 |
| Parameter | Plot |
|---|---|
| CZT HV Monitor | 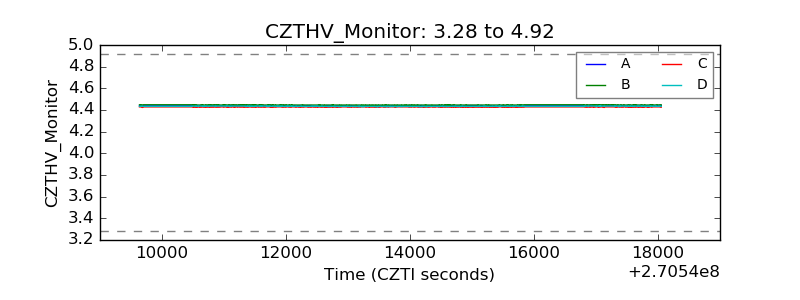 |
| D_VDD | 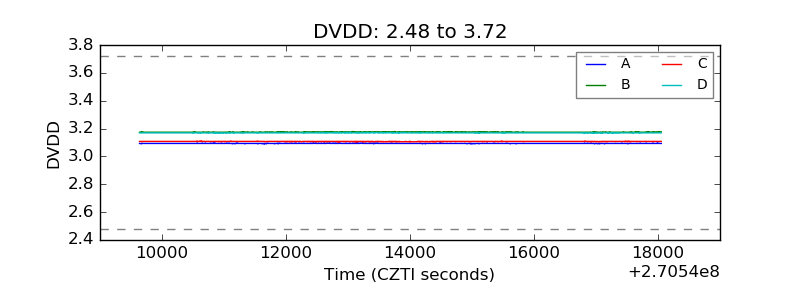 |
| Temperature 1 | 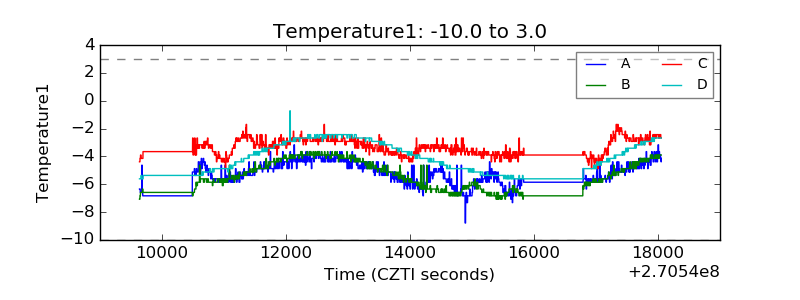 |
| Veto HV Monitor | 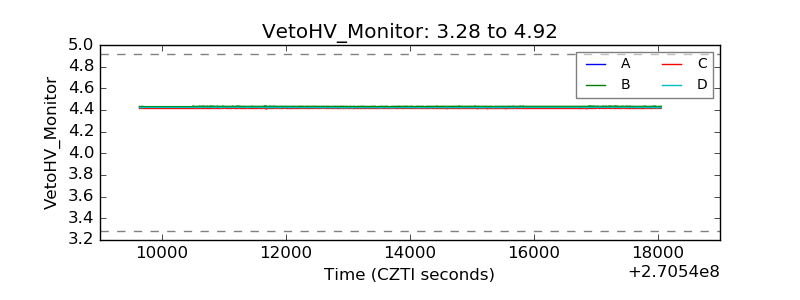 |
| Veto LLD |  |
| Alpha Counter | 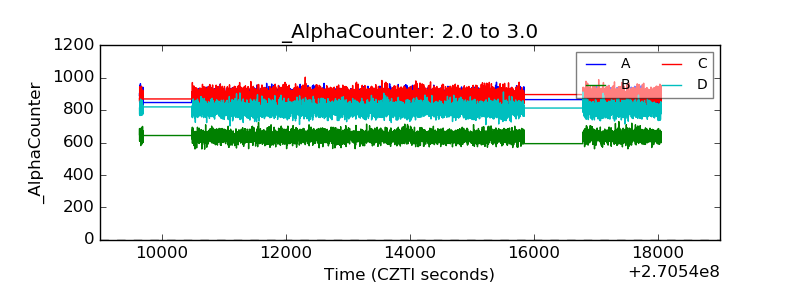 |
| _CPM_Rate | 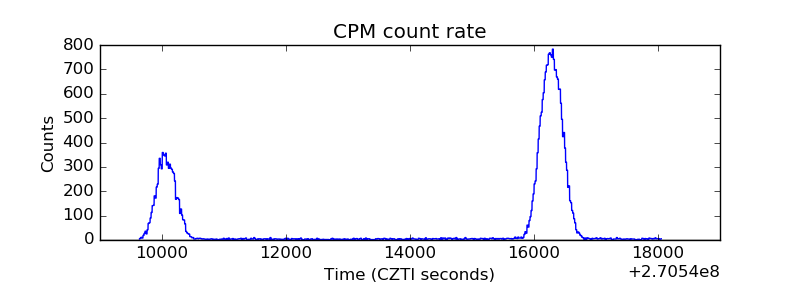 |
| CZT Counter | 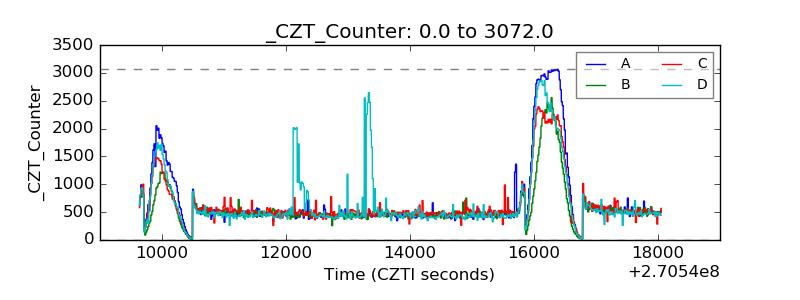 |
| +2.5 Volts monitor |  |
| +5 Volts monitor | 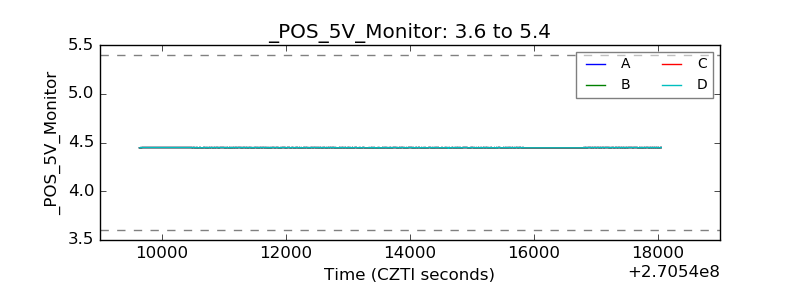 |
| _ROLL_ROT | 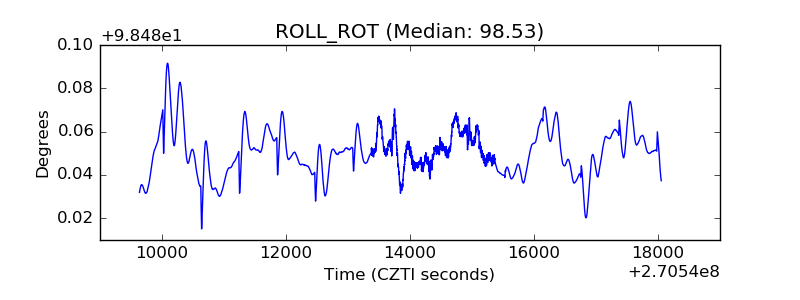 |
| _Roll_DEC | 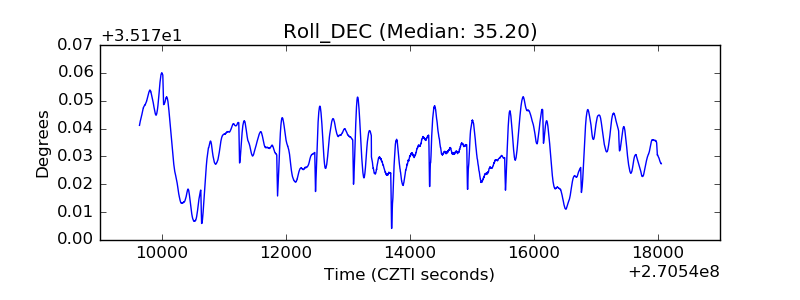 |
| _Roll_RA | 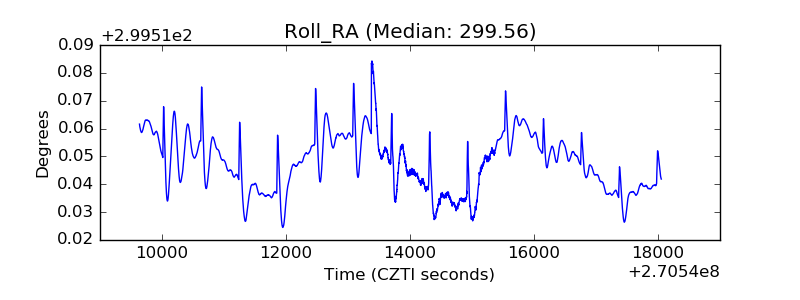 |
| Veto Counter | 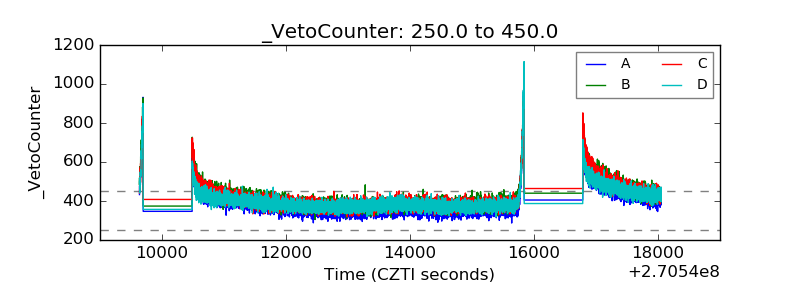 |