| Param | Original file | Final file |
|---|---|---|
| Filename | modeM0/AS1T02_073T01_9000002260_15324cztM0_level2.evt | modeM0/AS1T02_073T01_9000002260_15324cztM0_level2_quad_clean.evt |
| Size (bytes) | 604,967,040 | 95,955,840 |
| Size | 576.9 MB | 91.5 MB |
| Events in quadrant A | 5,997,718 | 554,255 |
| Events in quadrant B | 3,757,405 | 627,989 |
| Events in quadrant C | 3,857,686 | 611,044 |
| Events in quadrant D | 4,201,554 | 592,023 |
| Mode SS | |||
|---|---|---|---|
| Quadrant | BADHDUFLAG | Total packets | Discarded packets |
| A | 0 | 154 | 0 |
| B | 0 | 154 | 0 |
| C | 0 | 154 | 0 |
| D | 0 | 154 | 0 |
| Mode M0 | |||
|---|---|---|---|
| Quadrant | BADHDUFLAG | Total packets | Discarded packets |
| A | 0 | 22578 | 3 |
| B | 0 | 15820 | 2 |
| C | 0 | 15985 | 2 |
| D | 0 | 17577 | 2 |
| Mode M9 | |||
|---|---|---|---|
| Quadrant | BADHDUFLAG | Total packets | Discarded packets |
| A | 0 | 20 | 0 |
| B | 0 | 20 | 0 |
| C | 0 | 20 | 0 |
| D | 0 | 20 | 0 |
| Quadrant | Total seconds | Saturated seconds | Saturation percentage |
|---|---|---|---|
| A | 7474 | 939 | 12.563554% |
| B | 7474 | 139 | 1.859781% |
| C | 7474 | 107 | 1.431630% |
| D | 7474 | 378 | 5.057533% |
Noise dominated data is calculated using 1-second bins in cleaned event files. If a bin has >2000 counts, and if more than 50% of those come from <1% of pixels, then it is considered to be noise-dominated and hence unusable.
| Quadrant | # 1 sec bins | Bins with >0 counts | Bins with >2000 counts | High rate bins dominated by noise | Noise dominated (total time) | Noise dominated (detector-on time) | Marked lightcurve |
|---|---|---|---|---|---|---|---|
| A | 9475 | 7475 | 746 | 746 | 7.87% | 9.98% |  |
| B | 9475 | 7475 | 1 | 1 | 0.01% | 0.01% |  |
| C | 9475 | 7475 | 0 | 0 | 0.00% | 0.00% | 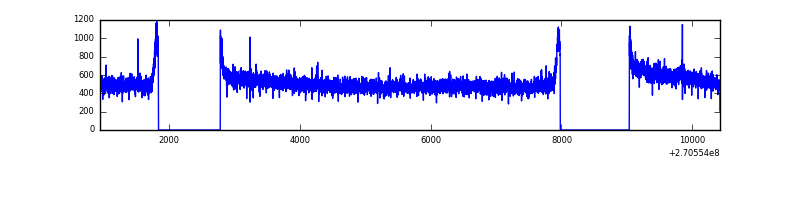 |
| D | 9475 | 7475 | 208 | 208 | 2.20% | 2.78% | 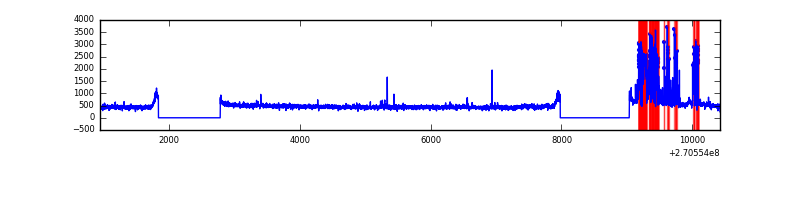 |
Top three noisy pixels from each quadrant. If the there are fewer than three noisy pixels in the level2.evt file, extra rows are filled as -1
| Pixel properties | Quadrant properties | ||||||
|---|---|---|---|---|---|---|---|
| Quadrant | DetID | PixID | Counts | Sigma | Mean | Median | Sigma |
| A | 15 | 239 | 2530868 | 14030.21 | 899 | 881 | 180.3 |
| A | 4 | 2 | 14772 | 77.03 | 899 | 881 | 180.3 |
| A | 0 | 226 | 7689 | 37.75 | 899 | 881 | 180.3 |
| B | 10 | 16 | 24885 | 133.07 | 947 | 924 | 180.1 |
| B | 12 | 111 | 22004 | 117.07 | 947 | 924 | 180.1 |
| B | 11 | 111 | 19099 | 100.94 | 947 | 924 | 180.1 |
| C | 3 | 233 | 253213 | 1187.94 | 922 | 928 | 212.4 |
| C | 7 | 247 | 10025 | 42.84 | 922 | 928 | 212.4 |
| C | 13 | 61 | 6667 | 27.02 | 922 | 928 | 212.4 |
| D | 13 | 122 | 710542 | 3235.45 | 904 | 879 | 219.3 |
| D | 2 | 33 | 60371 | 271.23 | 904 | 879 | 219.3 |
| D | 2 | 234 | 22458 | 98.38 | 904 | 879 | 219.3 |
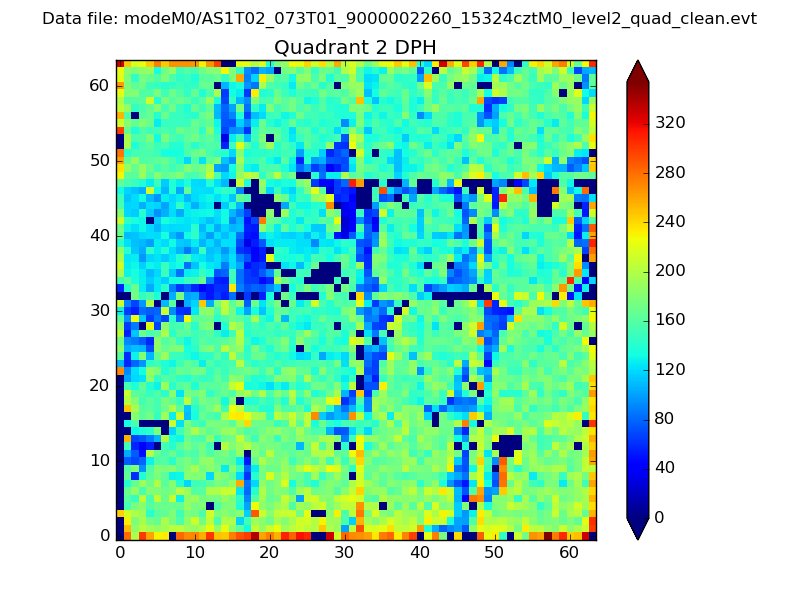
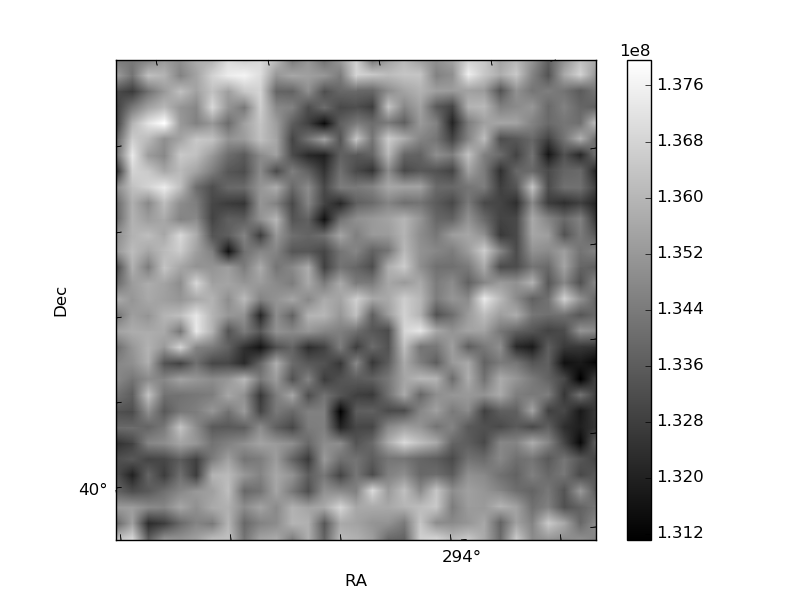
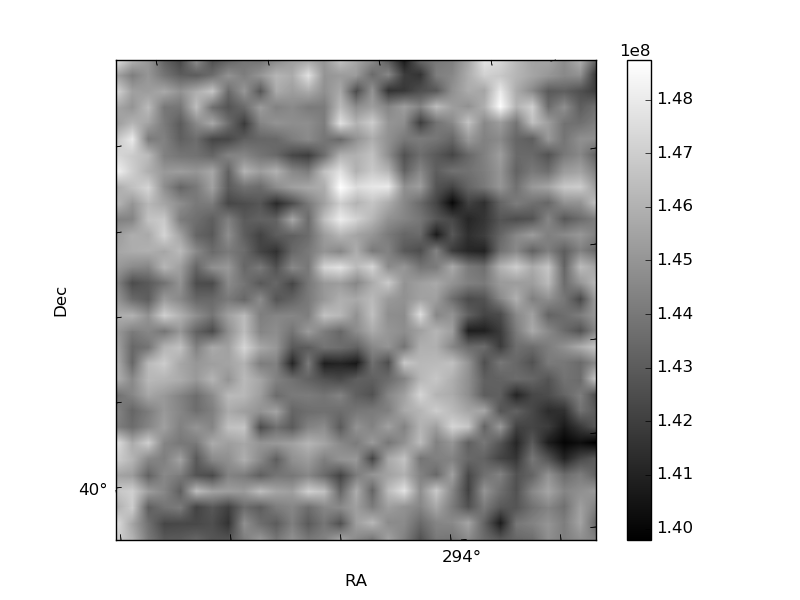
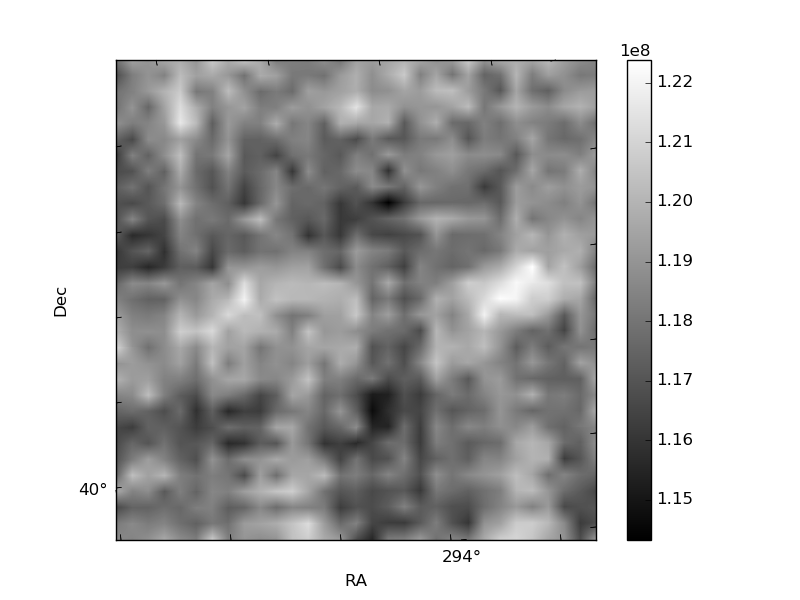
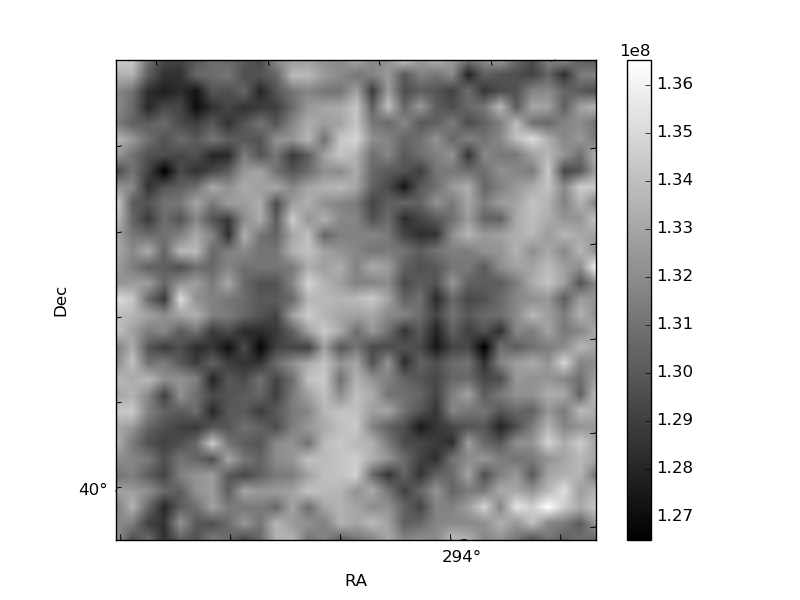
Histogram calculated using DETX and DETY for each event in the final _common_clean file
| Quadrant A | 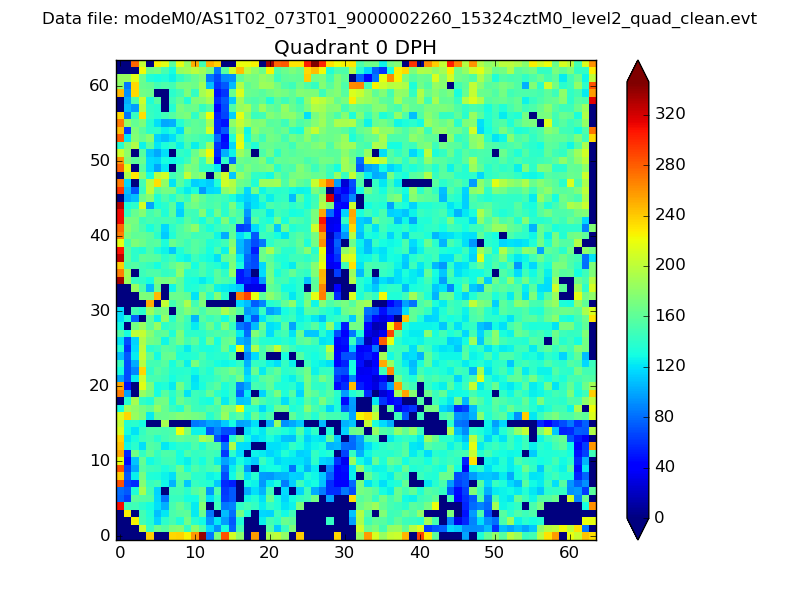 |
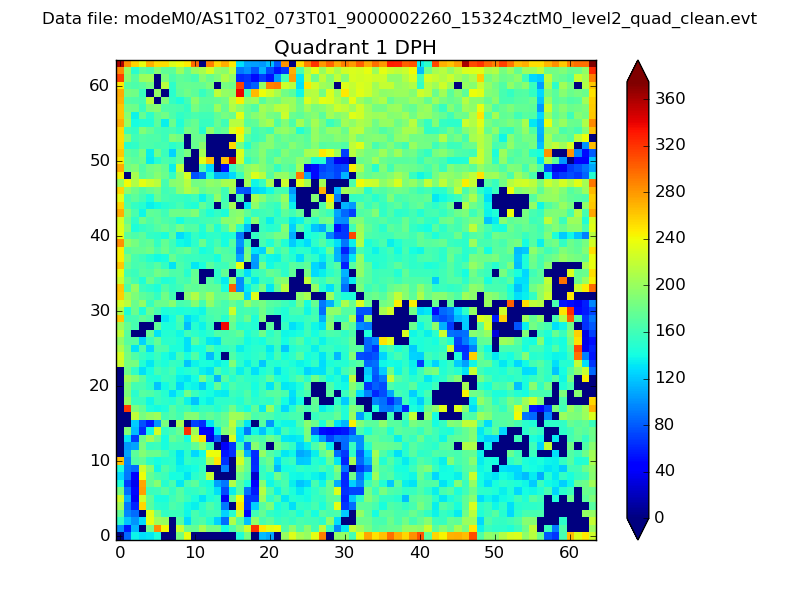 |
Quadrant B |
|---|---|---|---|
| Quadrant D | 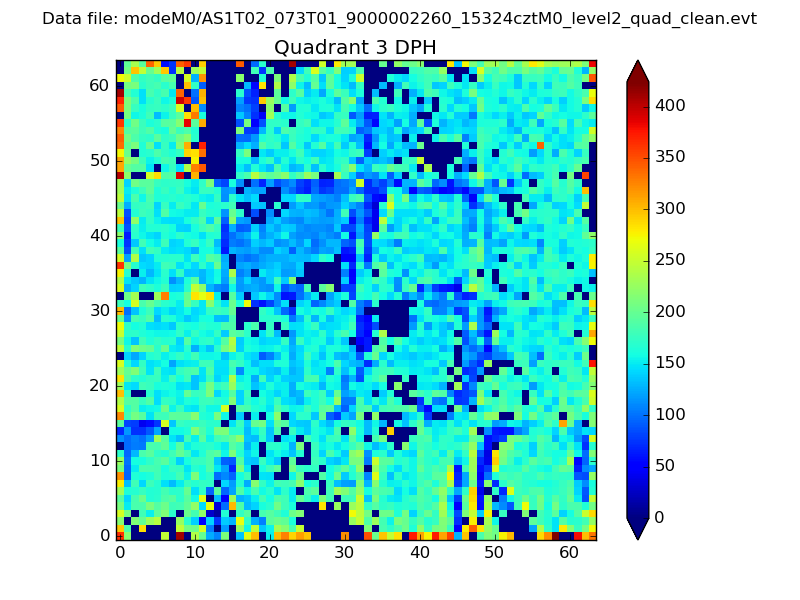 |
 |
Quadrant C |
| Plot type | Count rate plots | Images |
|---|---|---|
| Comparison with Poisson distribution Blue bars denote a histogram of data divided into 1 sec bins. Red curve is a Poisson curve with rate = median count rate of data. |
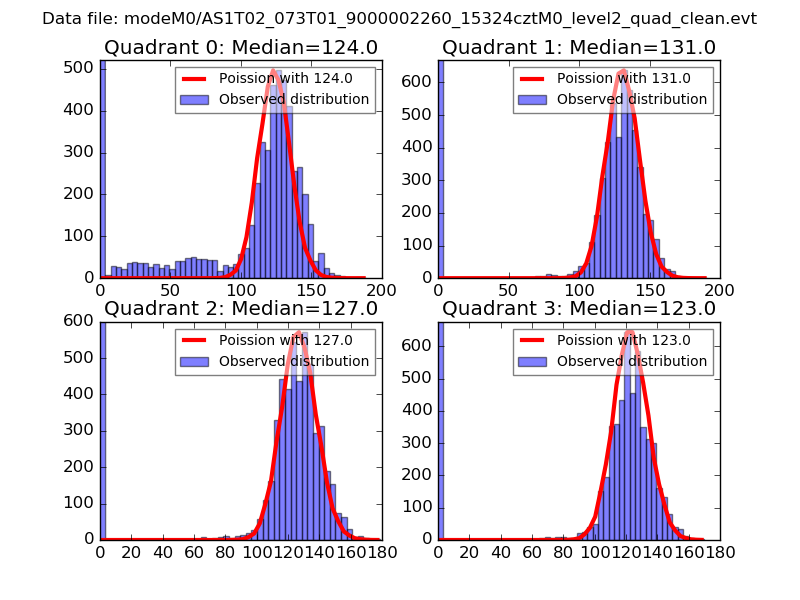 |
 |
| Quadrant-wise count rates Data is divided into 100 sec bins |
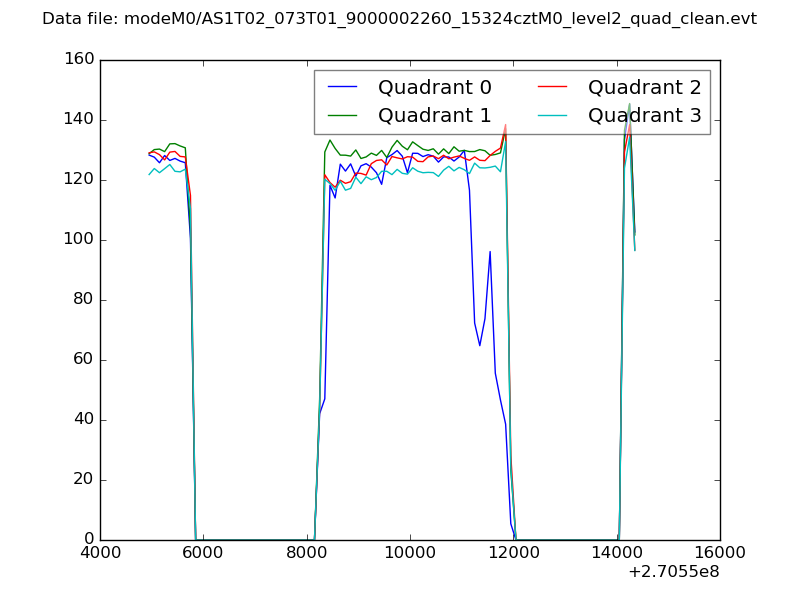 |
|
| Module-wise count rates for Quadrant A Data is divided into 100 sec bins |
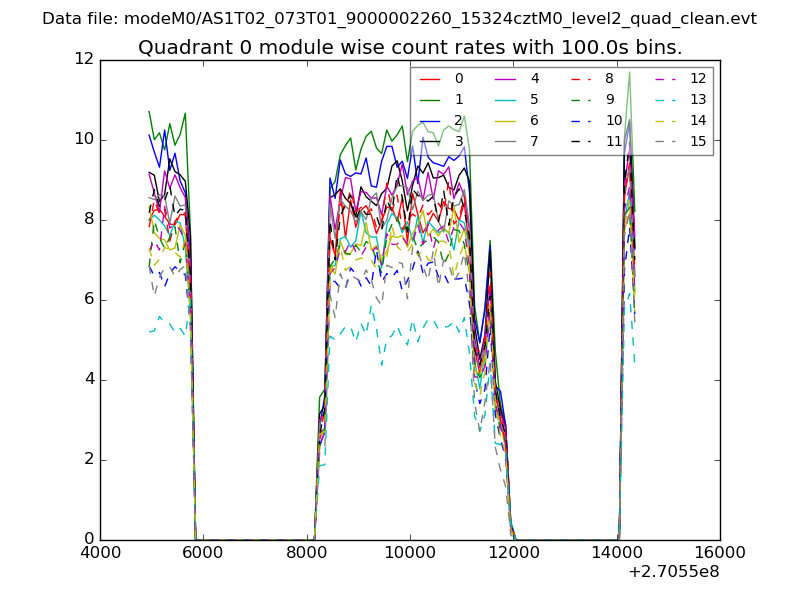 |
 |
| Module-wise count rates for Quadrant B Data is divided into 100 sec bins |
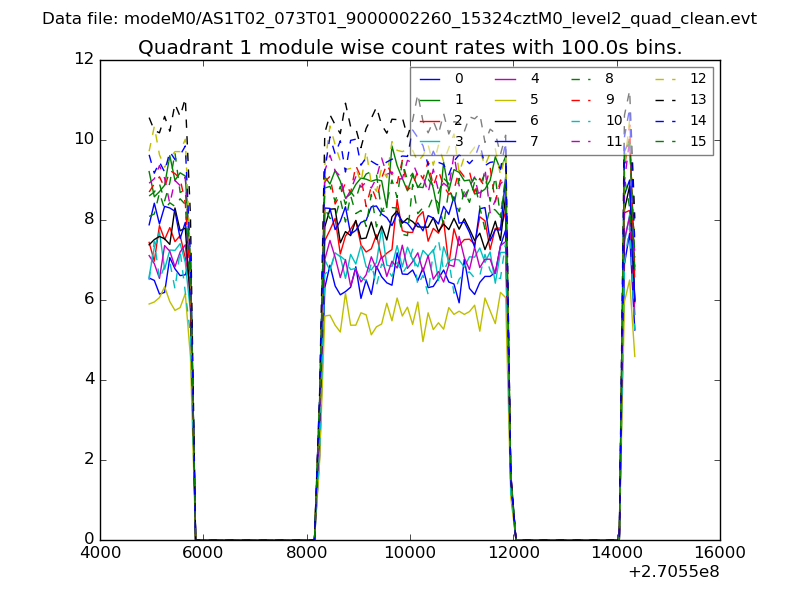 |
 |
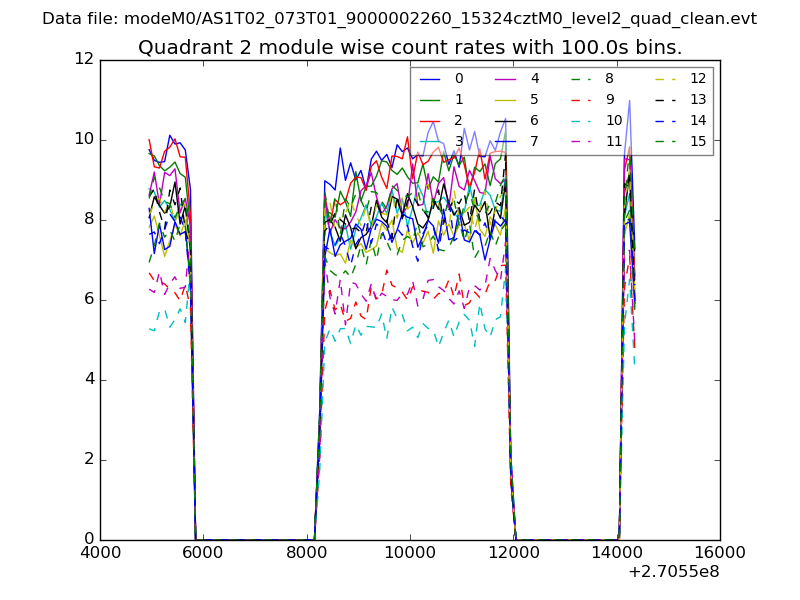
| Module-wise count rates for Quadrant C Data is divided into 100 sec bins |
 |
 |
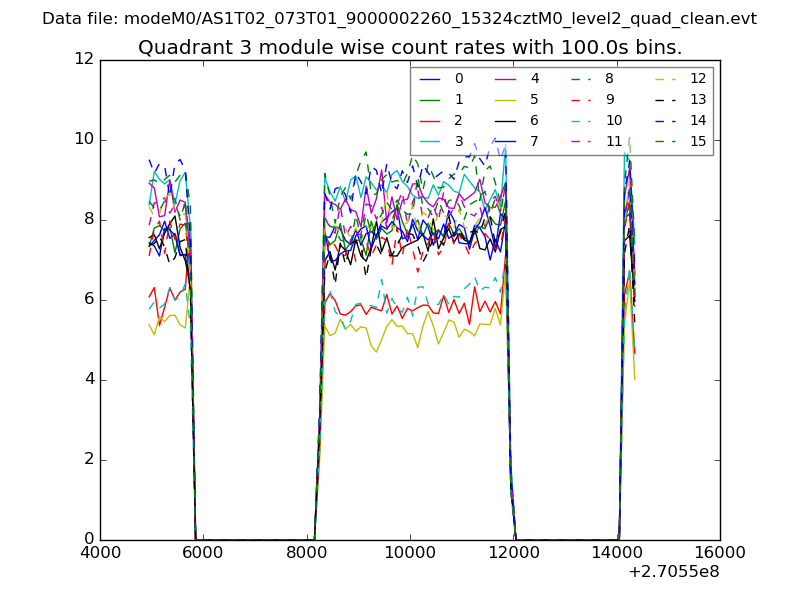
| Module-wise count rates for Quadrant D Data is divided into 100 sec bins |
 |
 |
| Parameter | Plot |
|---|---|
| CZT HV Monitor | 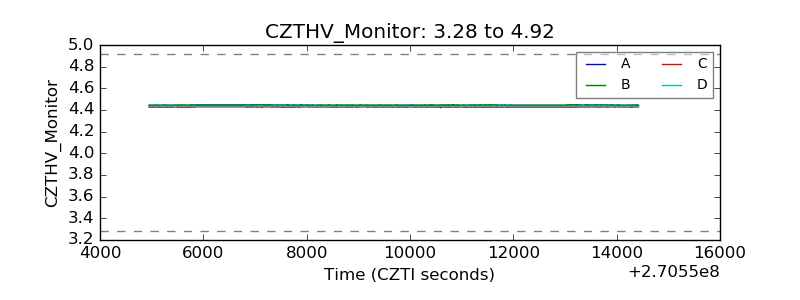 |
| D_VDD | 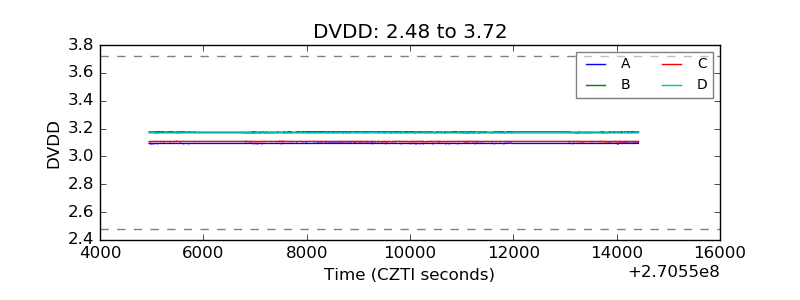 |
| Temperature 1 | 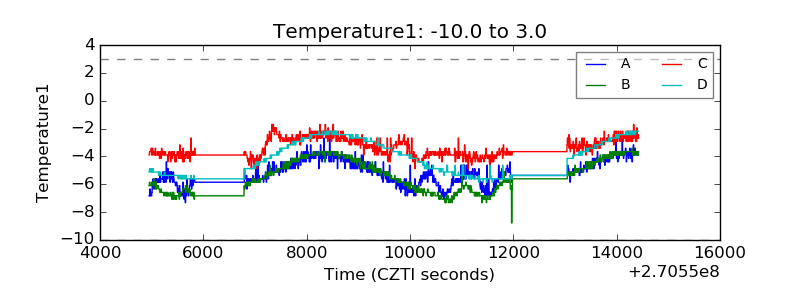 |
| Veto HV Monitor | 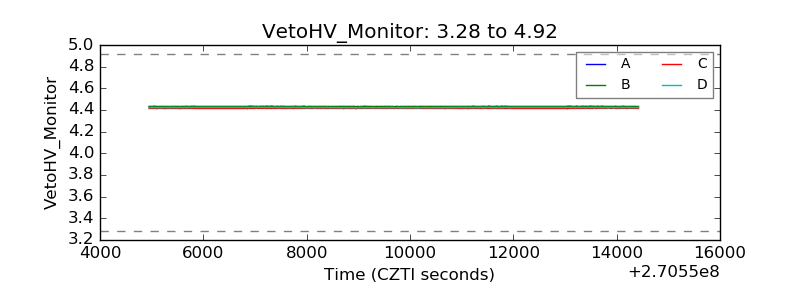 |
| Veto LLD | 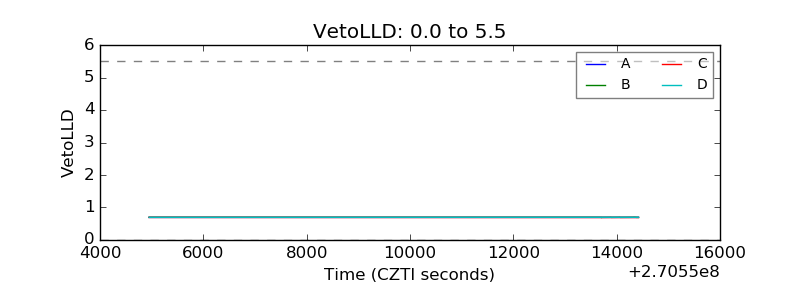 |
| Alpha Counter | 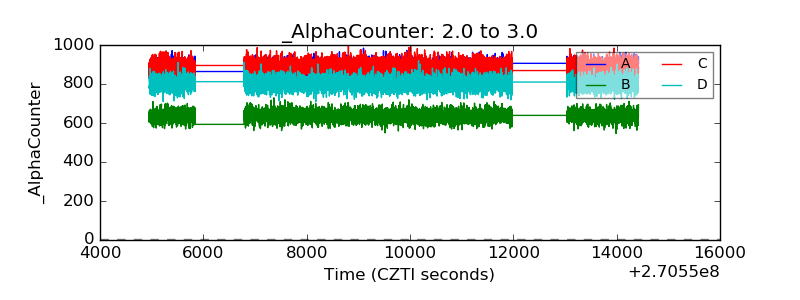 |
| _CPM_Rate |  |
| CZT Counter | 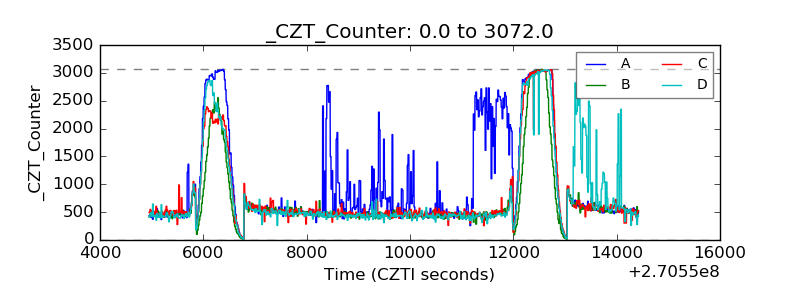 |
| +2.5 Volts monitor |  |
| +5 Volts monitor |  |
| _ROLL_ROT | 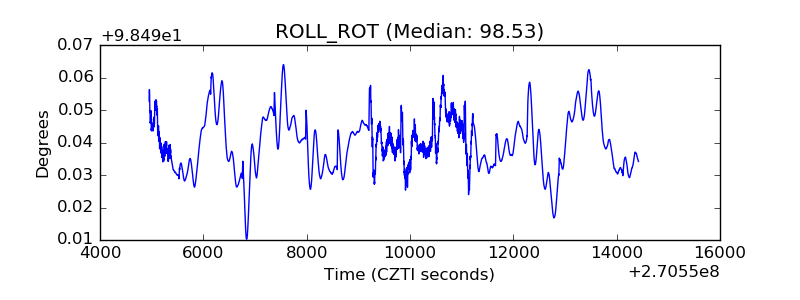 |
| _Roll_DEC | 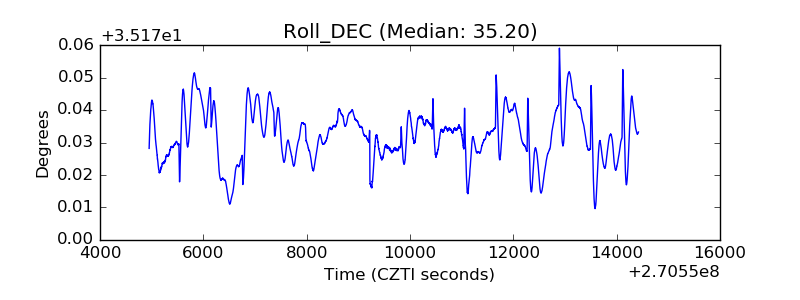 |
| _Roll_RA | 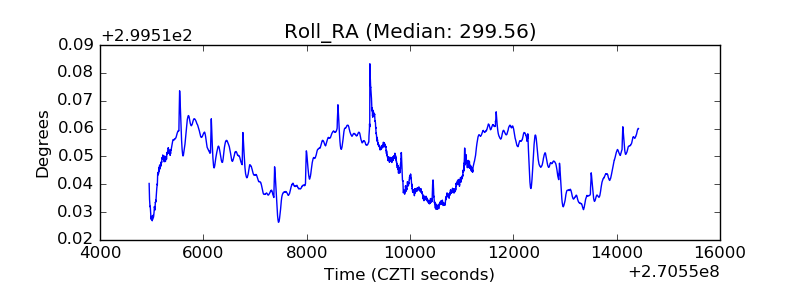 |
| Veto Counter | 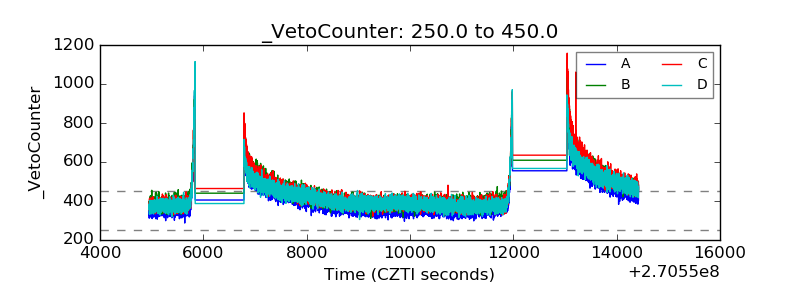 |