| Param | Original file | Final file |
|---|---|---|
| Filename | modeM0/AS1T02_073T01_9000002260_15326cztM0_level2.evt | modeM0/AS1T02_073T01_9000002260_15326cztM0_level2_quad_clean.evt |
| Size (bytes) | 619,608,960 | 86,990,400 |
| Size | 590.9 MB | 83.0 MB |
| Events in quadrant A | 3,138,296 | 585,801 |
| Events in quadrant B | 3,219,515 | 589,917 |
| Events in quadrant C | 3,288,583 | 574,118 |
| Events in quadrant D | 8,700,031 | 452,928 |
| Mode SS | |||
|---|---|---|---|
| Quadrant | BADHDUFLAG | Total packets | Discarded packets |
| A | 0 | 126 | 0 |
| B | 0 | 126 | 0 |
| C | 0 | 126 | 0 |
| D | 0 | 126 | 0 |
| Mode M0 | |||
|---|---|---|---|
| Quadrant | BADHDUFLAG | Total packets | Discarded packets |
| A | 0 | 13322 | 2 |
| B | 0 | 13518 | 1 |
| C | 0 | 13648 | 1 |
| D | 0 | 29841 | 1 |
| Mode M9 | |||
|---|---|---|---|
| Quadrant | BADHDUFLAG | Total packets | Discarded packets |
| A | 0 | 12 | 0 |
| B | 0 | 12 | 0 |
| C | 0 | 12 | 0 |
| D | 0 | 12 | 0 |
| Quadrant | Total seconds | Saturated seconds | Saturation percentage |
|---|---|---|---|
| A | 6170 | 74 | 1.199352% |
| B | 6170 | 98 | 1.588331% |
| C | 6170 | 65 | 1.053485% |
| D | 6170 | 2515 | 40.761750% |
Noise dominated data is calculated using 1-second bins in cleaned event files. If a bin has >2000 counts, and if more than 50% of those come from <1% of pixels, then it is considered to be noise-dominated and hence unusable.
| Quadrant | # 1 sec bins | Bins with >0 counts | Bins with >2000 counts | High rate bins dominated by noise | Noise dominated (total time) | Noise dominated (detector-on time) | Marked lightcurve |
|---|---|---|---|---|---|---|---|
| A | 7346 | 6171 | 0 | 0 | 0.00% | 0.00% |  |
| B | 7346 | 6171 | 9 | 9 | 0.12% | 0.15% | 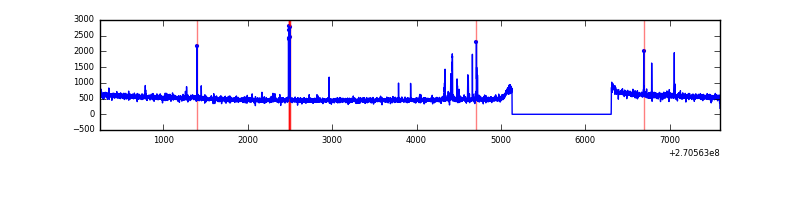 |
| C | 7346 | 6171 | 1 | 1 | 0.01% | 0.02% | 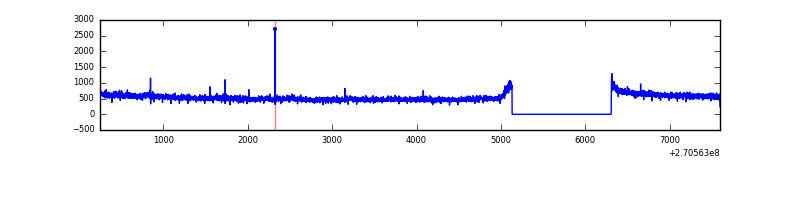 |
| D | 7346 | 6171 | 2089 | 2089 | 28.44% | 33.85% | 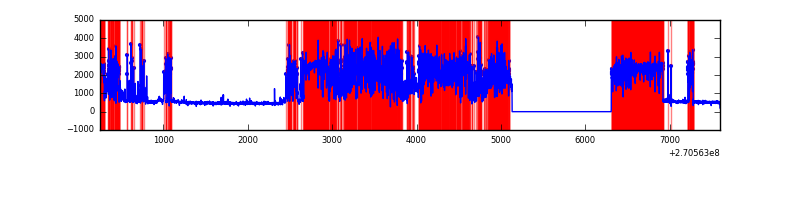 |
Top three noisy pixels from each quadrant. If the there are fewer than three noisy pixels in the level2.evt file, extra rows are filled as -1
| Pixel properties | Quadrant properties | ||||||
|---|---|---|---|---|---|---|---|
| Quadrant | DetID | PixID | Counts | Sigma | Mean | Median | Sigma |
| A | 4 | 2 | 11374 | 65.15 | 811 | 795 | 162.4 |
| A | 0 | 226 | 7239 | 39.68 | 811 | 795 | 162.4 |
| A | 15 | 239 | 6706 | 36.4 | 811 | 795 | 162.4 |
| B | 4 | 173 | 41946 | 270.81 | 801 | 782 | 152.0 |
| B | 4 | 48 | 25477 | 162.46 | 801 | 782 | 152.0 |
| B | 12 | 111 | 17787 | 111.87 | 801 | 782 | 152.0 |
| C | 3 | 233 | 212984 | 1180.53 | 787 | 792 | 179.7 |
| C | 13 | 61 | 5686 | 27.23 | 787 | 792 | 179.7 |
| C | 14 | 234 | 3645 | 15.87 | 787 | 792 | 179.7 |
| D | 13 | 122 | 6213775 | 40551.33 | 631 | 615 | 153.2 |
| D | 2 | 33 | 86768 | 562.29 | 631 | 615 | 153.2 |
| D | 2 | 234 | 18198 | 114.76 | 631 | 615 | 153.2 |
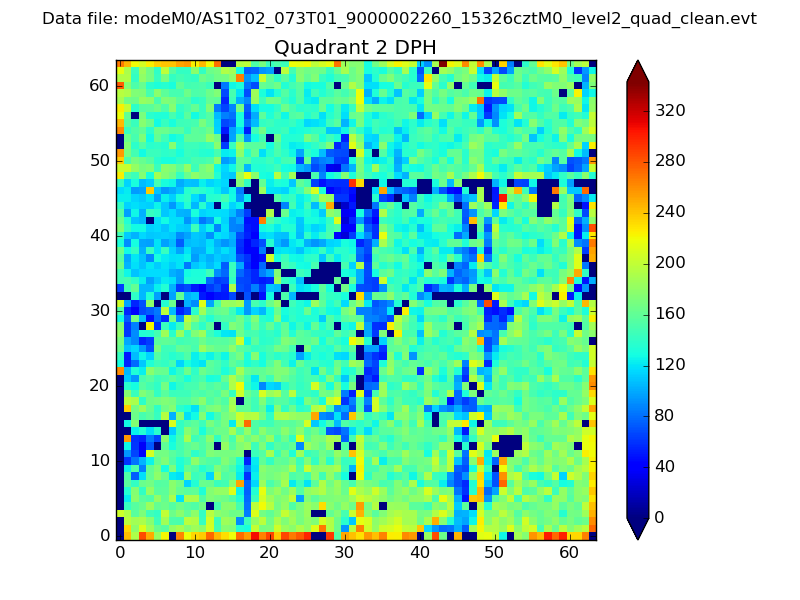
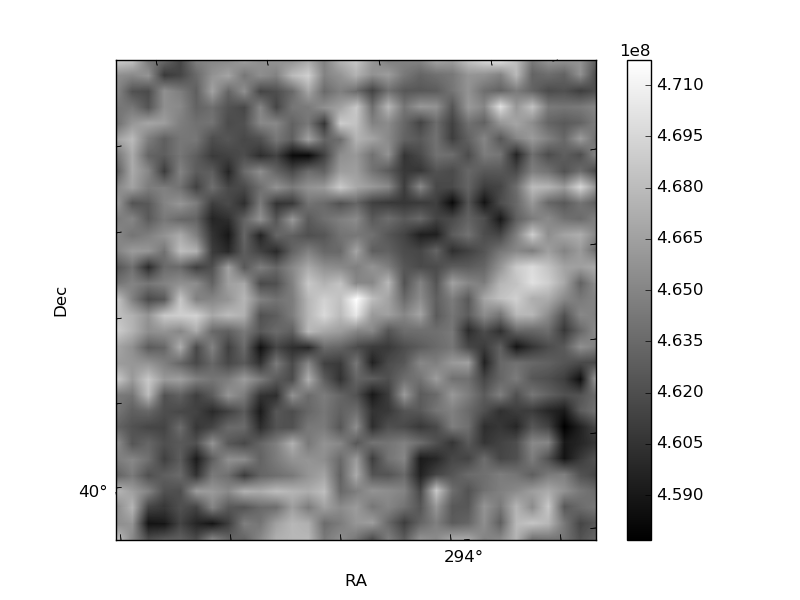
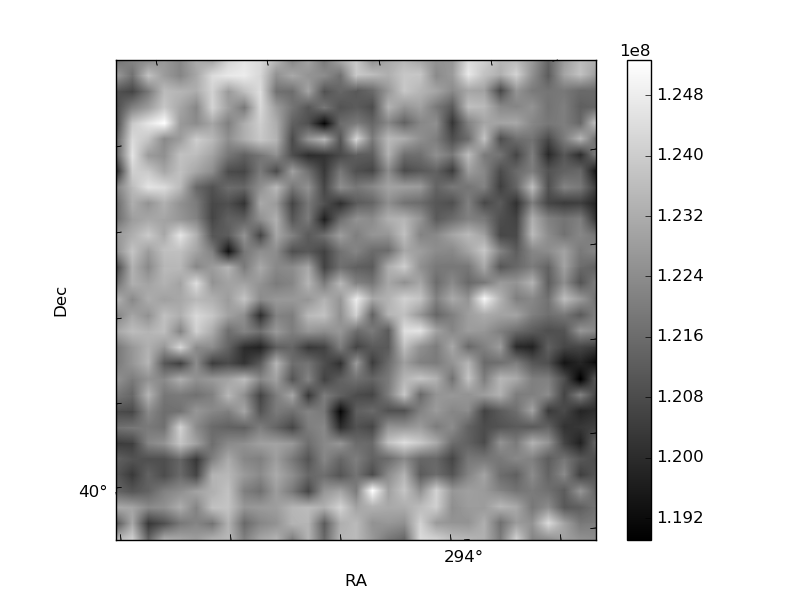
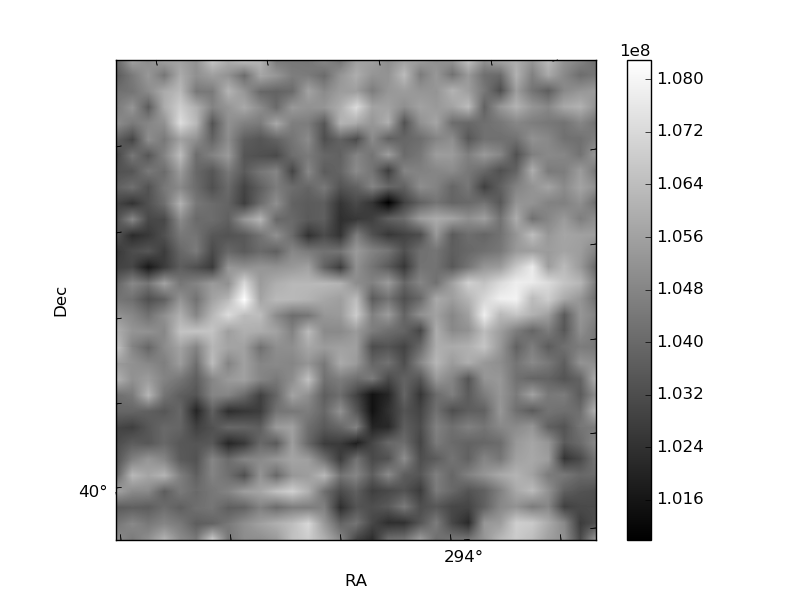
Histogram calculated using DETX and DETY for each event in the final _common_clean file
| Quadrant A |  |
 |
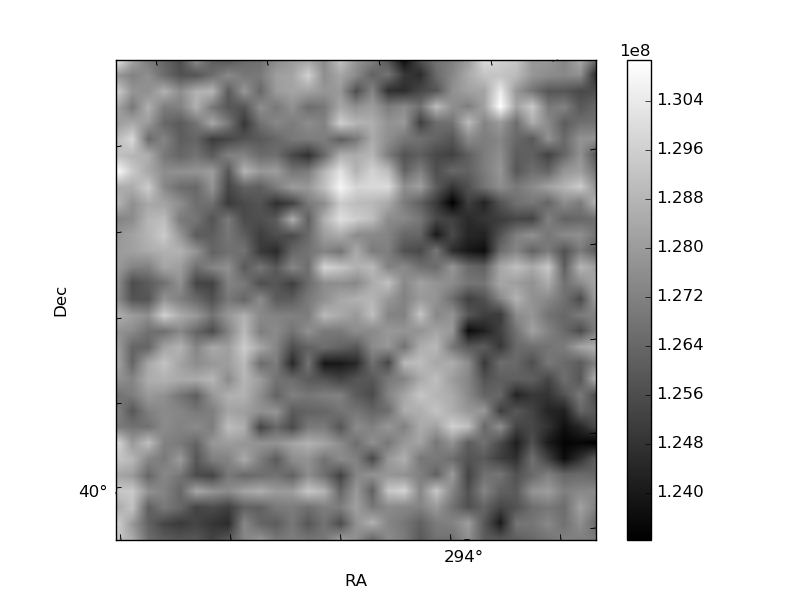
Quadrant B |
|---|---|---|---|
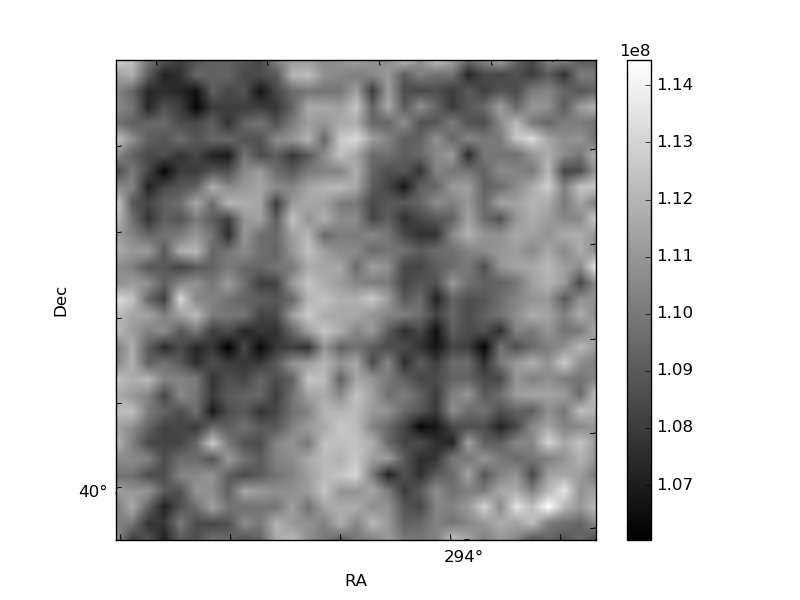
| Quadrant D |  |
 |
Quadrant C |
| Plot type | Count rate plots | Images |
|---|---|---|
| Comparison with Poisson distribution Blue bars denote a histogram of data divided into 1 sec bins. Red curve is a Poisson curve with rate = median count rate of data. |
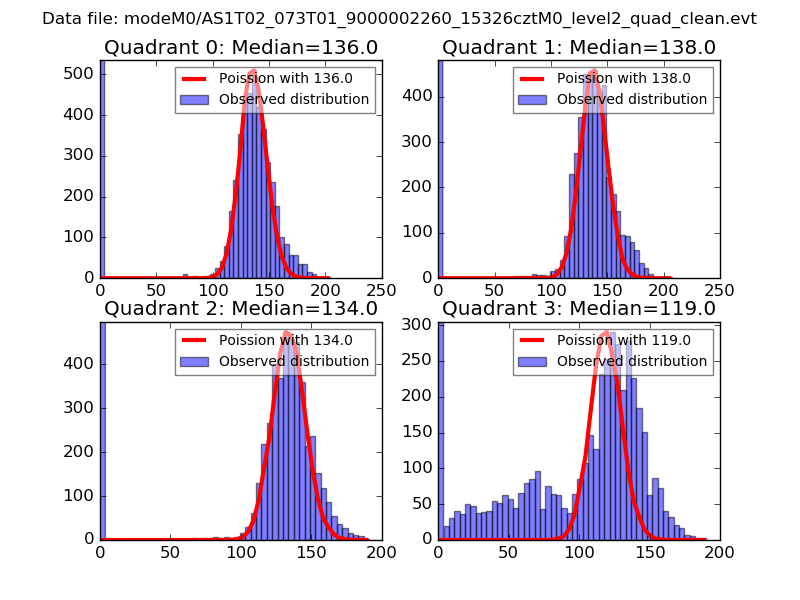 |
 |
| Quadrant-wise count rates Data is divided into 100 sec bins |
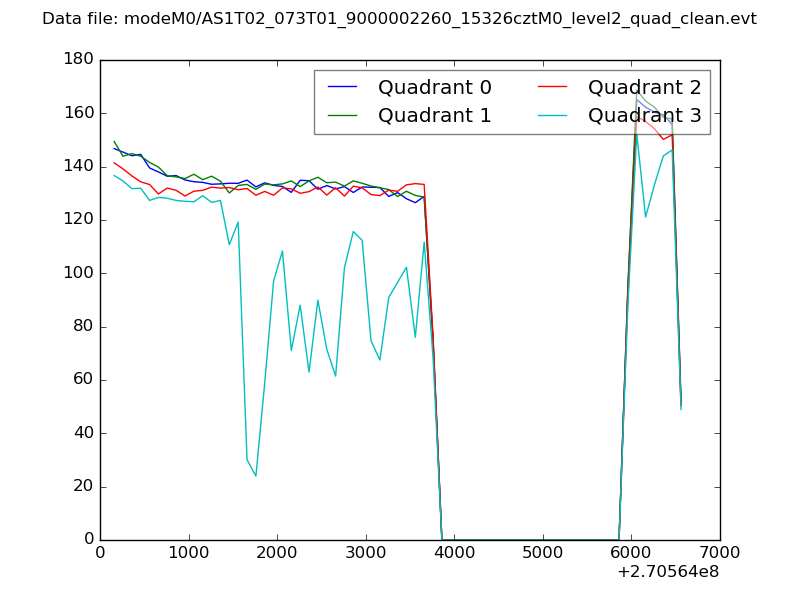 |
|
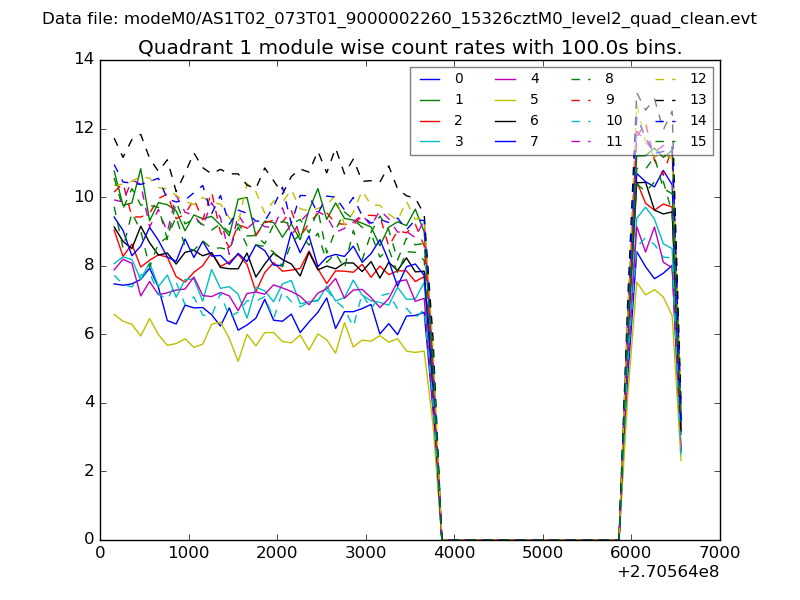
| Module-wise count rates for Quadrant A Data is divided into 100 sec bins |
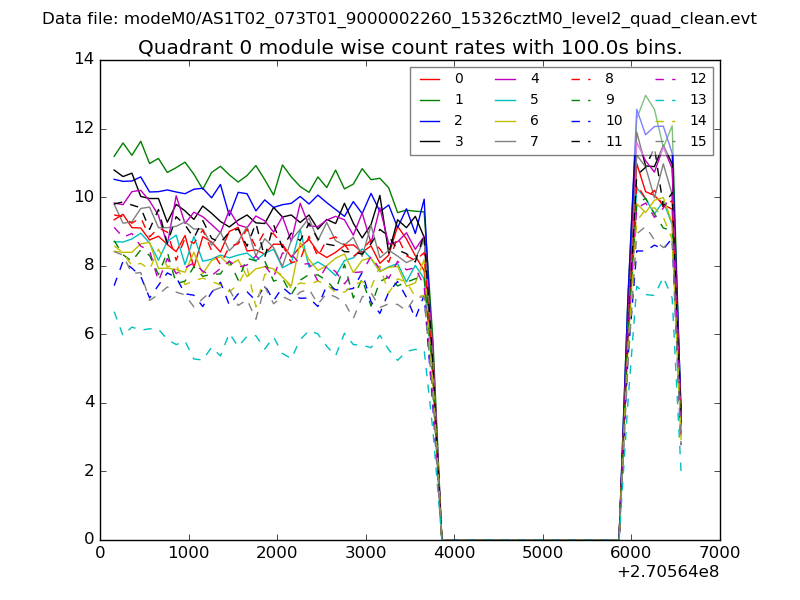 |
 |
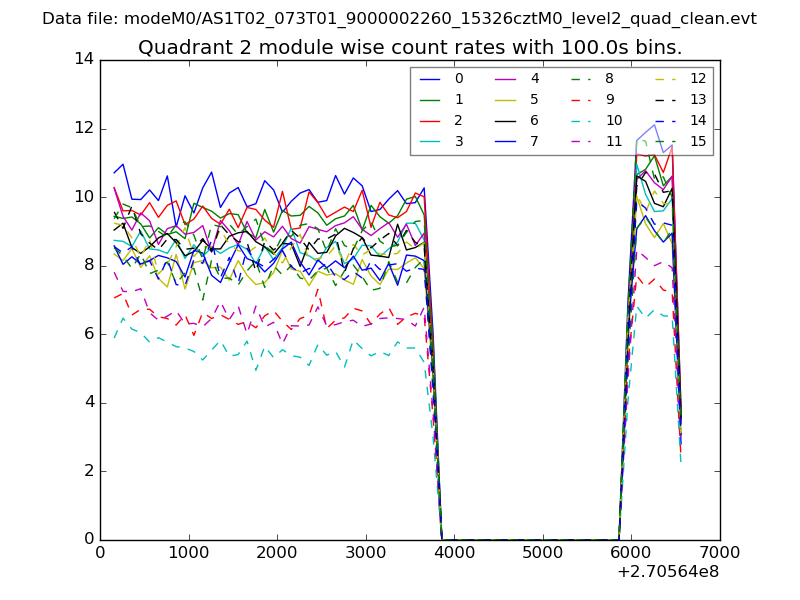
| Module-wise count rates for Quadrant B Data is divided into 100 sec bins |
 |
 |
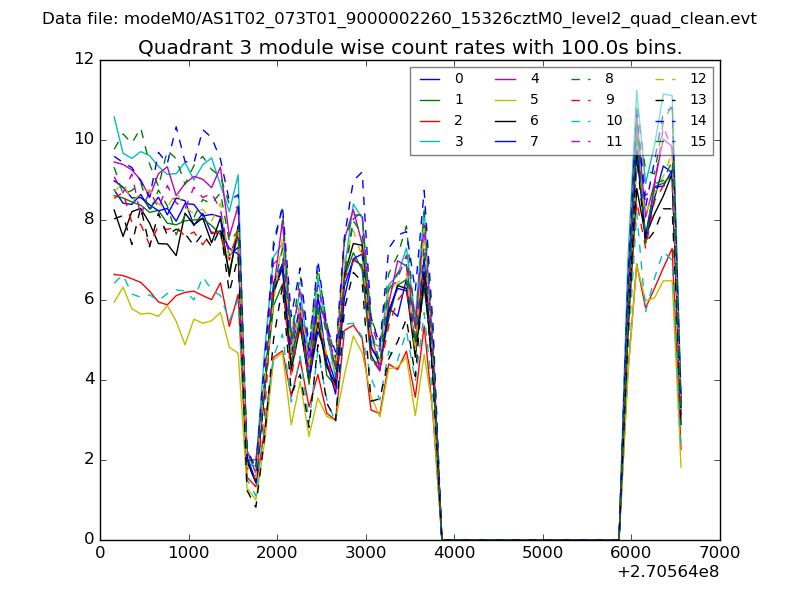
| Module-wise count rates for Quadrant C Data is divided into 100 sec bins |
 |
 |
| Module-wise count rates for Quadrant D Data is divided into 100 sec bins |
 |
 |
| Parameter | Plot |
|---|---|
| CZT HV Monitor | 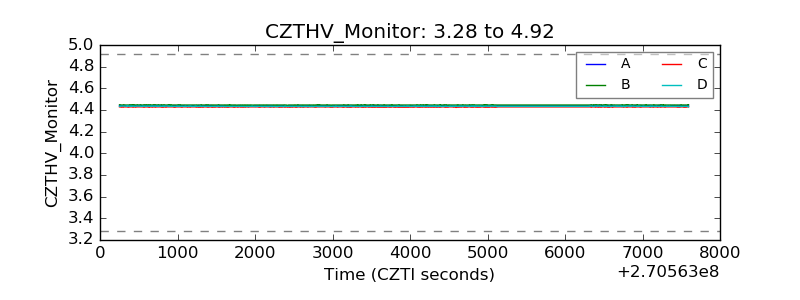 |
| D_VDD | 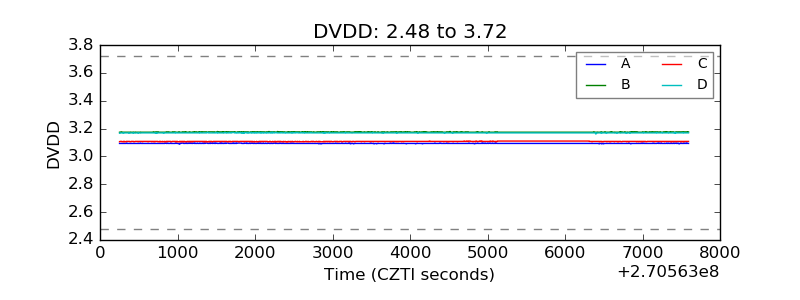 |
| Temperature 1 | 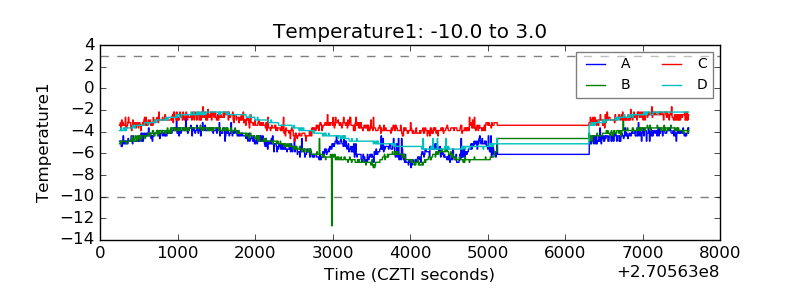 |
| Veto HV Monitor | 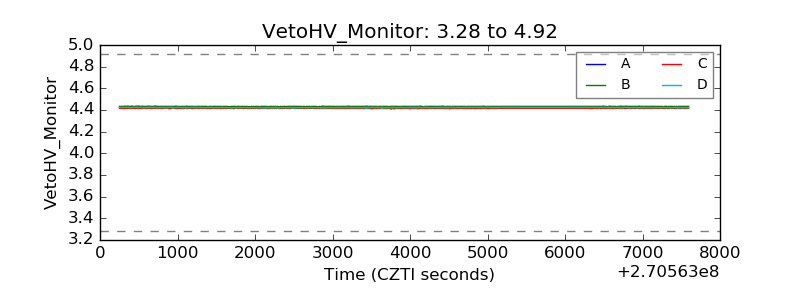 |
| Veto LLD | 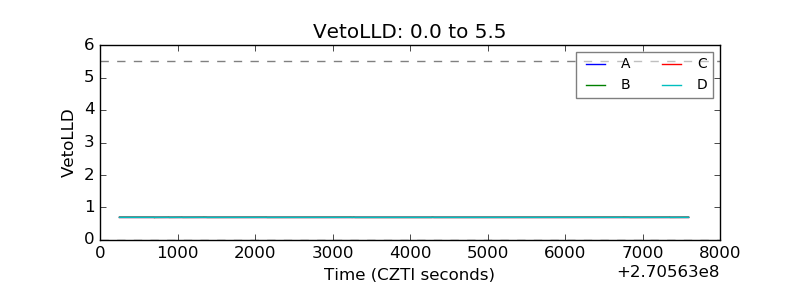 |
| Alpha Counter | 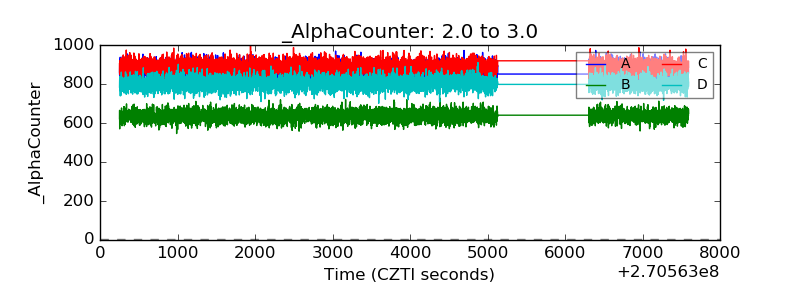 |
| _CPM_Rate | 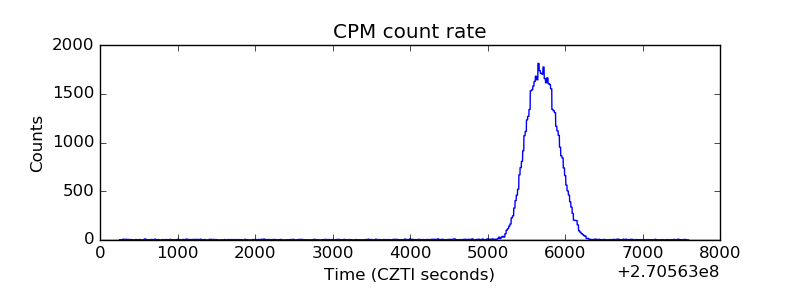 |
| CZT Counter | 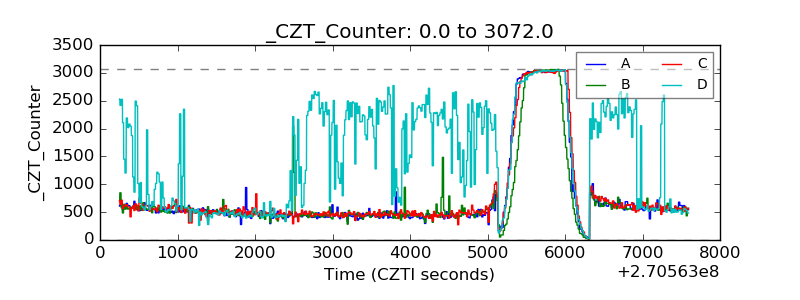 |
| +2.5 Volts monitor |  |
| +5 Volts monitor | 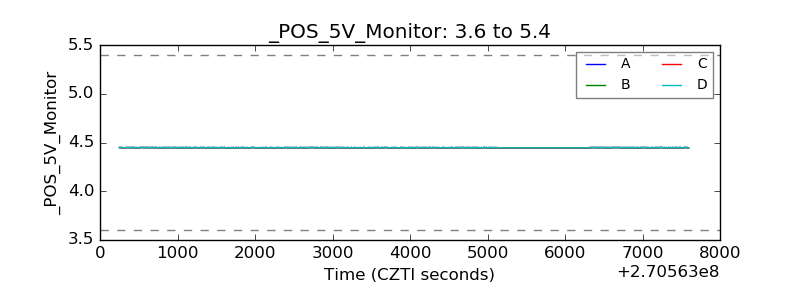 |
| _ROLL_ROT | 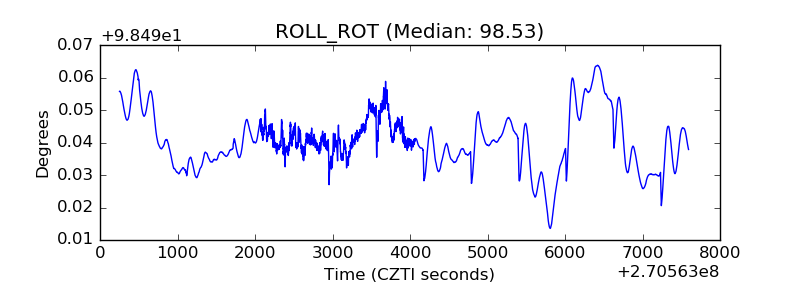 |
| _Roll_DEC | 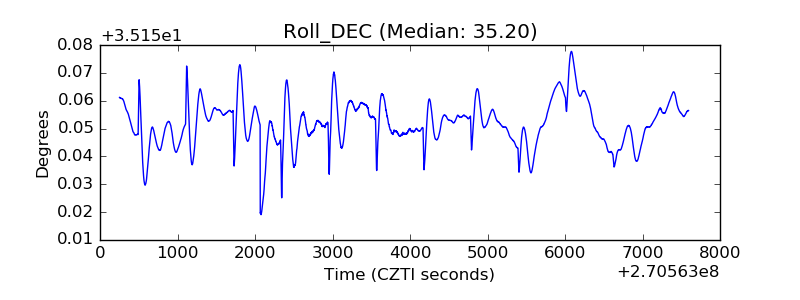 |
| _Roll_RA | 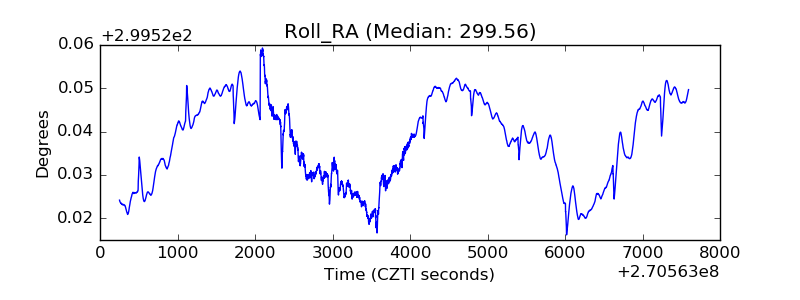 |
| Veto Counter | 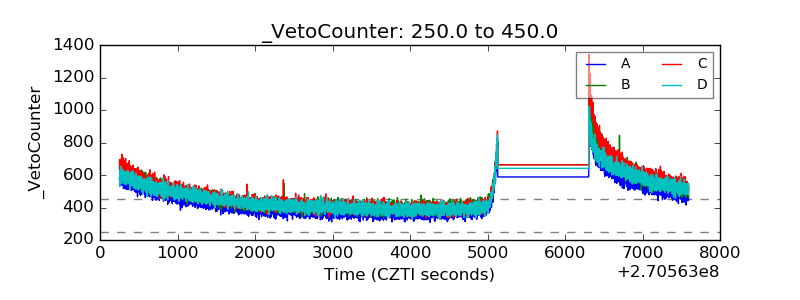 |