| Param | Original file | Final file |
|---|---|---|
| Filename | modeM0/AS1T02_073T01_9000002260_15327cztM0_level2.evt | modeM0/AS1T02_073T01_9000002260_15327cztM0_level2_quad_clean.evt |
| Size (bytes) | 508,803,840 | 102,611,520 |
| Size | 485.2 MB | 97.9 MB |
| Events in quadrant A | 3,094,054 | 687,320 |
| Events in quadrant B | 3,225,988 | 694,196 |
| Events in quadrant C | 3,328,224 | 680,148 |
| Events in quadrant D | 5,353,304 | 626,253 |
| Mode SS | |||
|---|---|---|---|
| Quadrant | BADHDUFLAG | Total packets | Discarded packets |
| A | 0 | 124 | 0 |
| B | 0 | 124 | 0 |
| C | 0 | 124 | 0 |
| D | 0 | 124 | 0 |
| Mode M0 | |||
|---|---|---|---|
| Quadrant | BADHDUFLAG | Total packets | Discarded packets |
| A | 0 | 13068 | 2 |
| B | 0 | 13413 | 1 |
| C | 0 | 13559 | 1 |
| D | 0 | 19790 | 1 |
| Mode M9 | |||
|---|---|---|---|
| Quadrant | BADHDUFLAG | Total packets | Discarded packets |
| A | 0 | 12 | 0 |
| B | 0 | 12 | 0 |
| C | 0 | 12 | 0 |
| D | 0 | 12 | 0 |
| Quadrant | Total seconds | Saturated seconds | Saturation percentage |
|---|---|---|---|
| A | 6001 | 74 | 1.233128% |
| B | 6001 | 80 | 1.333111% |
| C | 6001 | 65 | 1.083153% |
| D | 6001 | 899 | 14.980837% |
Noise dominated data is calculated using 1-second bins in cleaned event files. If a bin has >2000 counts, and if more than 50% of those come from <1% of pixels, then it is considered to be noise-dominated and hence unusable.
| Quadrant | # 1 sec bins | Bins with >0 counts | Bins with >2000 counts | High rate bins dominated by noise | Noise dominated (total time) | Noise dominated (detector-on time) | Marked lightcurve |
|---|---|---|---|---|---|---|---|
| A | 7272 | 6003 | 0 | 0 | 0.00% | 0.00% | 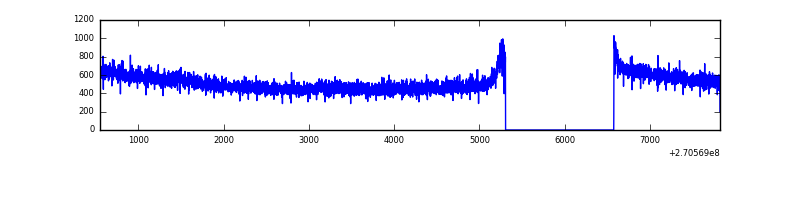 |
| B | 7272 | 6002 | 3 | 3 | 0.04% | 0.05% | 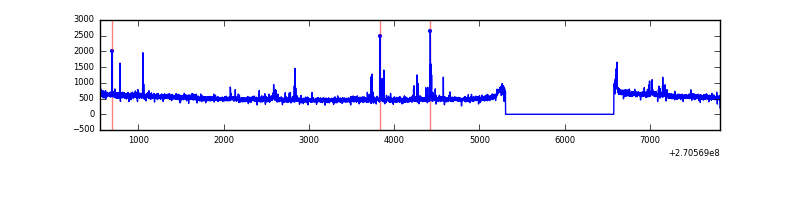 |
| C | 7272 | 6002 | 7 | 7 | 0.10% | 0.12% | 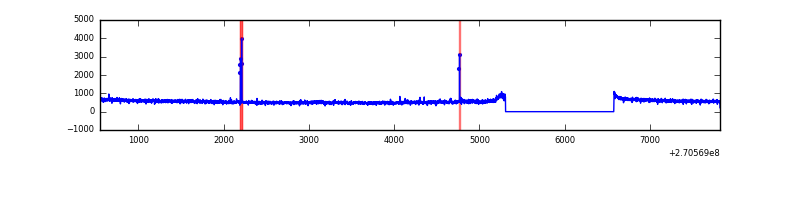 |
| D | 7272 | 6002 | 654 | 654 | 8.99% | 10.90% | 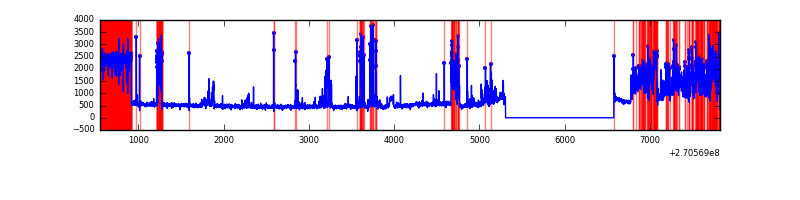 |
Top three noisy pixels from each quadrant. If the there are fewer than three noisy pixels in the level2.evt file, extra rows are filled as -1
| Pixel properties | Quadrant properties | ||||||
|---|---|---|---|---|---|---|---|
| Quadrant | DetID | PixID | Counts | Sigma | Mean | Median | Sigma |
| A | 15 | 239 | 13840 | 81.57 | 802 | 786 | 160.0 |
| A | 0 | 226 | 7093 | 39.41 | 802 | 786 | 160.0 |
| A | 12 | 194 | 5894 | 31.92 | 802 | 786 | 160.0 |
| B | 4 | 173 | 91760 | 612.06 | 795 | 777 | 148.7 |
| B | 4 | 48 | 17835 | 114.75 | 795 | 777 | 148.7 |
| B | 12 | 111 | 17376 | 111.66 | 795 | 777 | 148.7 |
| C | 3 | 233 | 246517 | 1370.28 | 786 | 792 | 179.3 |
| C | 10 | 22 | 16848 | 89.54 | 786 | 792 | 179.3 |
| C | 13 | 61 | 5645 | 27.06 | 786 | 792 | 179.3 |
| D | 13 | 122 | 2289348 | 13014.84 | 731 | 712 | 175.8 |
| D | 2 | 33 | 234705 | 1330.65 | 731 | 712 | 175.8 |
| D | 10 | 70 | 47348 | 265.21 | 731 | 712 | 175.8 |
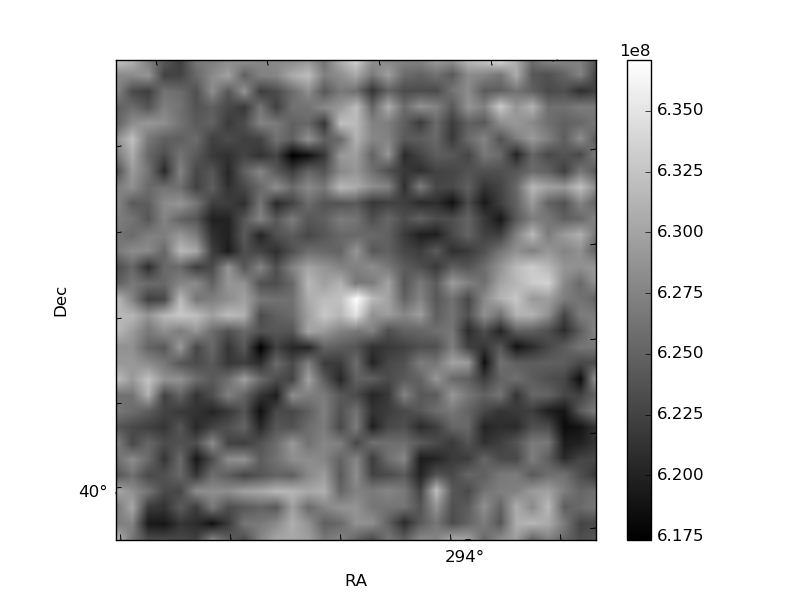
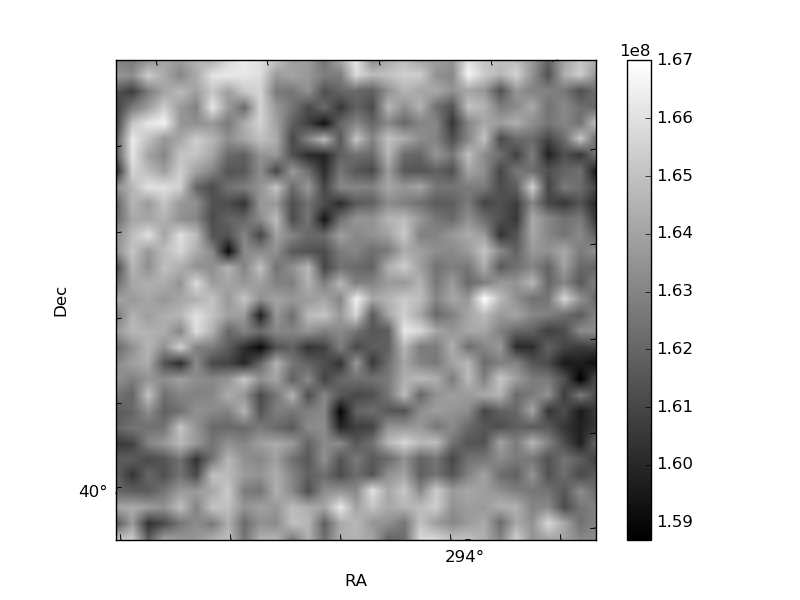
Histogram calculated using DETX and DETY for each event in the final _common_clean file
| Quadrant A | 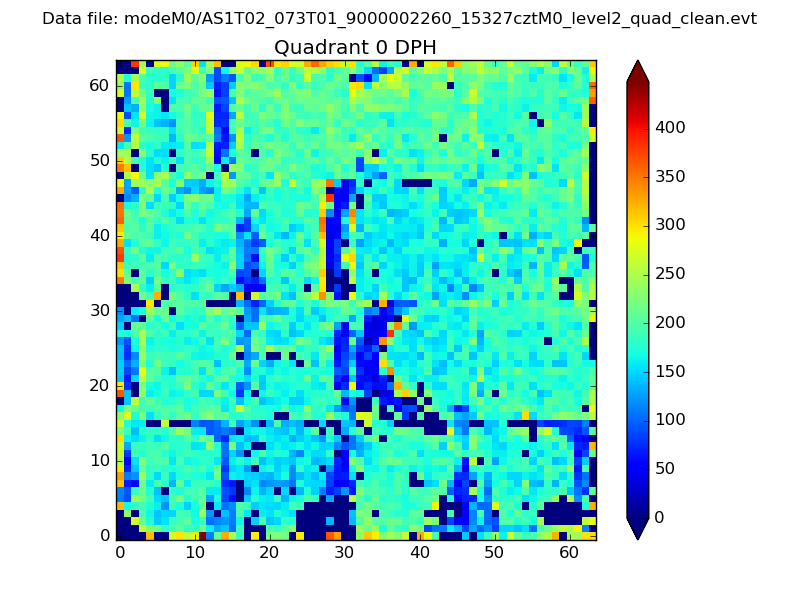 |
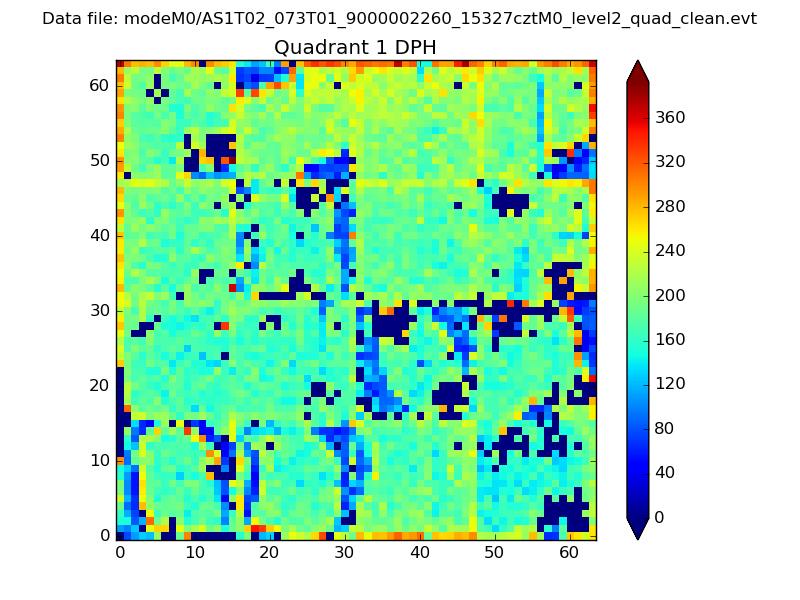 |
Quadrant B |
|---|---|---|---|
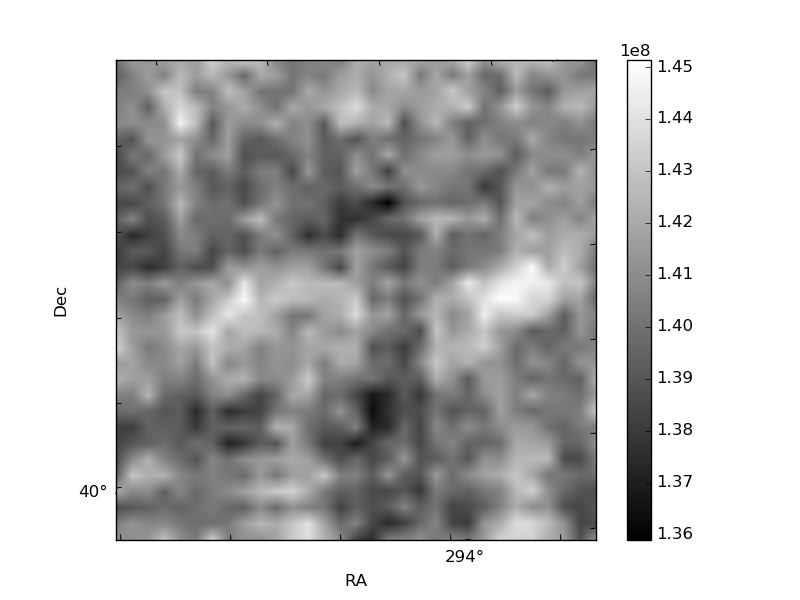
| Quadrant D | 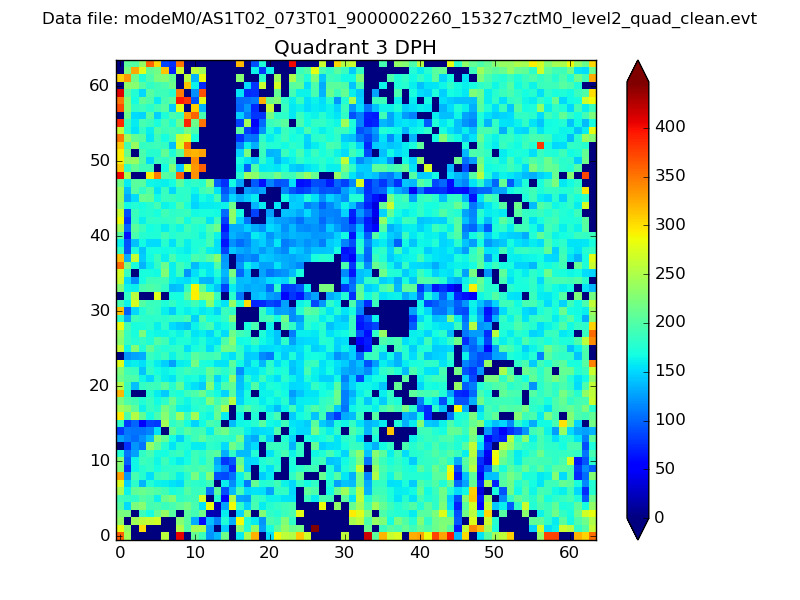 |
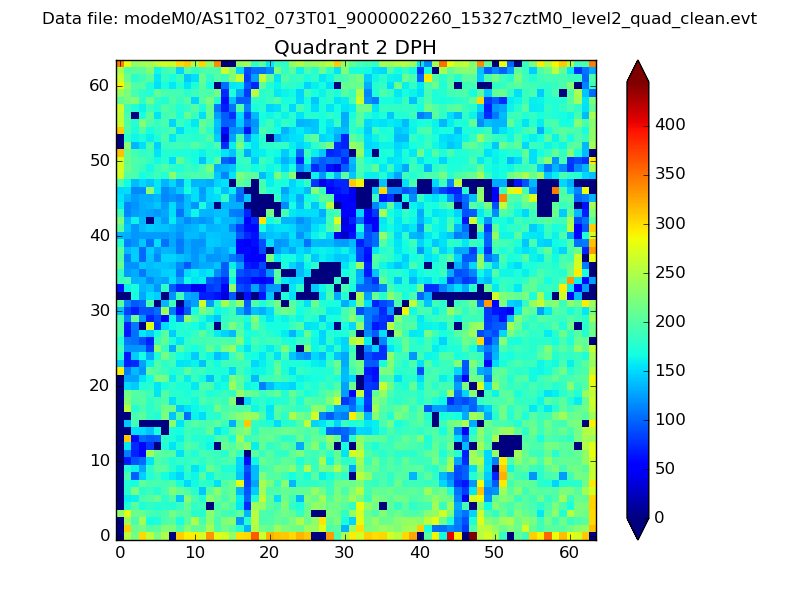 |
Quadrant C |
| Plot type | Count rate plots | Images |
|---|---|---|
| Comparison with Poisson distribution Blue bars denote a histogram of data divided into 1 sec bins. Red curve is a Poisson curve with rate = median count rate of data. |
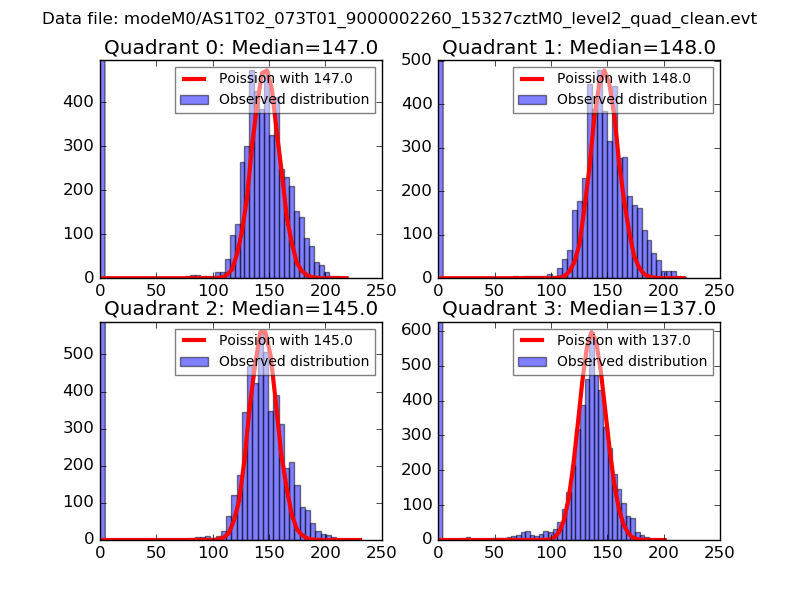 |
 |
| Quadrant-wise count rates Data is divided into 100 sec bins |
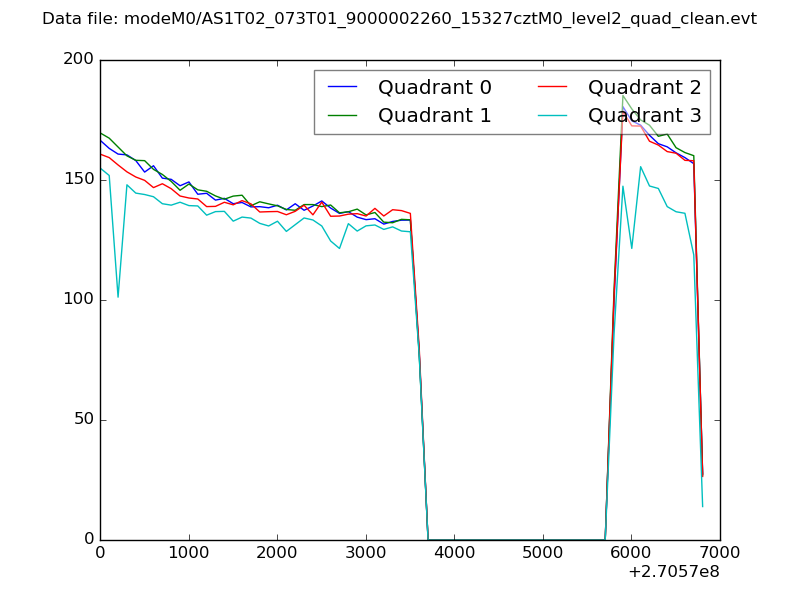 |
|
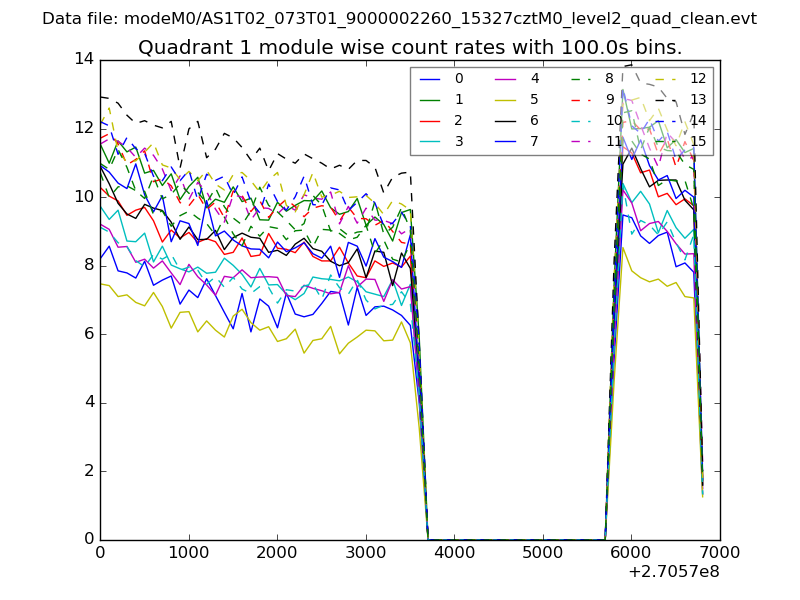
| Module-wise count rates for Quadrant A Data is divided into 100 sec bins |
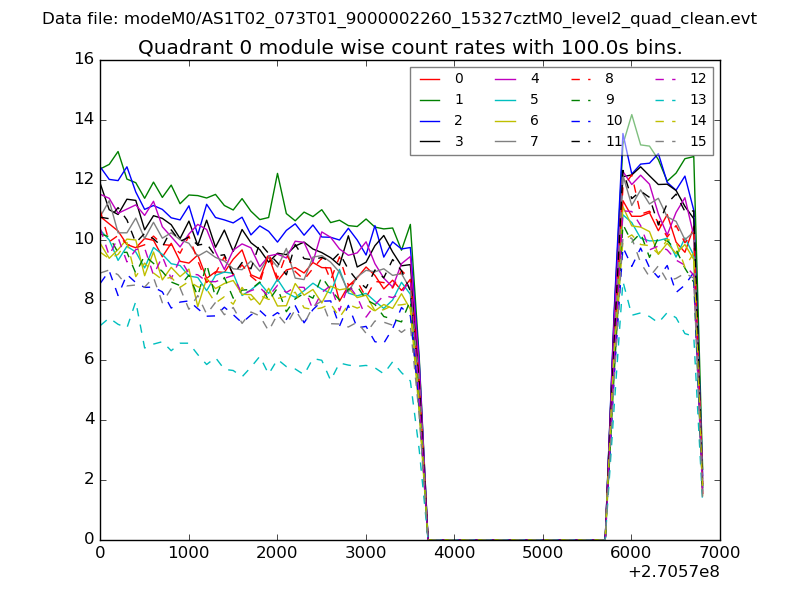 |
 |
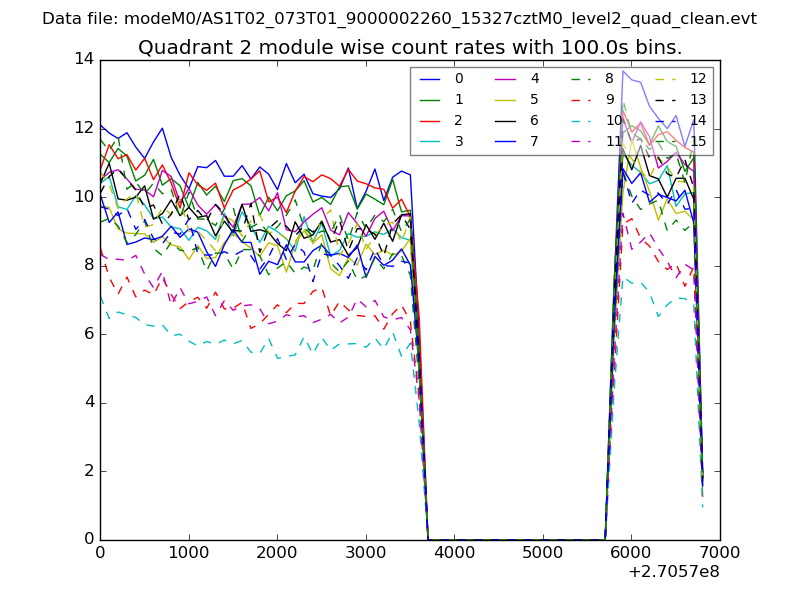
| Module-wise count rates for Quadrant B Data is divided into 100 sec bins |
 |
 |
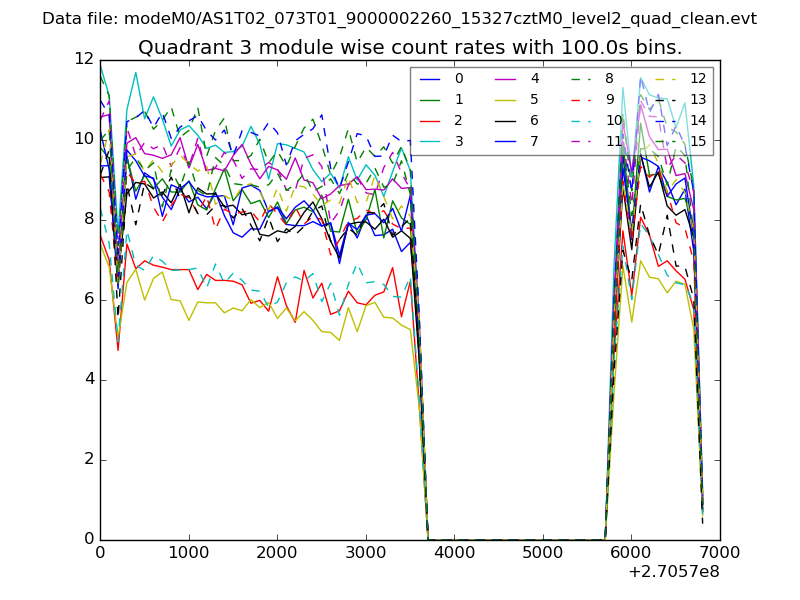
| Module-wise count rates for Quadrant C Data is divided into 100 sec bins |
 |
 |
| Module-wise count rates for Quadrant D Data is divided into 100 sec bins |
 |
 |
| Parameter | Plot |
|---|---|
| CZT HV Monitor | 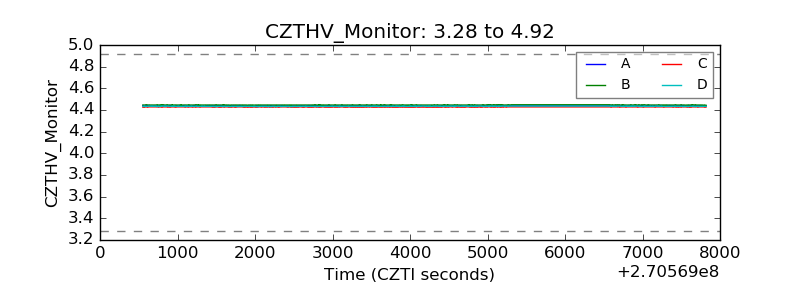 |
| D_VDD |  |
| Temperature 1 |  |
| Veto HV Monitor | 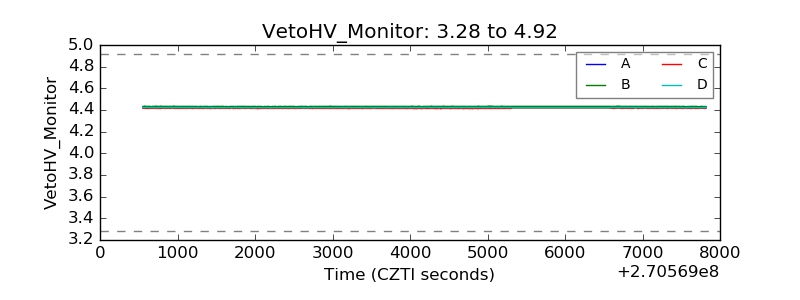 |
| Veto LLD | 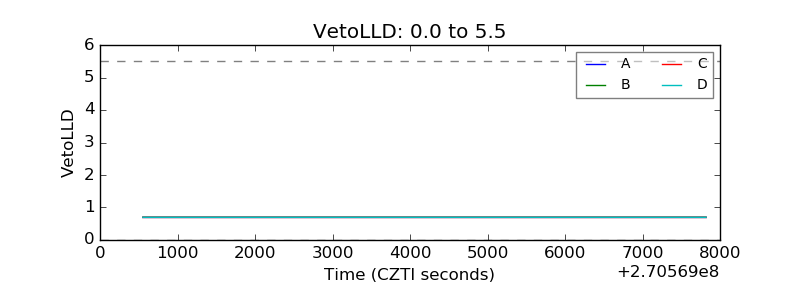 |
| Alpha Counter | 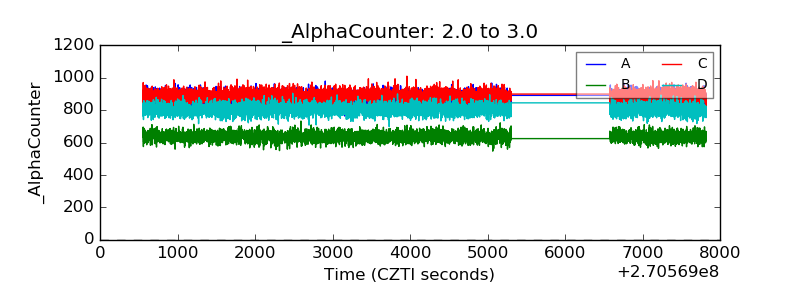 |
| _CPM_Rate | 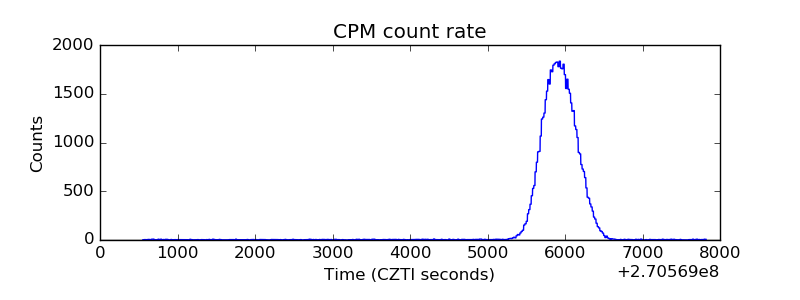 |
| CZT Counter | 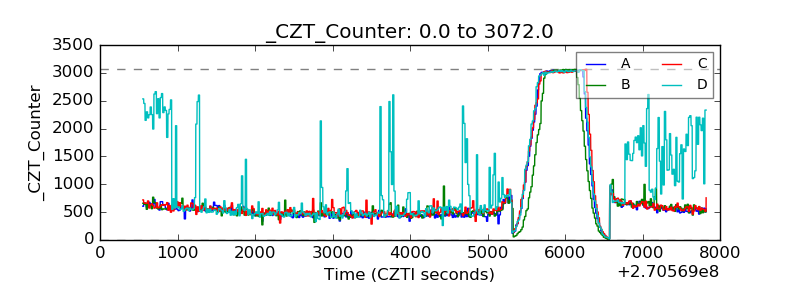 |
| +2.5 Volts monitor |  |
| +5 Volts monitor |  |
| _ROLL_ROT | 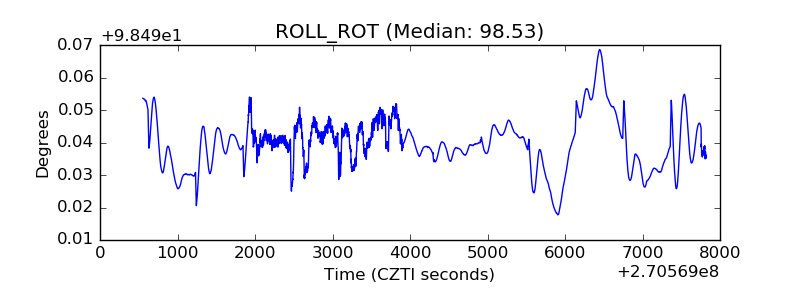 |
| _Roll_DEC | 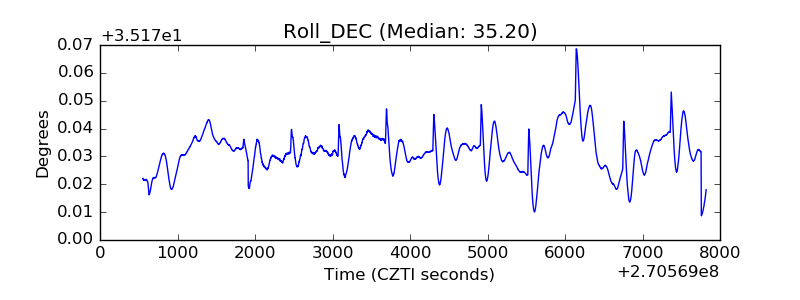 |
| _Roll_RA | 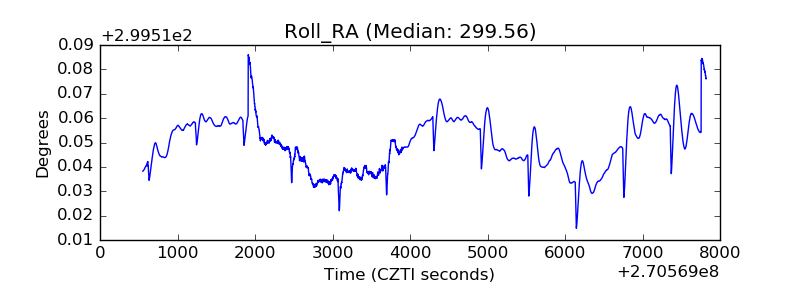 |
| Veto Counter | 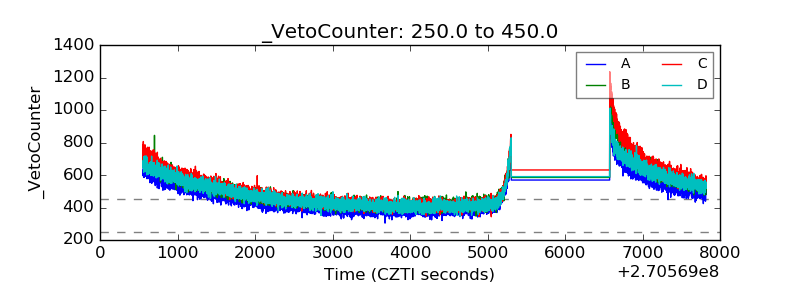 |