| Param | Original file | Final file |
|---|---|---|
| Filename | modeM0/AS1T02_073T01_9000002260_15329cztM0_level2.evt | modeM0/AS1T02_073T01_9000002260_15329cztM0_level2_quad_clean.evt |
| Size (bytes) | 440,824,320 | 108,190,080 |
| Size | 420.4 MB | 103.2 MB |
| Events in quadrant A | 3,121,509 | 710,551 |
| Events in quadrant B | 3,240,124 | 724,844 |
| Events in quadrant C | 3,311,601 | 718,034 |
| Events in quadrant D | 3,249,773 | 684,435 |
| Mode SS | |||
|---|---|---|---|
| Quadrant | BADHDUFLAG | Total packets | Discarded packets |
| A | 0 | 128 | 0 |
| B | 0 | 128 | 0 |
| C | 0 | 128 | 0 |
| D | 0 | 128 | 0 |
| Mode M0 | |||
|---|---|---|---|
| Quadrant | BADHDUFLAG | Total packets | Discarded packets |
| A | 0 | 13324 | 3 |
| B | 0 | 13604 | 2 |
| C | 0 | 13793 | 2 |
| D | 0 | 13651 | 2 |
| Mode M9 | |||
|---|---|---|---|
| Quadrant | BADHDUFLAG | Total packets | Discarded packets |
| A | 0 | 25 | 0 |
| B | 0 | 25 | 0 |
| C | 0 | 25 | 0 |
| D | 0 | 25 | 0 |
| Quadrant | Total seconds | Saturated seconds | Saturation percentage |
|---|---|---|---|
| A | 6288 | 45 | 0.715649% |
| B | 6288 | 86 | 1.367684% |
| C | 6288 | 78 | 1.240458% |
| D | 6288 | 51 | 0.811069% |
Noise dominated data is calculated using 1-second bins in cleaned event files. If a bin has >2000 counts, and if more than 50% of those come from <1% of pixels, then it is considered to be noise-dominated and hence unusable.
| Quadrant | # 1 sec bins | Bins with >0 counts | Bins with >2000 counts | High rate bins dominated by noise | Noise dominated (total time) | Noise dominated (detector-on time) | Marked lightcurve |
|---|---|---|---|---|---|---|---|
| A | 7594 | 6290 | 0 | 0 | 0.00% | 0.00% | 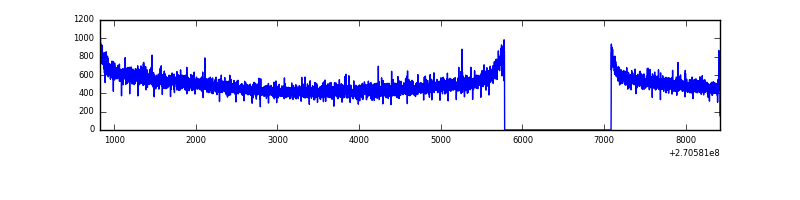 |
| B | 7594 | 6290 | 1 | 1 | 0.01% | 0.02% | 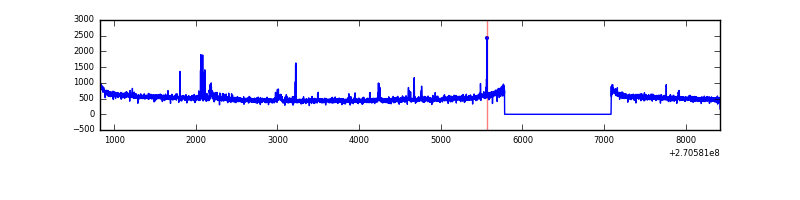 |
| C | 7593 | 6289 | 12 | 12 | 0.16% | 0.19% | 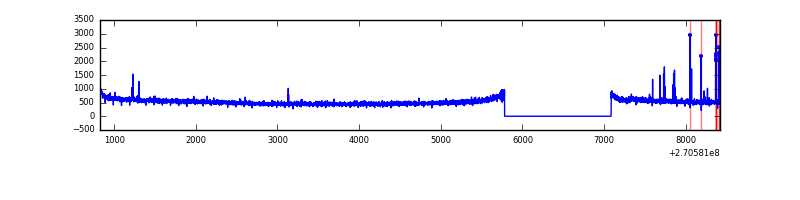 |
| D | 7594 | 6290 | 3 | 3 | 0.04% | 0.05% | 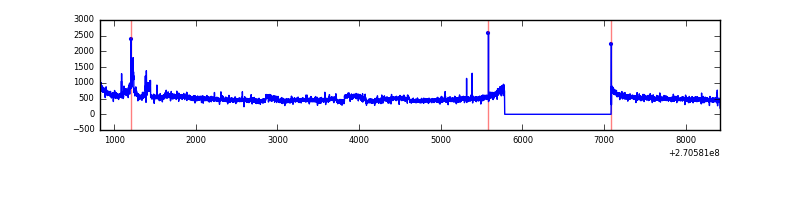 |
Top three noisy pixels from each quadrant. If the there are fewer than three noisy pixels in the level2.evt file, extra rows are filled as -1
| Pixel properties | Quadrant properties | ||||||
|---|---|---|---|---|---|---|---|
| Quadrant | DetID | PixID | Counts | Sigma | Mean | Median | Sigma |
| A | 2 | 79 | 9749 | 55.77 | 809 | 794 | 160.6 |
| A | 0 | 226 | 6975 | 38.49 | 809 | 794 | 160.6 |
| A | 12 | 194 | 5986 | 32.33 | 809 | 794 | 160.6 |
| B | 4 | 173 | 44474 | 288.56 | 809 | 789 | 151.4 |
| B | 12 | 111 | 17924 | 113.19 | 809 | 789 | 151.4 |
| B | 4 | 48 | 16085 | 101.04 | 809 | 789 | 151.4 |
| C | 3 | 233 | 175003 | 944.33 | 804 | 813 | 184.5 |
| C | 13 | 61 | 5618 | 26.05 | 804 | 813 | 184.5 |
| C | 3 | 202 | 1839 | 5.56 | 804 | 813 | 184.5 |
| D | 2 | 33 | 214240 | 1113.96 | 800 | 777 | 191.6 |
| D | 2 | 234 | 19166 | 95.96 | 800 | 777 | 191.6 |
| D | 10 | 70 | 8328 | 39.41 | 800 | 777 | 191.6 |
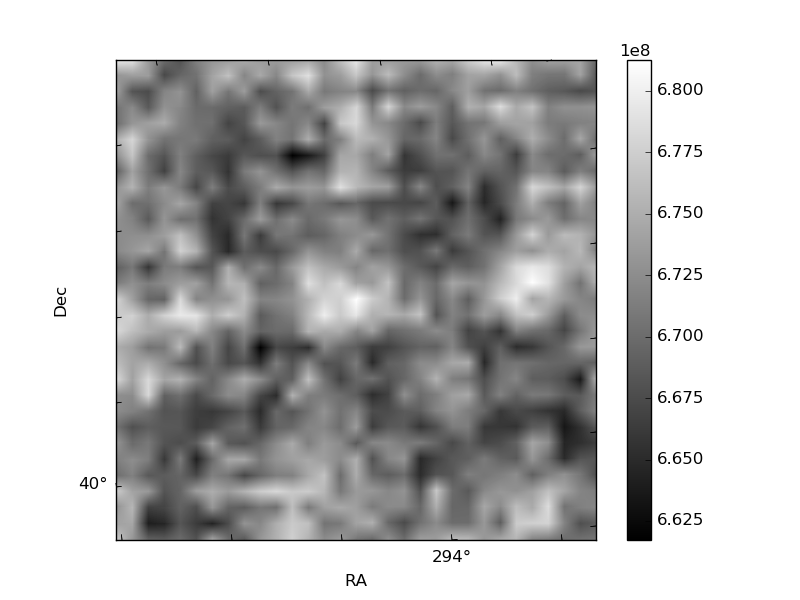
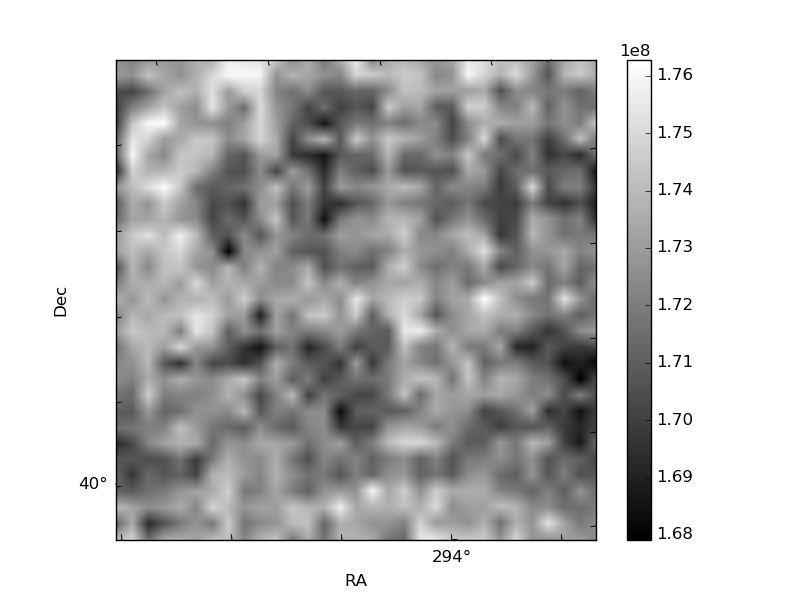
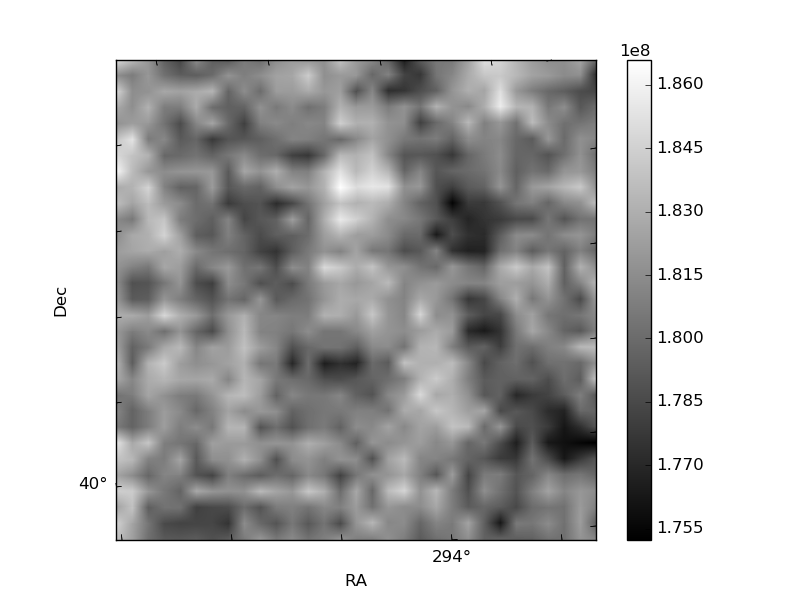
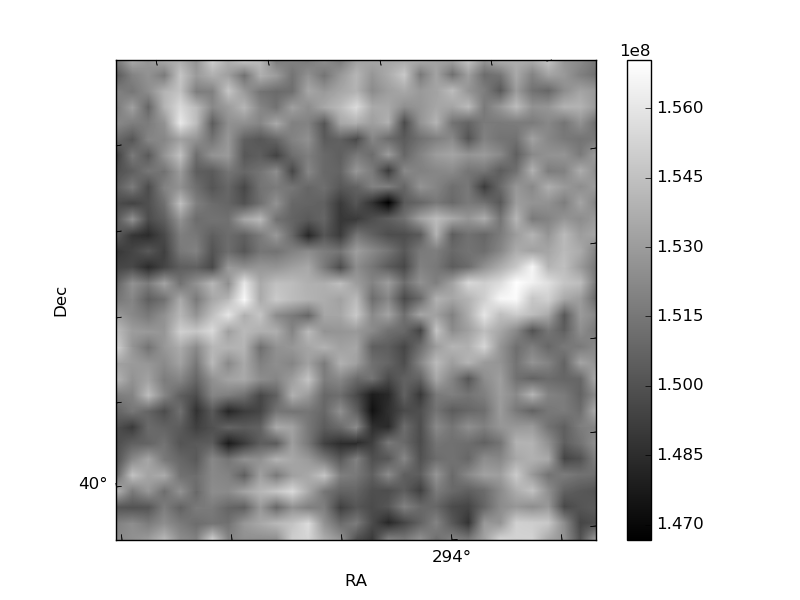
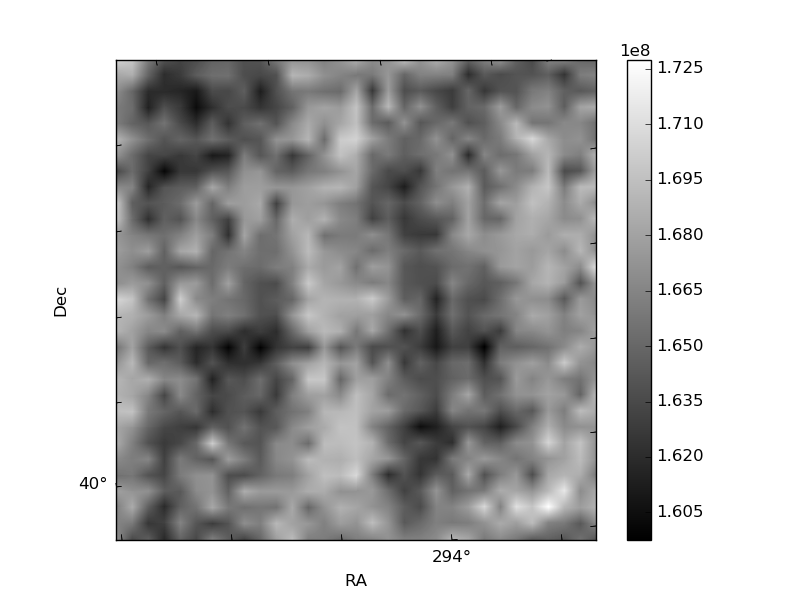
Histogram calculated using DETX and DETY for each event in the final _common_clean file
| Quadrant A | 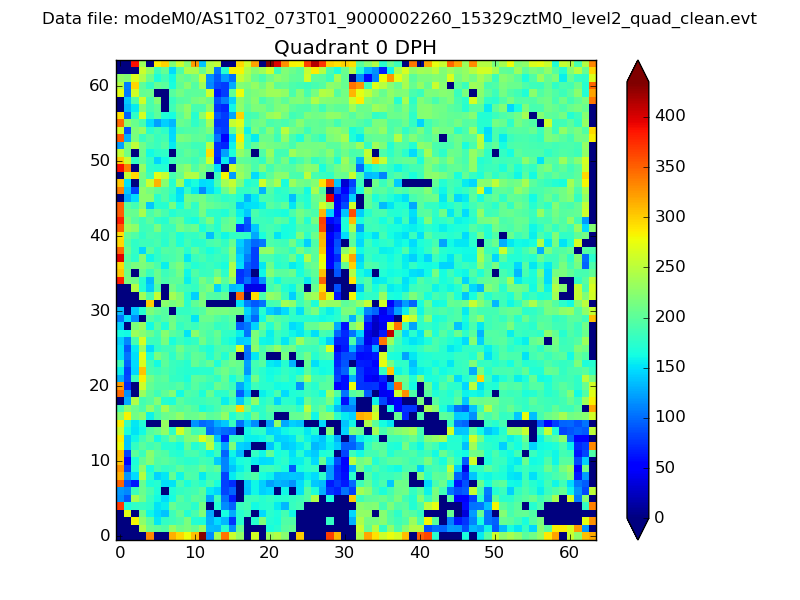 |
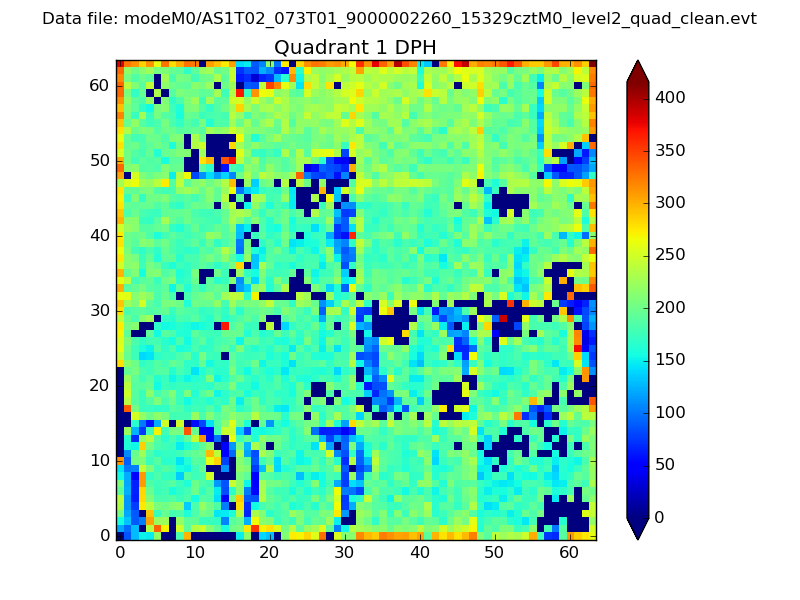 |
Quadrant B |
|---|---|---|---|
| Quadrant D |  |
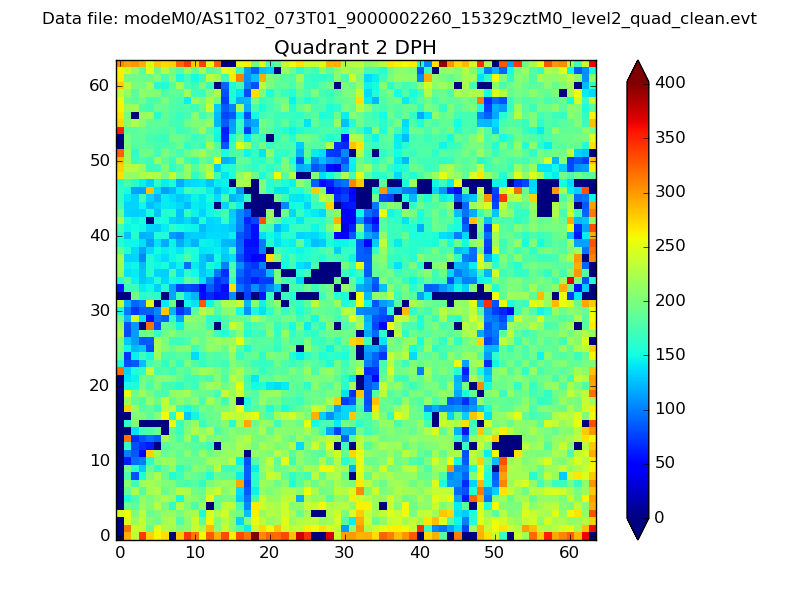 |
Quadrant C |
| Plot type | Count rate plots | Images |
|---|---|---|
| Comparison with Poisson distribution Blue bars denote a histogram of data divided into 1 sec bins. Red curve is a Poisson curve with rate = median count rate of data. |
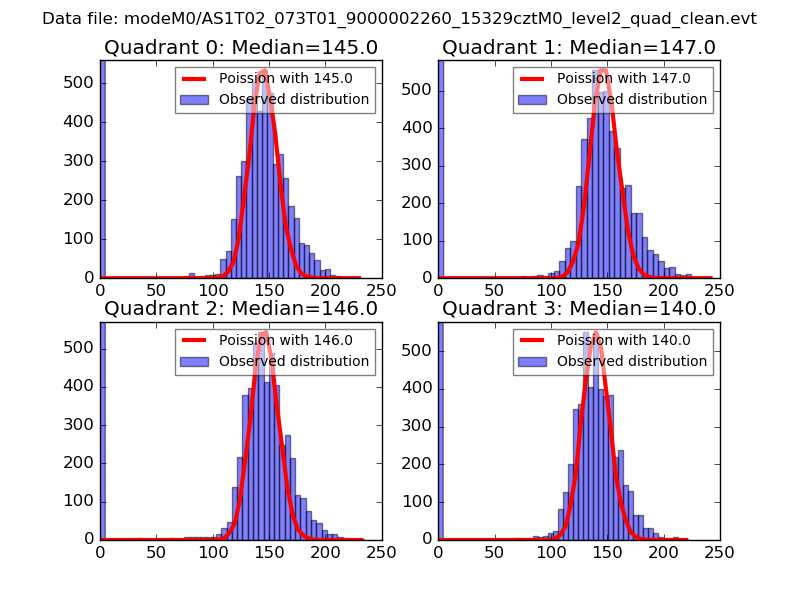 |
 |
| Quadrant-wise count rates Data is divided into 100 sec bins |
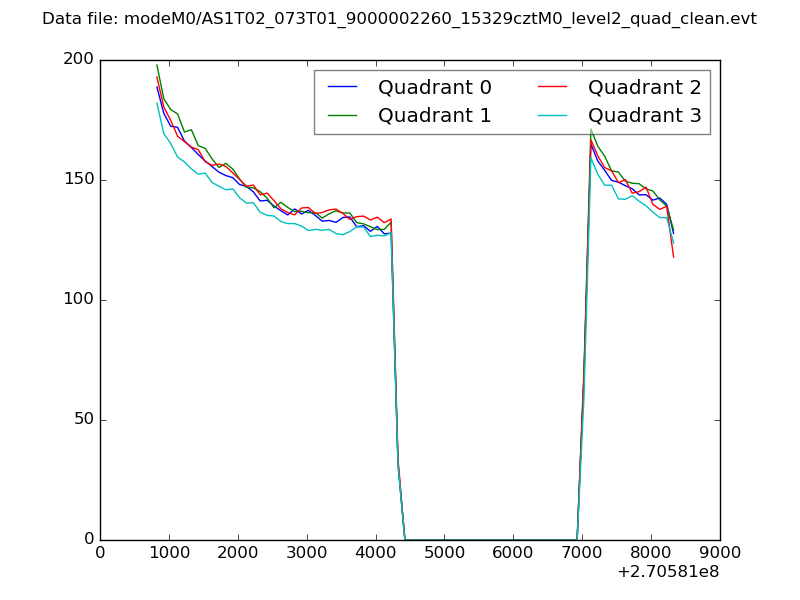 |
|
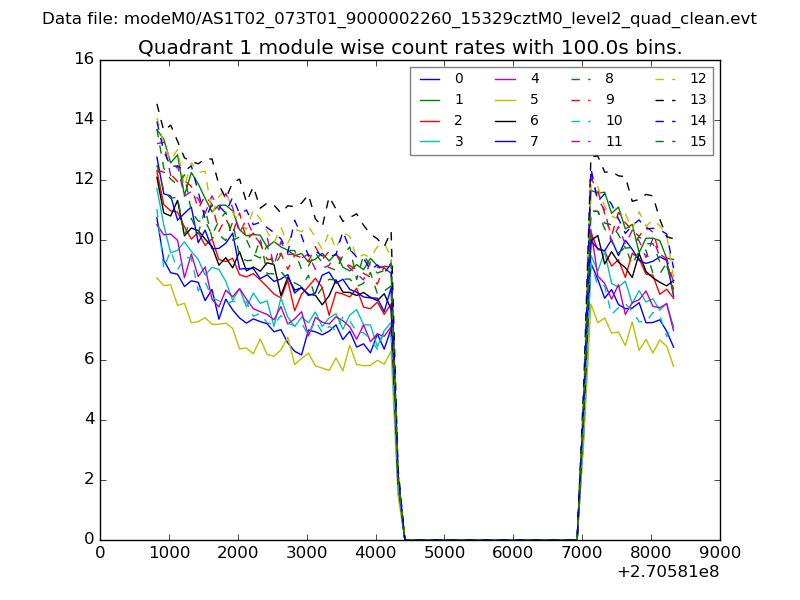
| Module-wise count rates for Quadrant A Data is divided into 100 sec bins |
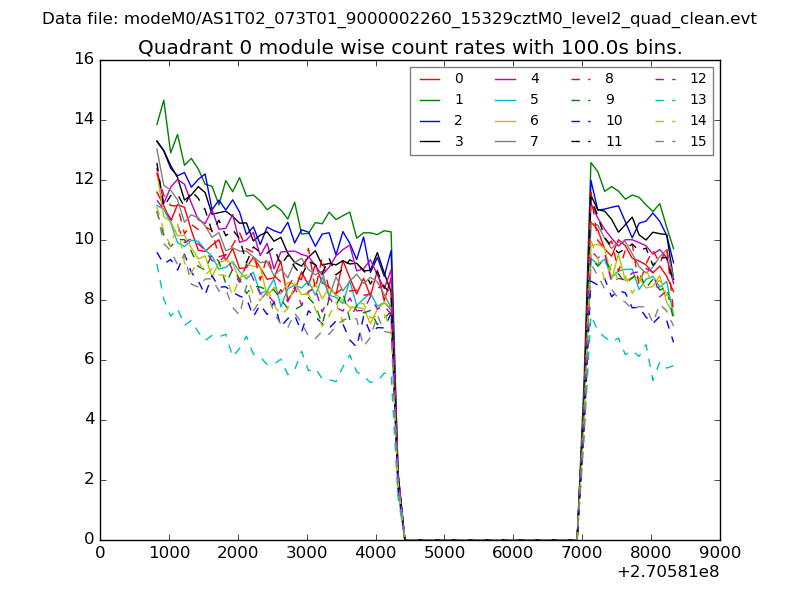 |
 |
| Module-wise count rates for Quadrant B Data is divided into 100 sec bins |
 |
 |
| Module-wise count rates for Quadrant C Data is divided into 100 sec bins |
 |
 |
| Module-wise count rates for Quadrant D Data is divided into 100 sec bins |
 |
 |
| Parameter | Plot |
|---|---|
| CZT HV Monitor | 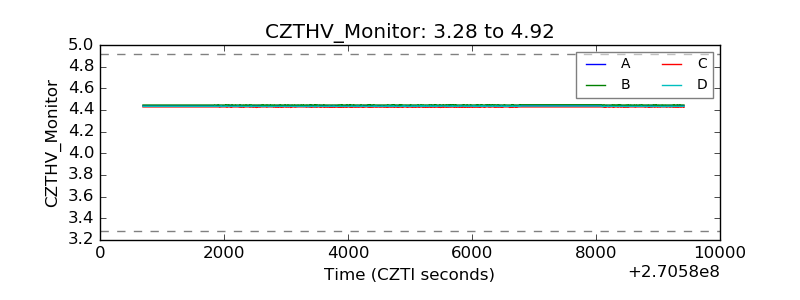 |
| D_VDD | 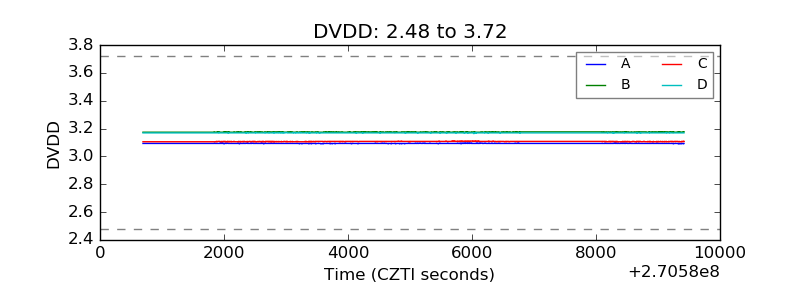 |
| Temperature 1 | 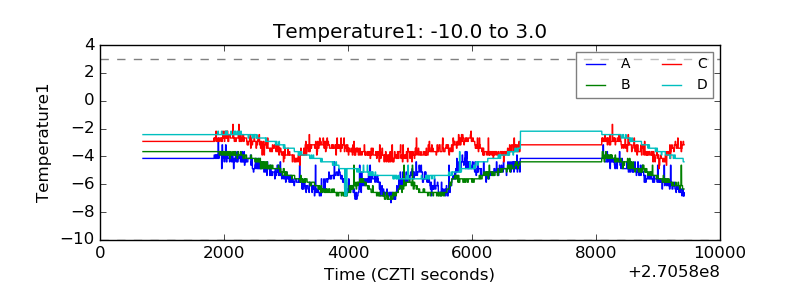 |
| Veto HV Monitor | 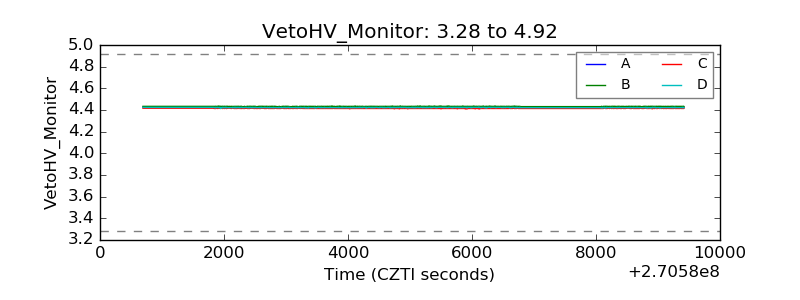 |
| Veto LLD |  |
| Alpha Counter | 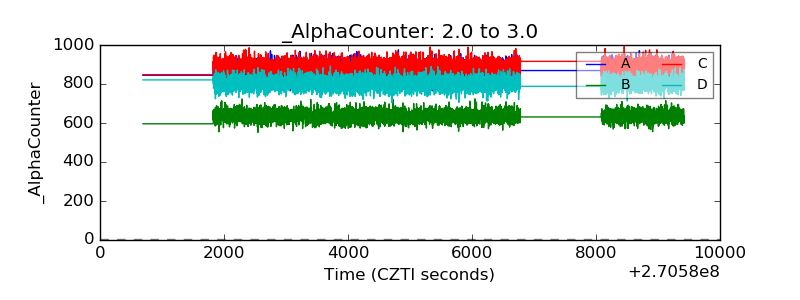 |
| _CPM_Rate | 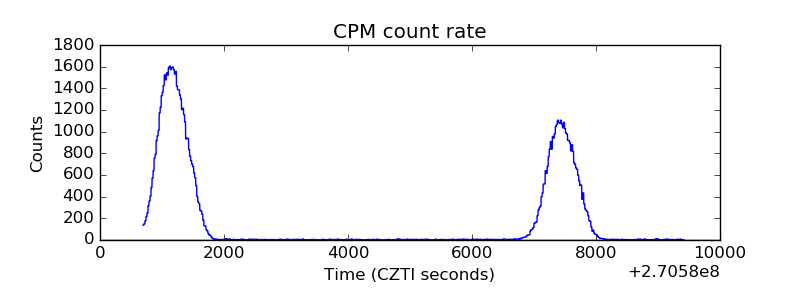 |
| CZT Counter | 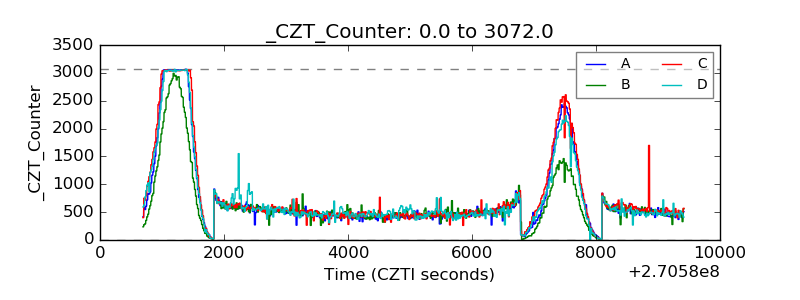 |
| +2.5 Volts monitor |  |
| +5 Volts monitor |  |
| _ROLL_ROT | 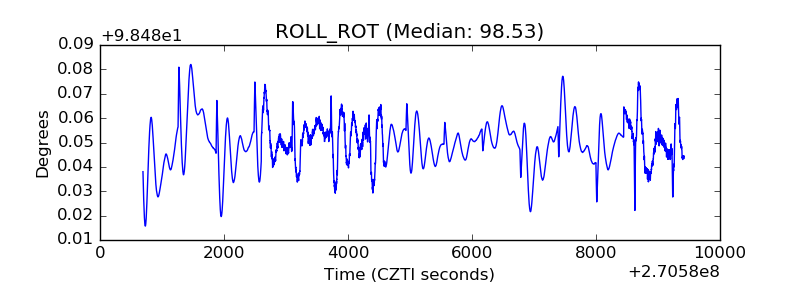 |
| _Roll_DEC | 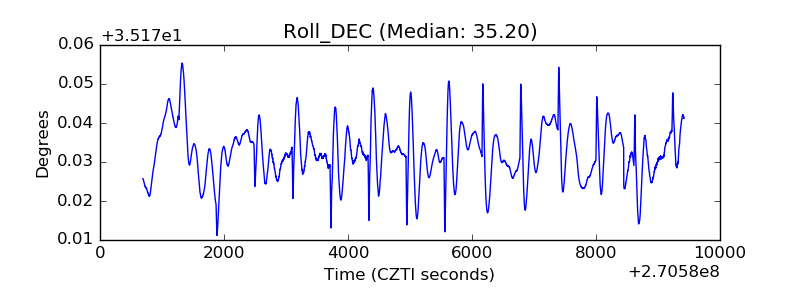 |
| _Roll_RA | 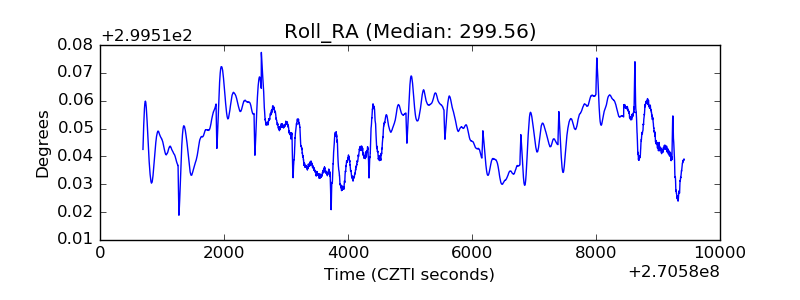 |
| Veto Counter | 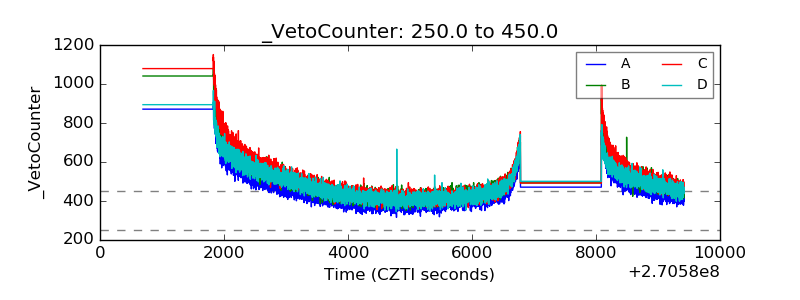 |