| Param | Original file | Final file |
|---|---|---|
| Filename | modeM0/AS1T02_073T01_9000002260_15332cztM0_level2.evt | modeM0/AS1T02_073T01_9000002260_15332cztM0_level2_quad_clean.evt |
| Size (bytes) | 508,199,040 | 102,087,360 |
| Size | 484.7 MB | 97.4 MB |
| Events in quadrant A | 3,492,613 | 652,455 |
| Events in quadrant B | 3,544,235 | 662,537 |
| Events in quadrant C | 3,696,511 | 648,774 |
| Events in quadrant D | 4,162,378 | 620,272 |
| Mode SS | |||
|---|---|---|---|
| Quadrant | BADHDUFLAG | Total packets | Discarded packets |
| A | 0 | 146 | 0 |
| B | 0 | 146 | 0 |
| C | 0 | 146 | 0 |
| D | 0 | 146 | 0 |
| Mode M0 | |||
|---|---|---|---|
| Quadrant | BADHDUFLAG | Total packets | Discarded packets |
| A | 0 | 15300 | 3 |
| B | 0 | 15279 | 2 |
| C | 0 | 15870 | 2 |
| D | 0 | 17572 | 2 |
| Mode M9 | |||
|---|---|---|---|
| Quadrant | BADHDUFLAG | Total packets | Discarded packets |
| A | 0 | 5 | 0 |
| B | 0 | 5 | 0 |
| C | 0 | 5 | 0 |
| D | 0 | 6 | 0 |
| Quadrant | Total seconds | Saturated seconds | Saturation percentage |
|---|---|---|---|
| A | 7298 | 66 | 0.904357% |
| B | 7298 | 91 | 1.246917% |
| C | 7298 | 78 | 1.068786% |
| D | 7298 | 128 | 1.753905% |
Noise dominated data is calculated using 1-second bins in cleaned event files. If a bin has >2000 counts, and if more than 50% of those come from <1% of pixels, then it is considered to be noise-dominated and hence unusable.
| Quadrant | # 1 sec bins | Bins with >0 counts | Bins with >2000 counts | High rate bins dominated by noise | Noise dominated (total time) | Noise dominated (detector-on time) | Marked lightcurve |
|---|---|---|---|---|---|---|---|
| A | 7654 | 7300 | 11 | 11 | 0.14% | 0.15% | 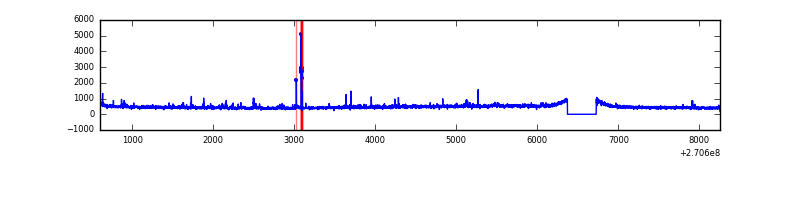 |
| B | 7654 | 7300 | 3 | 3 | 0.04% | 0.04% | 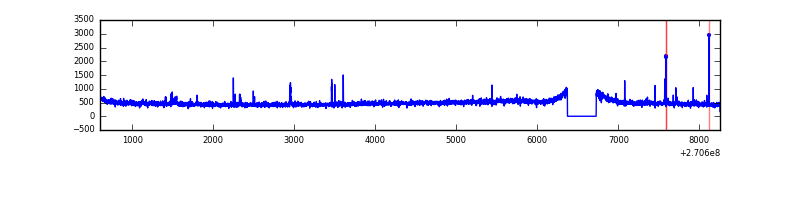 |
| C | 7654 | 7300 | 20 | 20 | 0.26% | 0.27% | 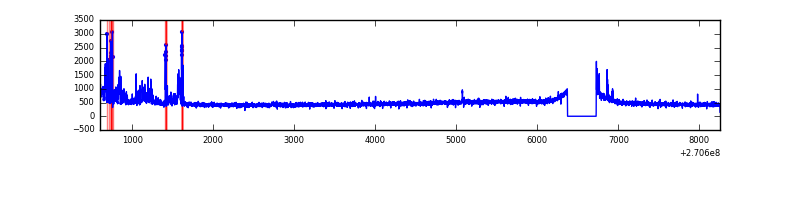 |
| D | 7654 | 7300 | 89 | 89 | 1.16% | 1.22% | 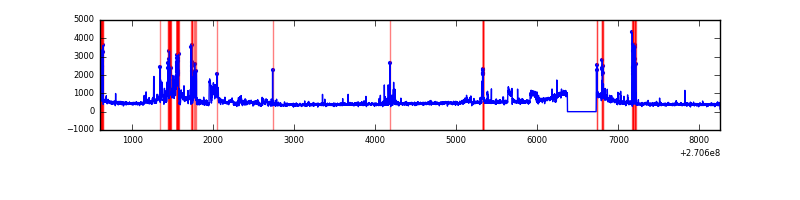 |
Top three noisy pixels from each quadrant. If the there are fewer than three noisy pixels in the level2.evt file, extra rows are filled as -1
| Pixel properties | Quadrant properties | ||||||
|---|---|---|---|---|---|---|---|
| Quadrant | DetID | PixID | Counts | Sigma | Mean | Median | Sigma |
| A | 2 | 79 | 98258 | 553.7 | 866 | 849 | 175.9 |
| A | 9 | 143 | 40092 | 223.06 | 866 | 849 | 175.9 |
| A | 15 | 157 | 17283 | 93.41 | 866 | 849 | 175.9 |
| B | 10 | 16 | 88719 | 529.83 | 867 | 844 | 165.9 |
| B | 0 | 205 | 25769 | 150.28 | 867 | 844 | 165.9 |
| B | 3 | 64 | 25354 | 147.78 | 867 | 844 | 165.9 |
| C | 3 | 233 | 391498 | 1990.79 | 846 | 851 | 196.2 |
| C | 13 | 61 | 6001 | 26.25 | 846 | 851 | 196.2 |
| C | 8 | 128 | 4751 | 19.87 | 846 | 851 | 196.2 |
| D | 2 | 33 | 464394 | 2293.19 | 840 | 816 | 202.2 |
| D | 13 | 122 | 409905 | 2023.65 | 840 | 816 | 202.2 |
| D | 12 | 110 | 70415 | 344.29 | 840 | 816 | 202.2 |
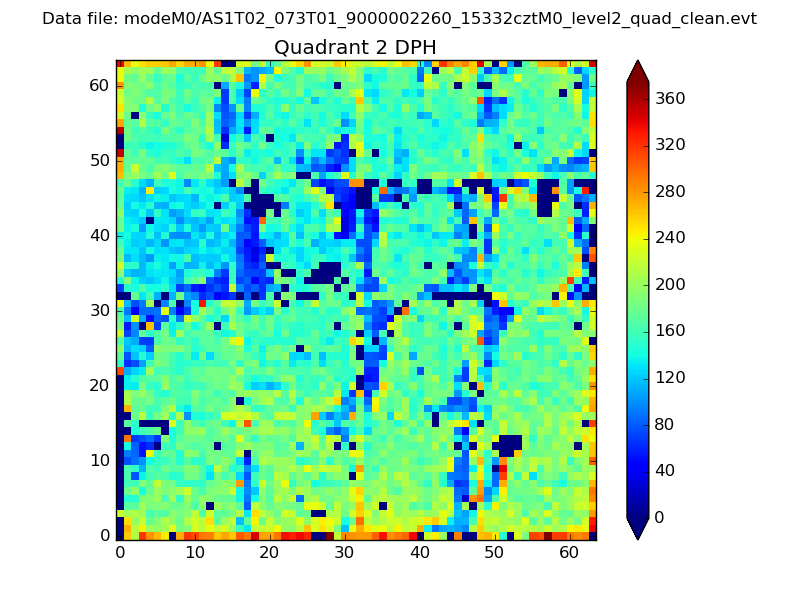
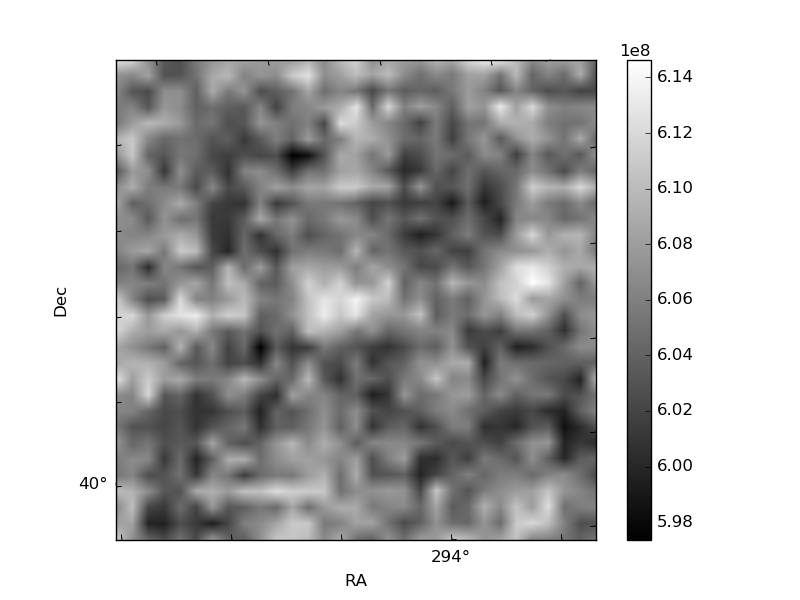
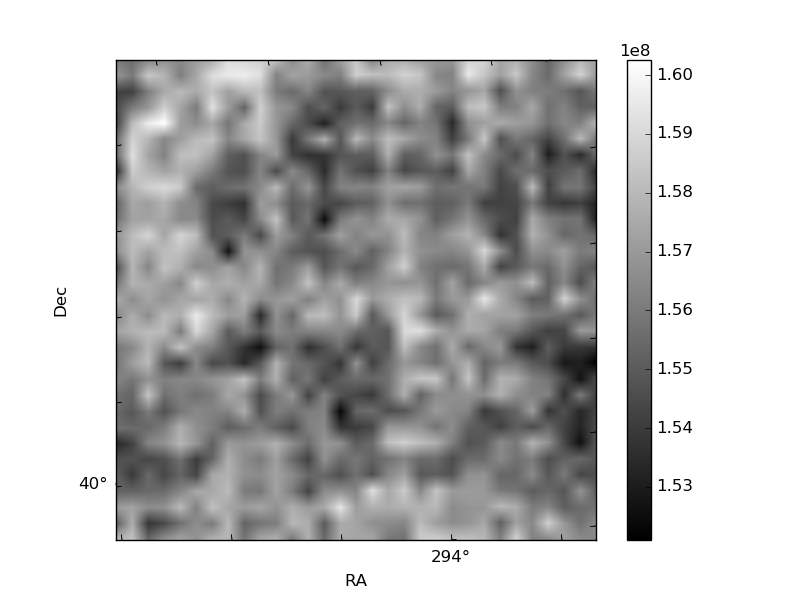
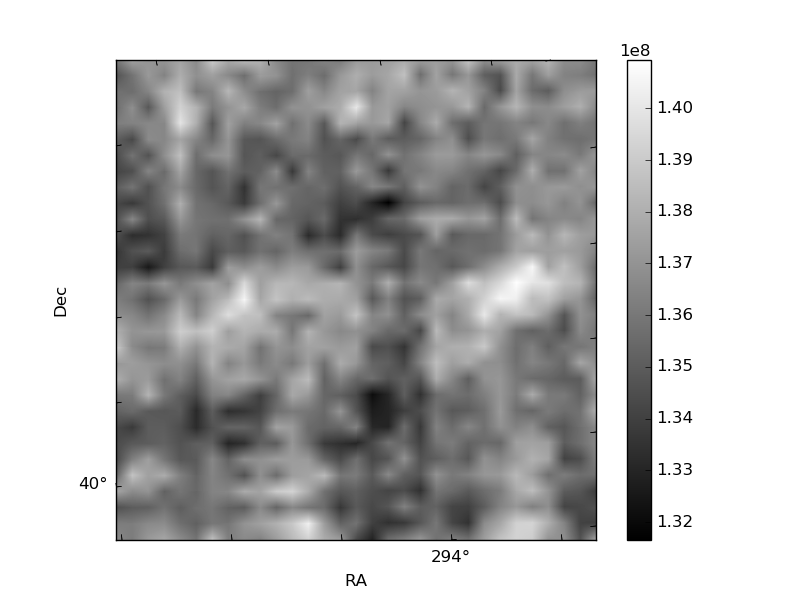
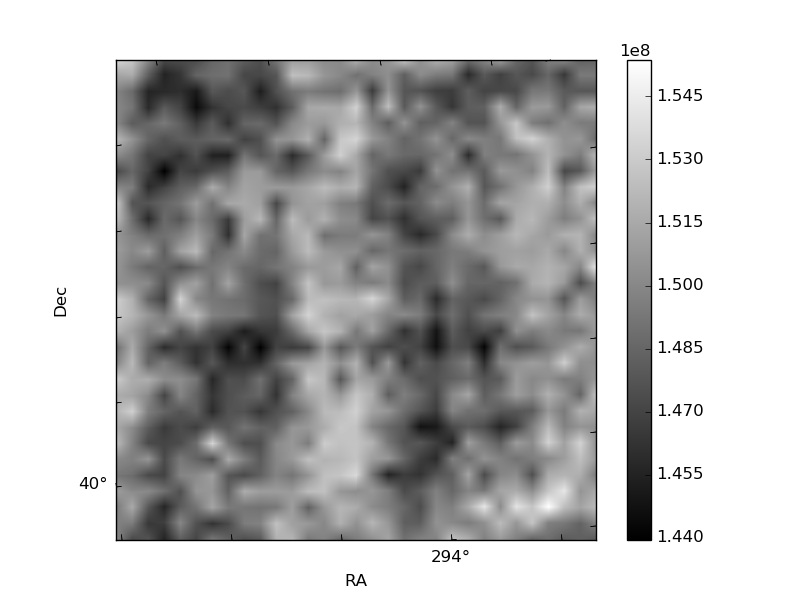
Histogram calculated using DETX and DETY for each event in the final _common_clean file
| Quadrant A | 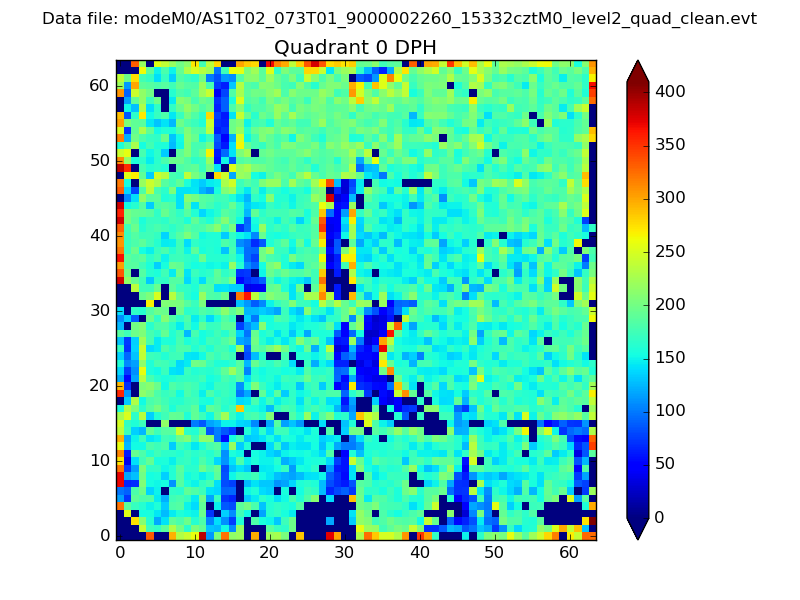 |
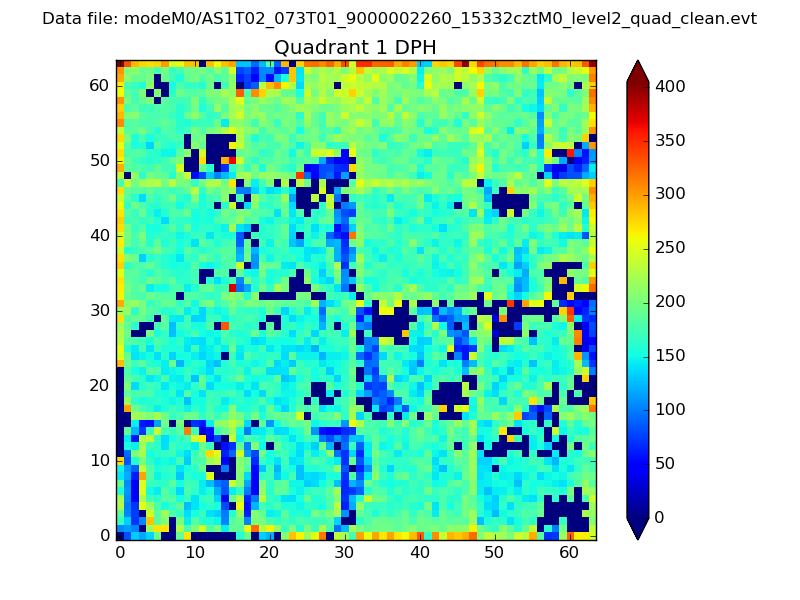 |
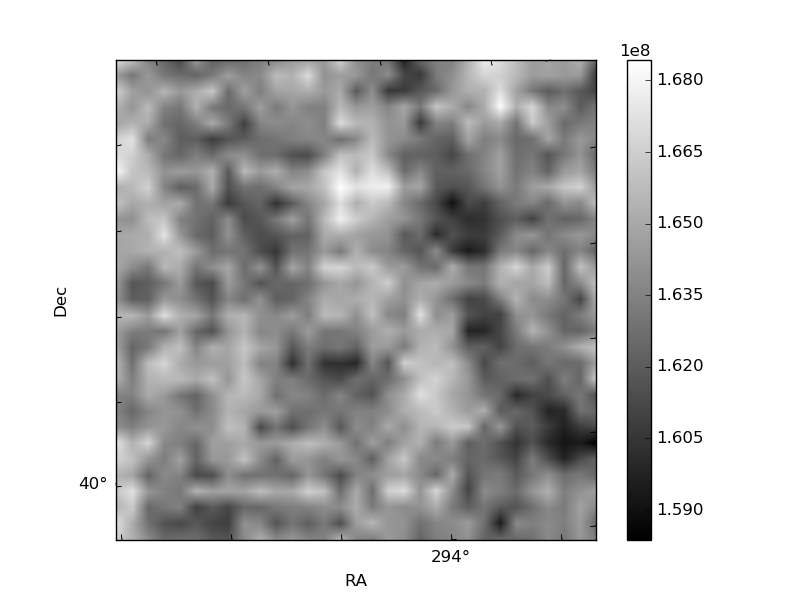
Quadrant B |
|---|---|---|---|
| Quadrant D | 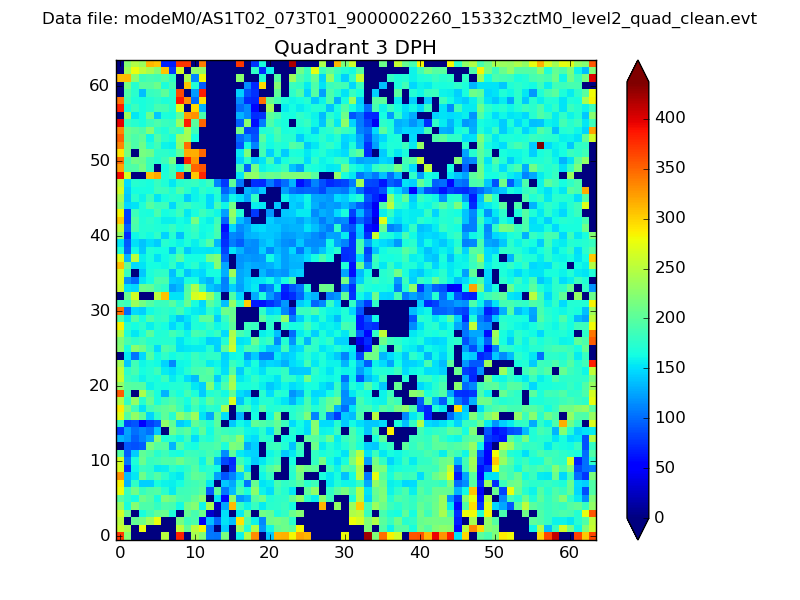 |
 |
Quadrant C |
| Plot type | Count rate plots | Images |
|---|---|---|
| Comparison with Poisson distribution Blue bars denote a histogram of data divided into 1 sec bins. Red curve is a Poisson curve with rate = median count rate of data. |
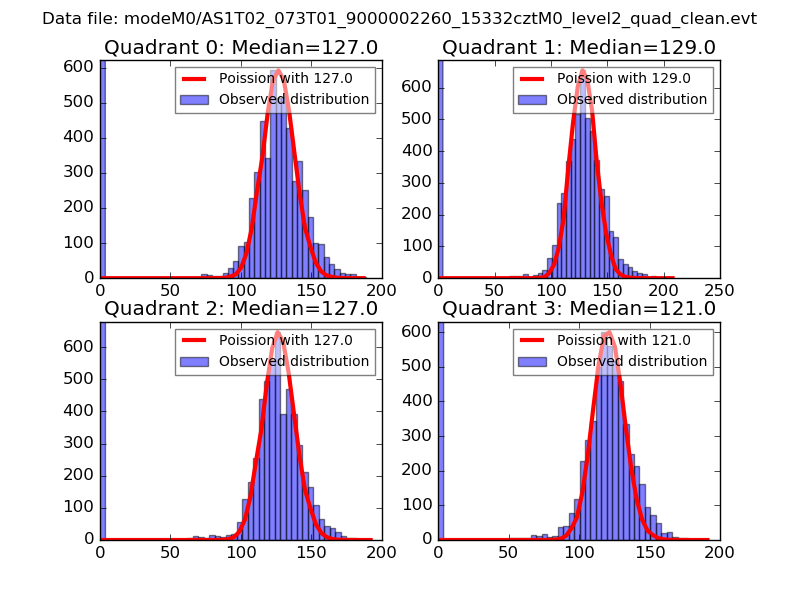 |
 |
| Quadrant-wise count rates Data is divided into 100 sec bins |
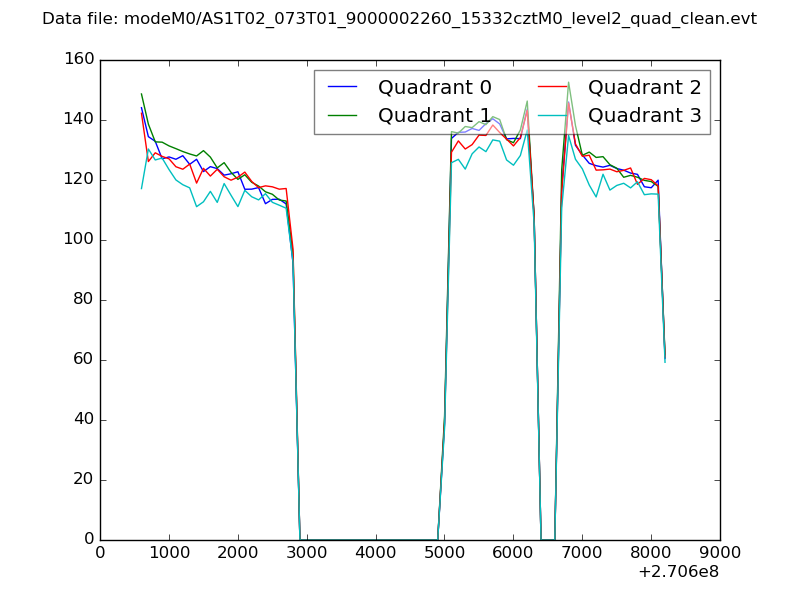 |
|
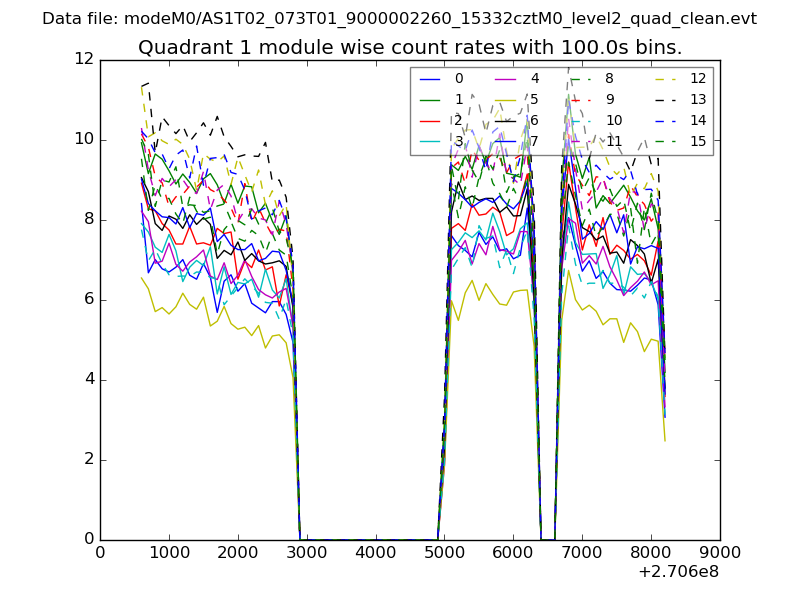
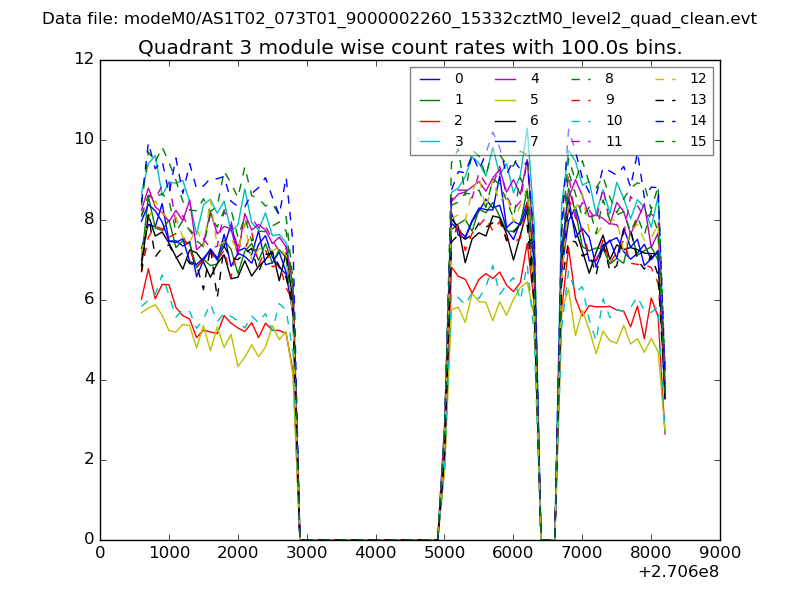
| Module-wise count rates for Quadrant A Data is divided into 100 sec bins |
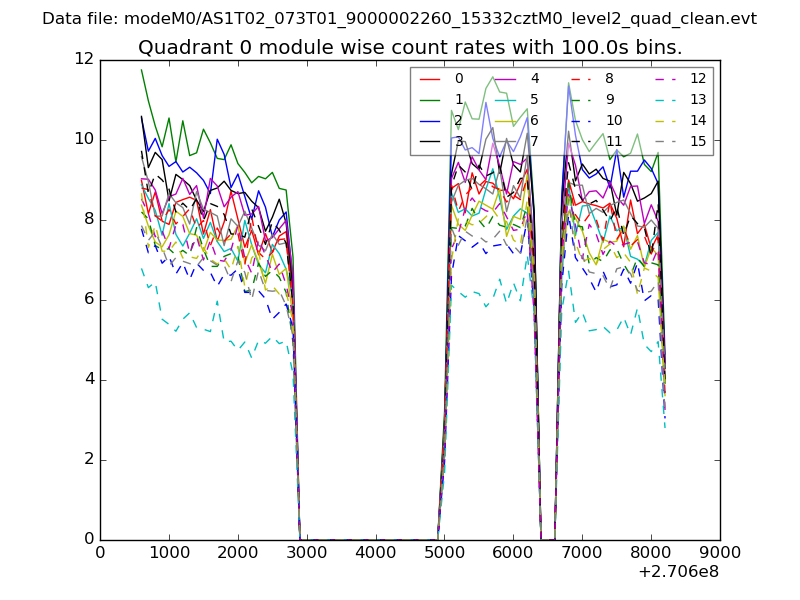 |
 |
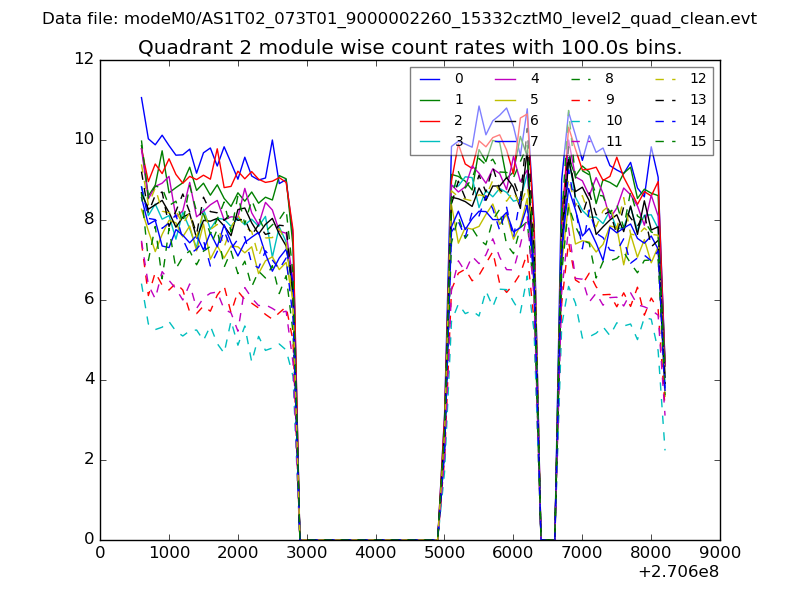
| Module-wise count rates for Quadrant B Data is divided into 100 sec bins |
 |
 |
| Module-wise count rates for Quadrant C Data is divided into 100 sec bins |
 |
 |
| Module-wise count rates for Quadrant D Data is divided into 100 sec bins |
 |
 |
| Parameter | Plot |
|---|---|
| CZT HV Monitor | 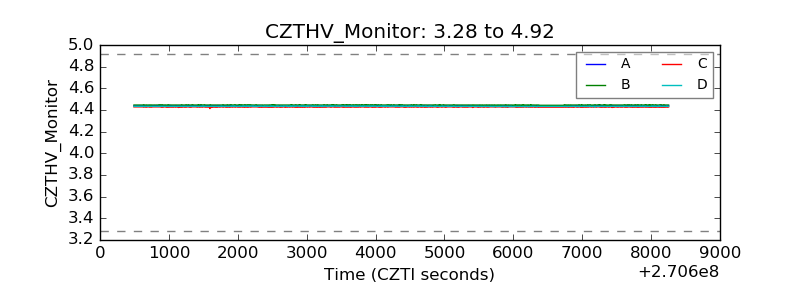 |
| D_VDD | 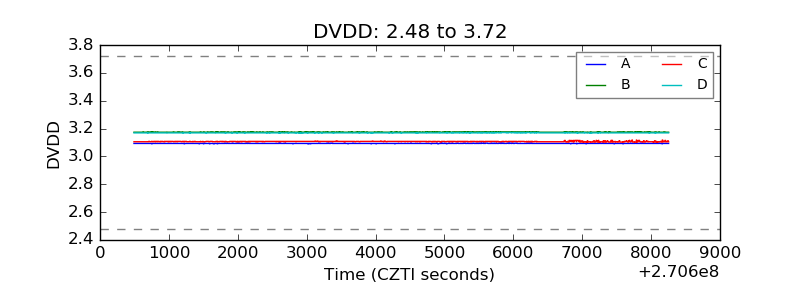 |
| Temperature 1 | 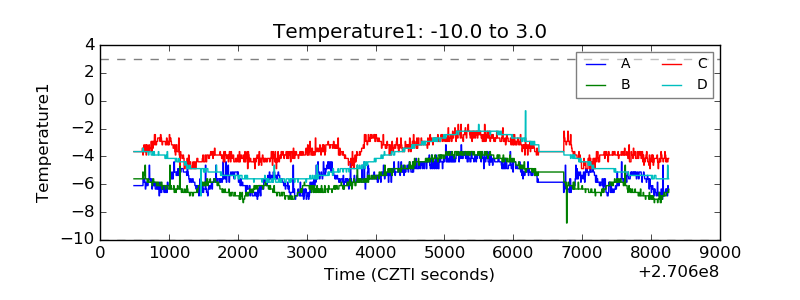 |
| Veto HV Monitor | 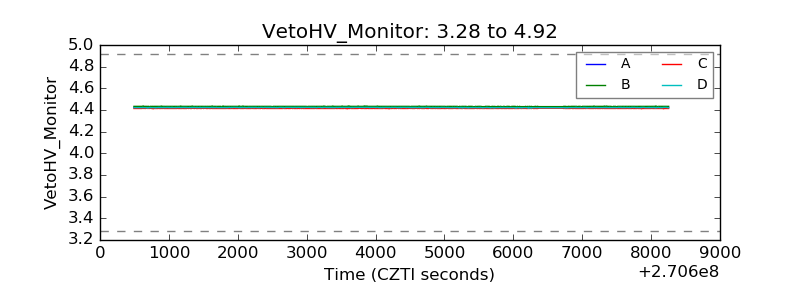 |
| Veto LLD | 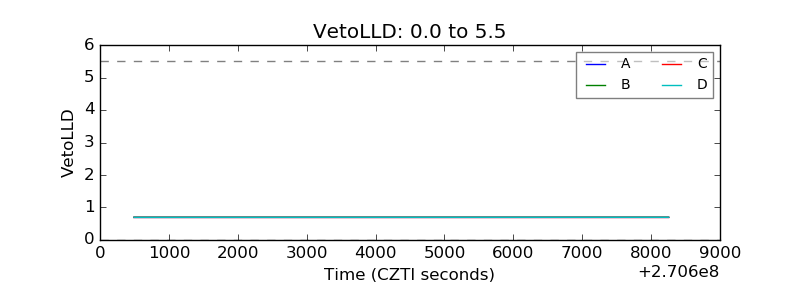 |
| Alpha Counter | 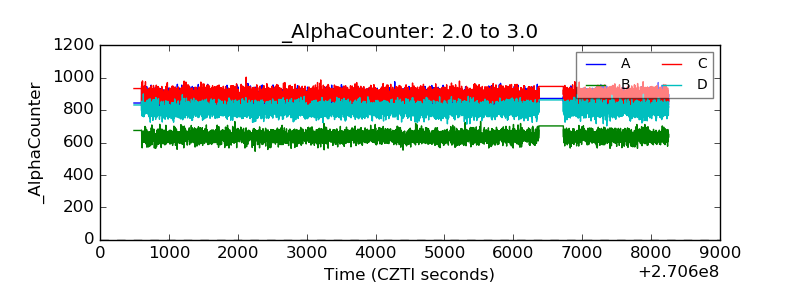 |
| _CPM_Rate | 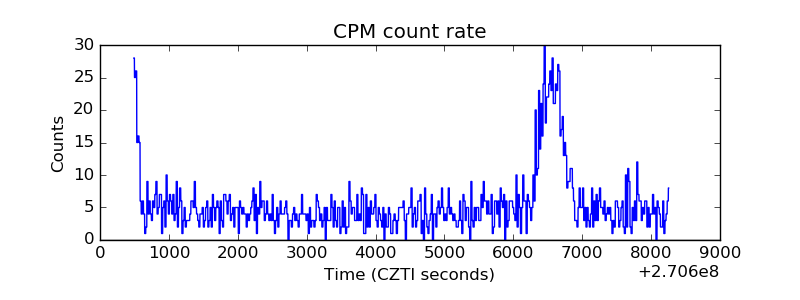 |
| CZT Counter | 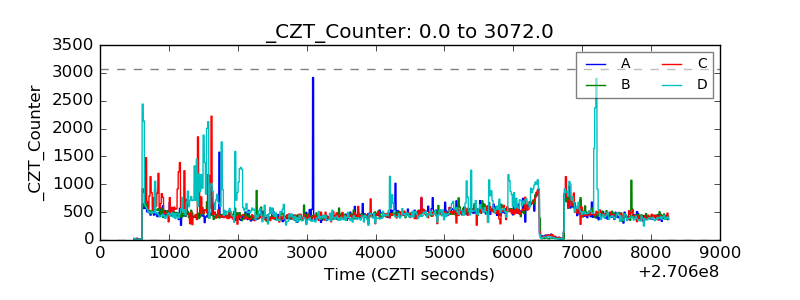 |
| +2.5 Volts monitor |  |
| +5 Volts monitor |  |
| _ROLL_ROT | 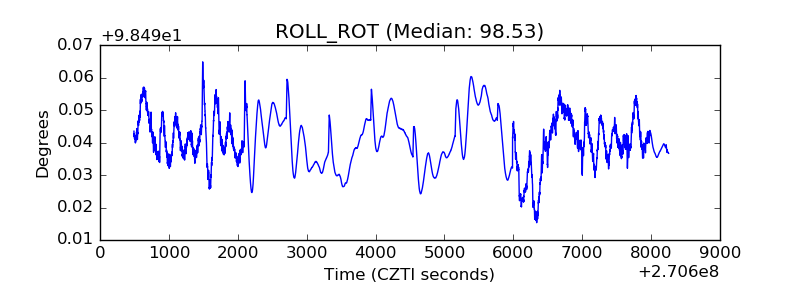 |
| _Roll_DEC | 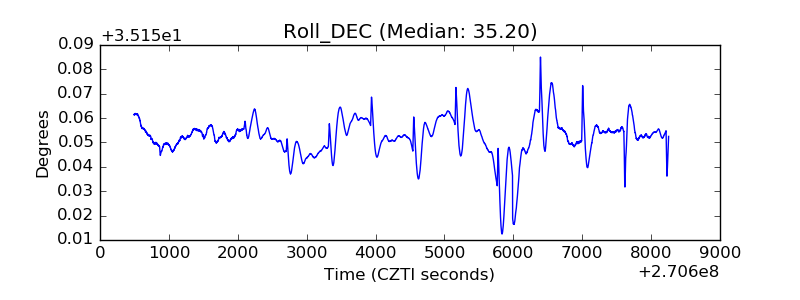 |
| _Roll_RA | 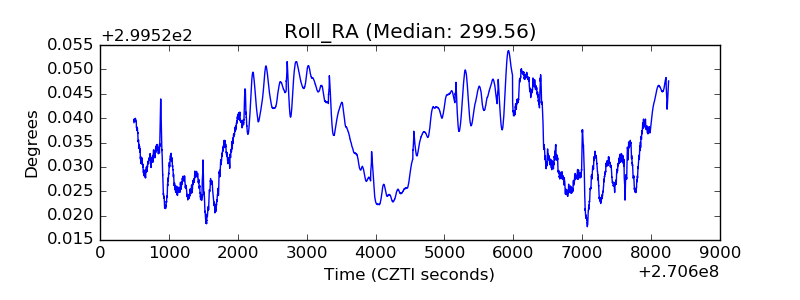 |
| Veto Counter | 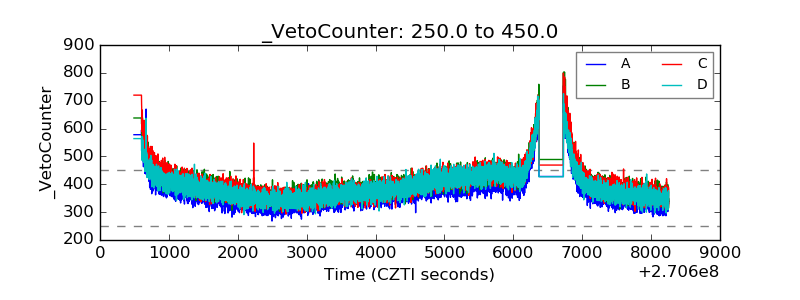 |