| Param | Original file | Final file |
|---|---|---|
| Filename | modeM0/AS1T02_073T01_9000002260_15334cztM0_level2.evt | modeM0/AS1T02_073T01_9000002260_15334cztM0_level2_quad_clean.evt |
| Size (bytes) | 560,998,080 | 81,728,640 |
| Size | 535.0 MB | 77.9 MB |
| Events in quadrant A | 3,030,863 | 508,551 |
| Events in quadrant B | 3,211,988 | 516,401 |
| Events in quadrant C | 3,065,818 | 511,916 |
| Events in quadrant D | 7,228,337 | 472,260 |
| Mode SS | |||
|---|---|---|---|
| Quadrant | BADHDUFLAG | Total packets | Discarded packets |
| A | 0 | 134 | 0 |
| B | 0 | 134 | 0 |
| C | 0 | 134 | 0 |
| D | 0 | 134 | 0 |
| Mode M0 | |||
|---|---|---|---|
| Quadrant | BADHDUFLAG | Total packets | Discarded packets |
| A | 0 | 13605 | 2 |
| B | 0 | 14044 | 1 |
| C | 0 | 13622 | 1 |
| D | 0 | 26328 | 1 |
| Mode M9 | |||
|---|---|---|---|
| Quadrant | BADHDUFLAG | Total packets | Discarded packets |
| A | 0 | 4 | 0 |
| B | 0 | 4 | 0 |
| C | 0 | 4 | 0 |
| D | 0 | 4 | 0 |
| Quadrant | Total seconds | Saturated seconds | Saturation percentage |
|---|---|---|---|
| A | 6681 | 89 | 1.332136% |
| B | 6681 | 133 | 1.990720% |
| C | 6681 | 50 | 0.748391% |
| D | 6681 | 1090 | 16.314923% |
Noise dominated data is calculated using 1-second bins in cleaned event files. If a bin has >2000 counts, and if more than 50% of those come from <1% of pixels, then it is considered to be noise-dominated and hence unusable.
| Quadrant | # 1 sec bins | Bins with >0 counts | Bins with >2000 counts | High rate bins dominated by noise | Noise dominated (total time) | Noise dominated (detector-on time) | Marked lightcurve |
|---|---|---|---|---|---|---|---|
| A | 7057 | 6683 | 0 | 0 | 0.00% | 0.00% | 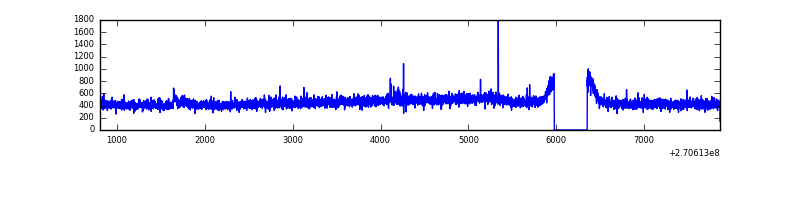 |
| B | 7057 | 6682 | 17 | 17 | 0.24% | 0.25% | 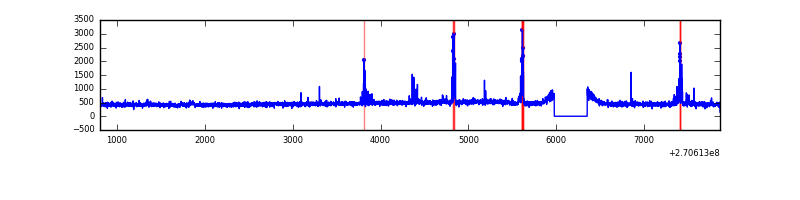 |
| C | 7057 | 6683 | 0 | 0 | 0.00% | 0.00% | 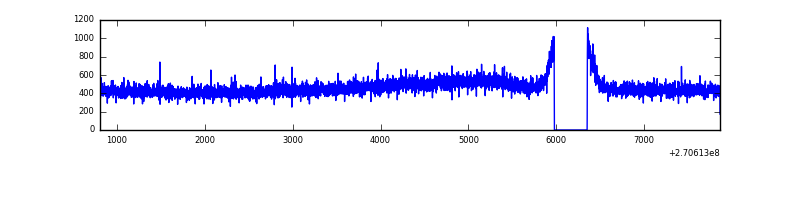 |
| D | 7057 | 6683 | 1285 | 1285 | 18.21% | 19.23% | 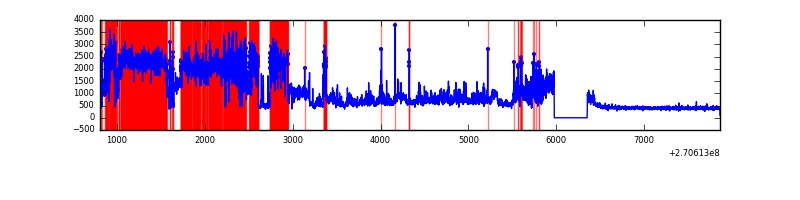 |
Top three noisy pixels from each quadrant. If the there are fewer than three noisy pixels in the level2.evt file, extra rows are filled as -1
| Pixel properties | Quadrant properties | ||||||
|---|---|---|---|---|---|---|---|
| Quadrant | DetID | PixID | Counts | Sigma | Mean | Median | Sigma |
| A | 15 | 239 | 16779 | 100.66 | 780 | 761 | 159.1 |
| A | 9 | 143 | 9471 | 54.73 | 780 | 761 | 159.1 |
| A | 0 | 226 | 6633 | 36.9 | 780 | 761 | 159.1 |
| B | 10 | 16 | 115709 | 757.19 | 780 | 759 | 151.8 |
| B | 8 | 3 | 20681 | 131.23 | 780 | 759 | 151.8 |
| B | 12 | 111 | 18753 | 118.53 | 780 | 759 | 151.8 |
| C | 3 | 233 | 83723 | 464.65 | 764 | 768 | 178.5 |
| C | 13 | 61 | 5398 | 25.93 | 764 | 768 | 178.5 |
| C | 8 | 222 | 2899 | 11.94 | 764 | 768 | 178.5 |
| D | 13 | 122 | 4414333 | 24639.11 | 733 | 710 | 179.1 |
| D | 2 | 33 | 30538 | 166.52 | 733 | 710 | 179.1 |
| D | 2 | 234 | 20556 | 110.79 | 733 | 710 | 179.1 |
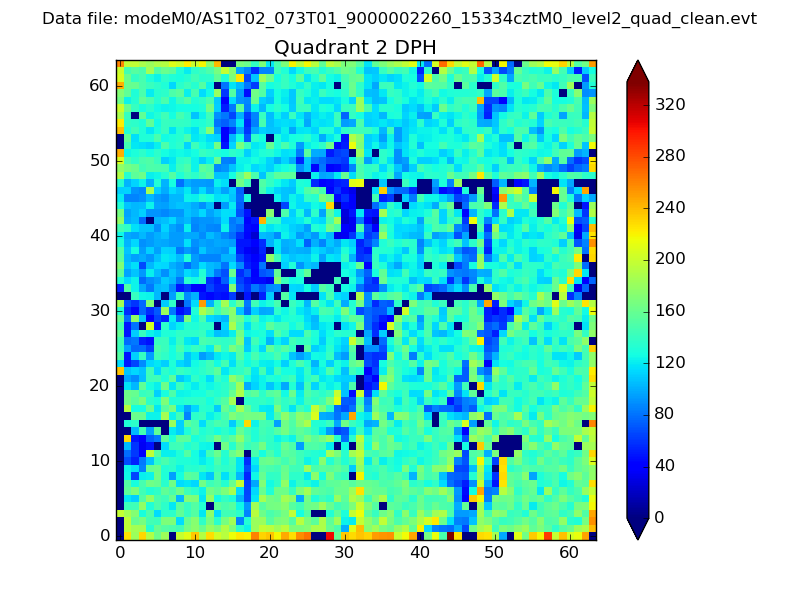
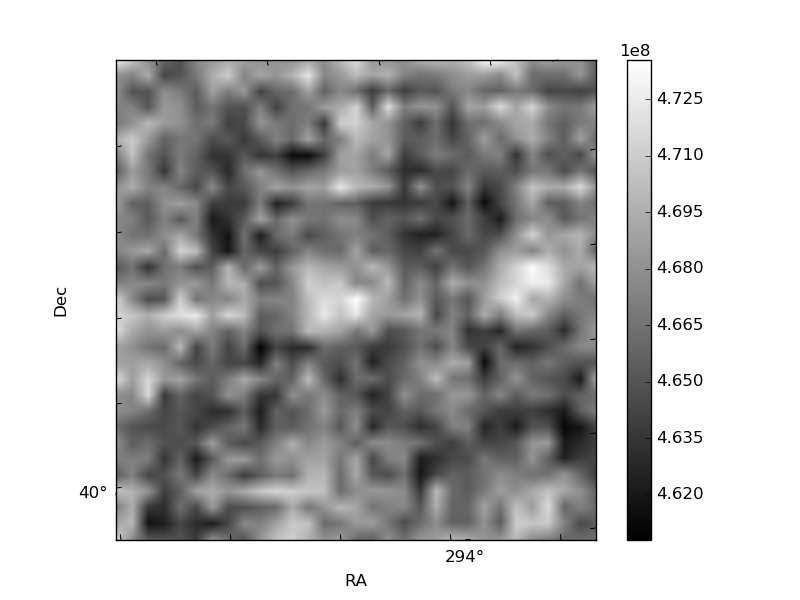
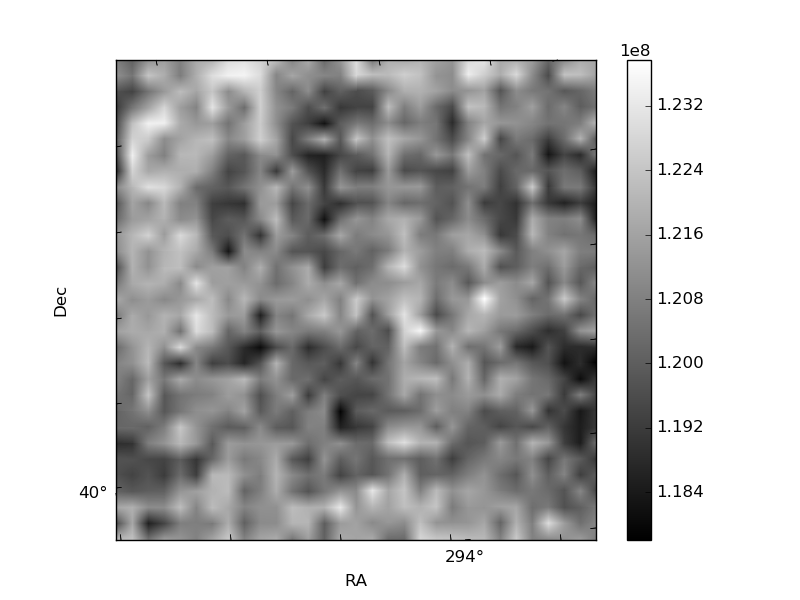
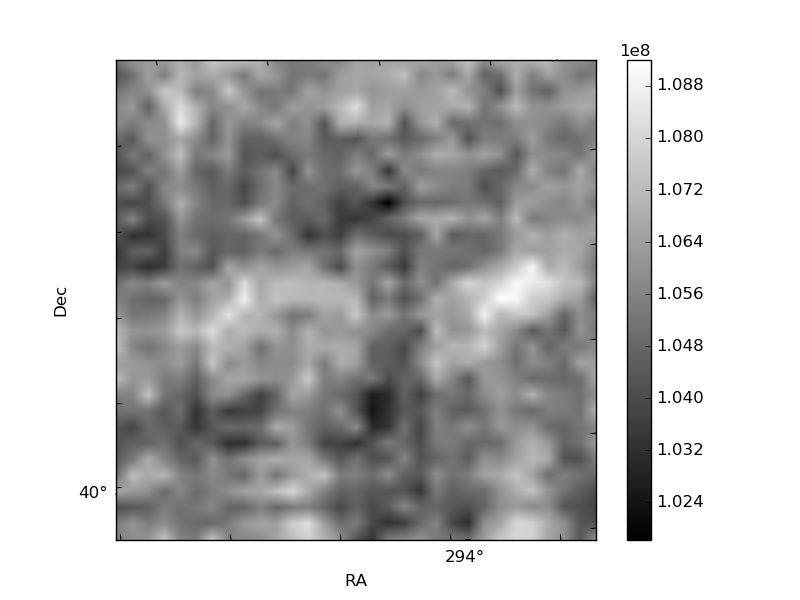
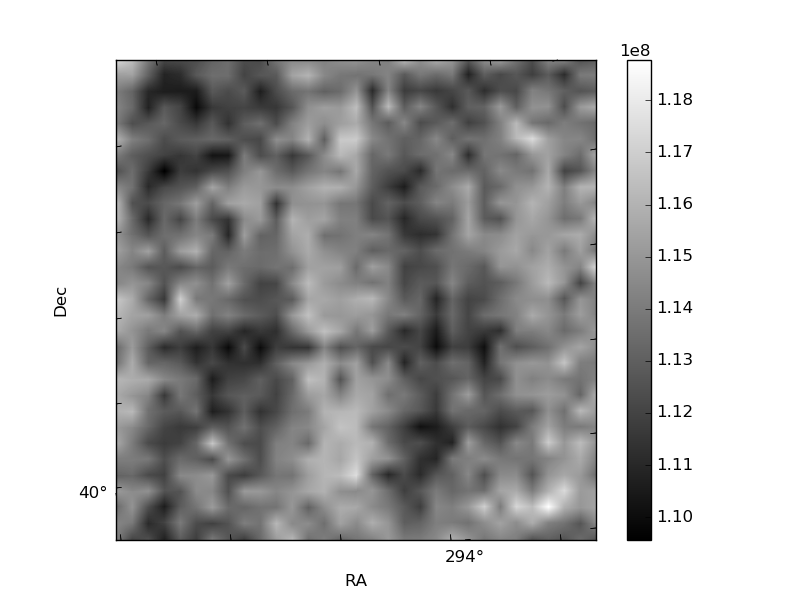
Histogram calculated using DETX and DETY for each event in the final _common_clean file
| Quadrant A | 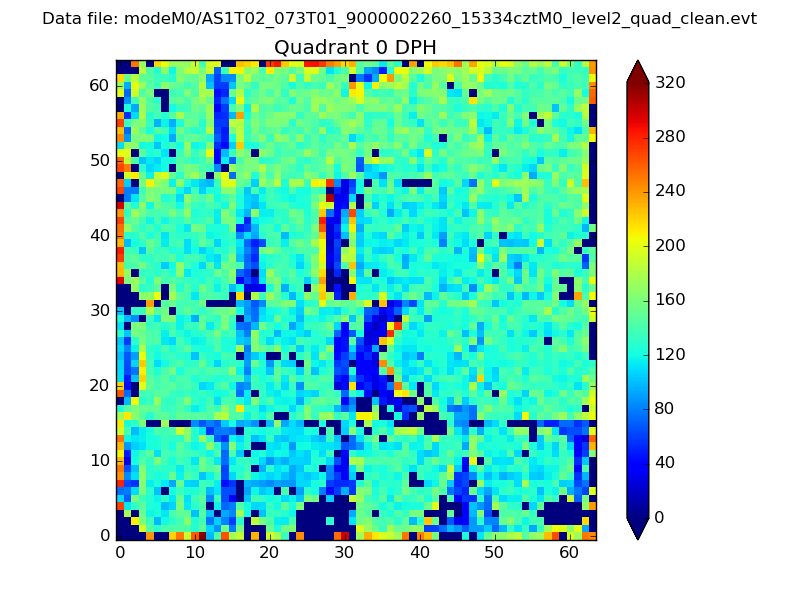 |
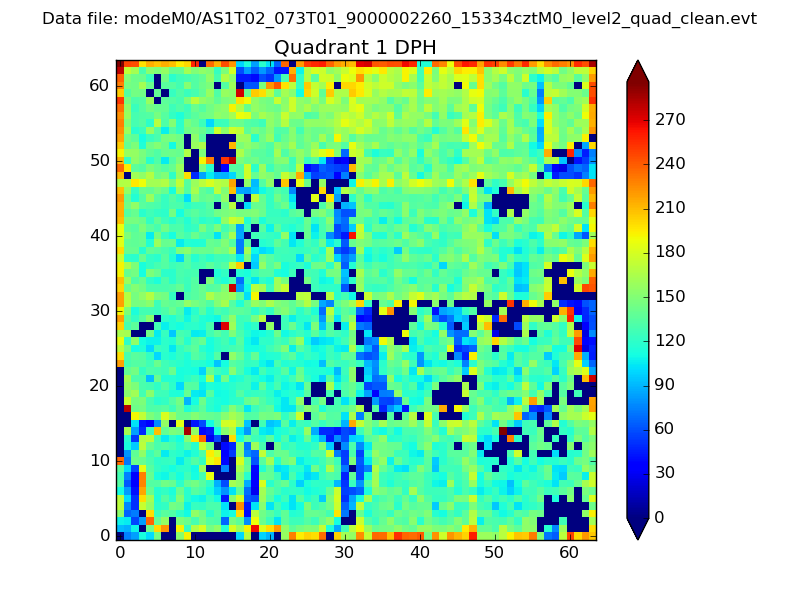 |
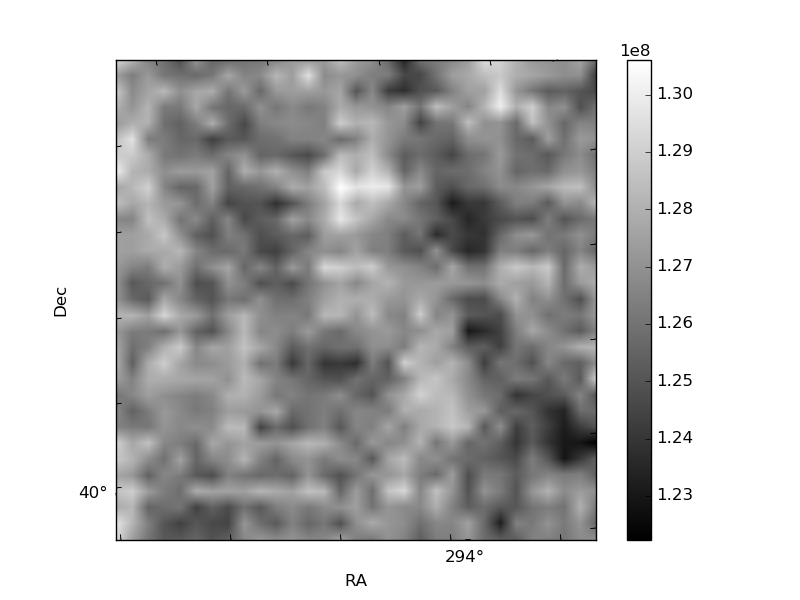
Quadrant B |
|---|---|---|---|
| Quadrant D | 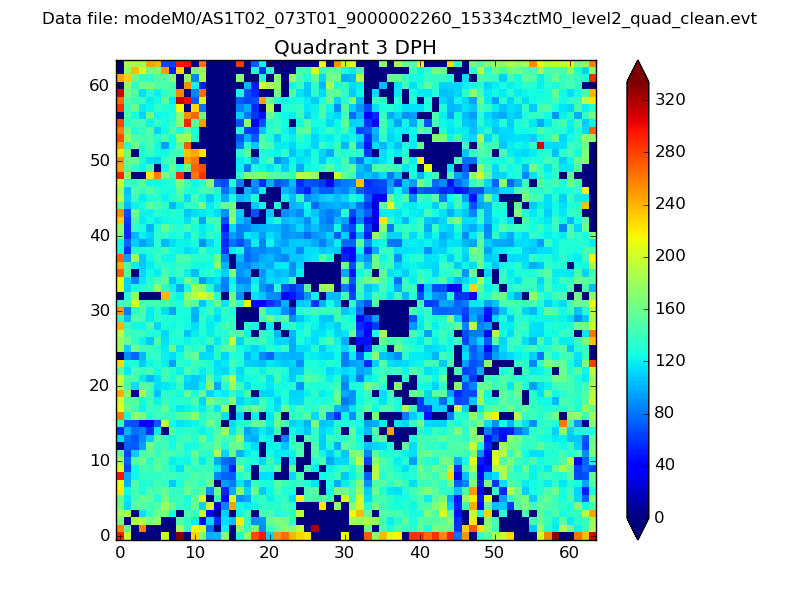 |
 |
Quadrant C |
| Plot type | Count rate plots | Images |
|---|---|---|
| Comparison with Poisson distribution Blue bars denote a histogram of data divided into 1 sec bins. Red curve is a Poisson curve with rate = median count rate of data. |
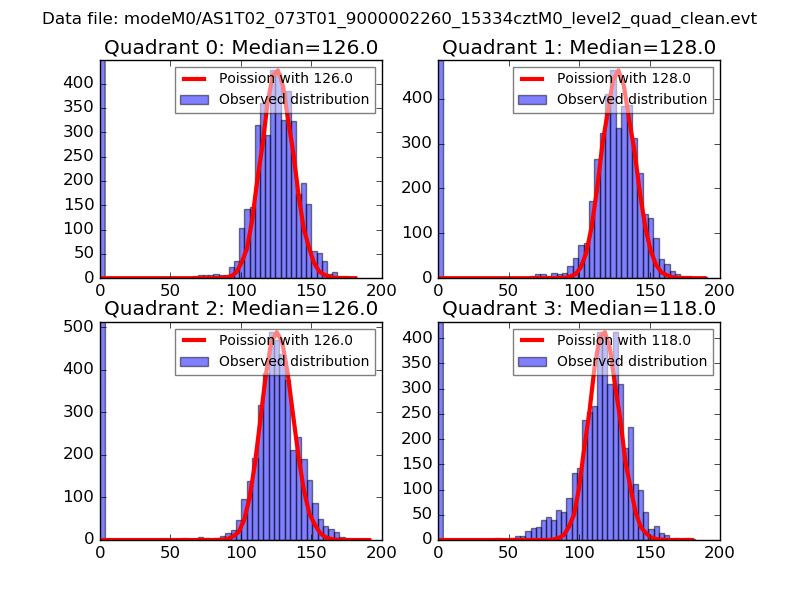 |
 |
| Quadrant-wise count rates Data is divided into 100 sec bins |
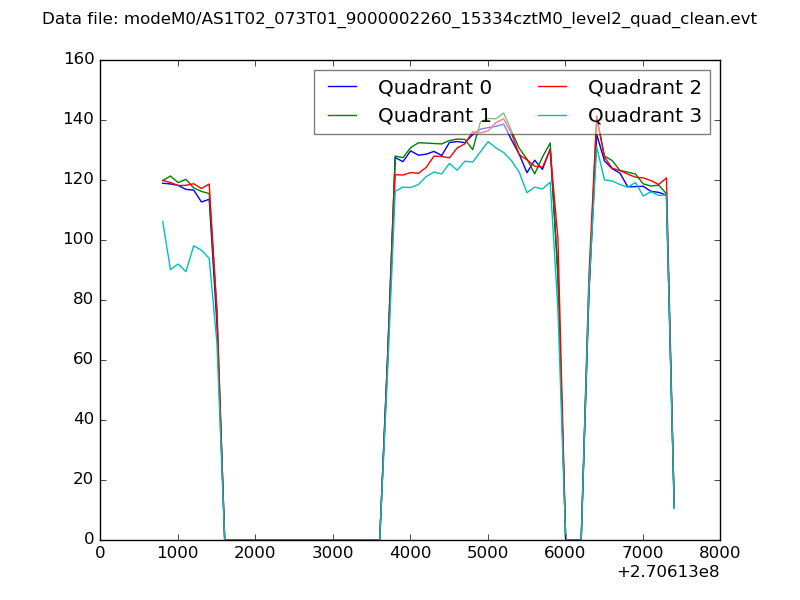 |
|
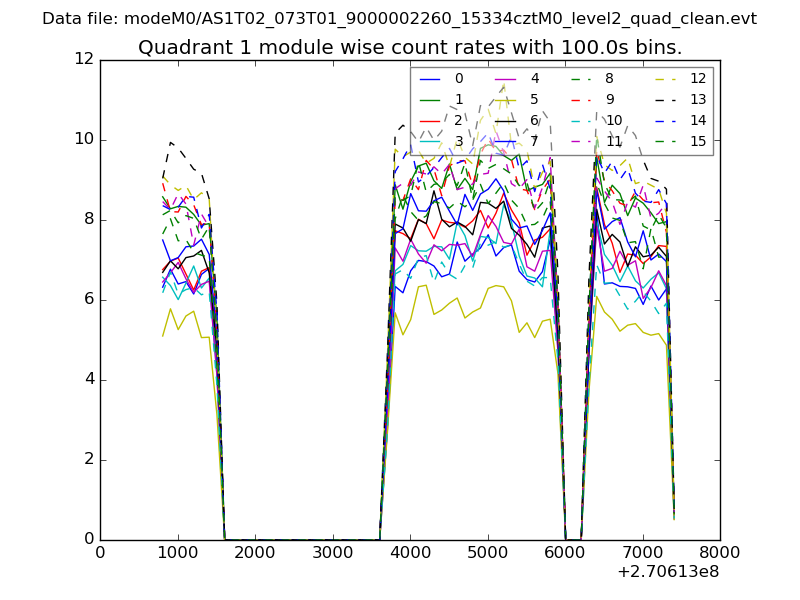
| Module-wise count rates for Quadrant A Data is divided into 100 sec bins |
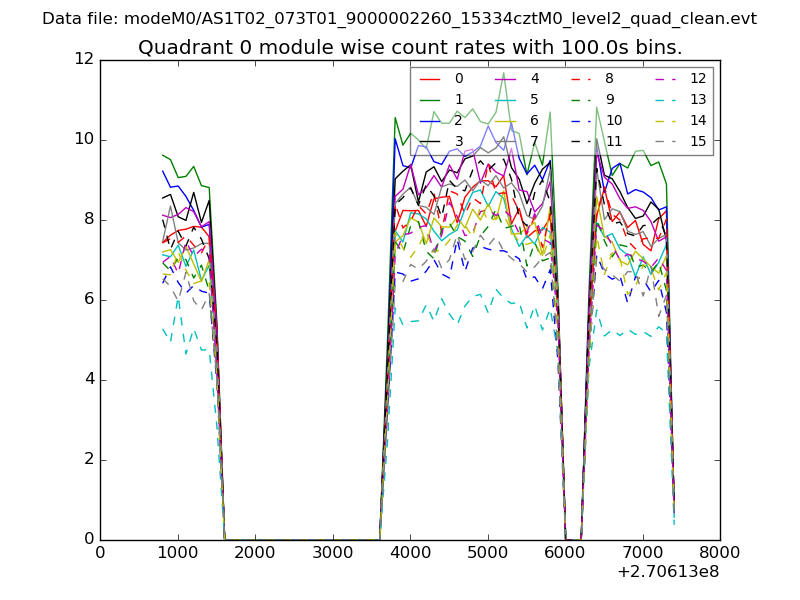 |
 |
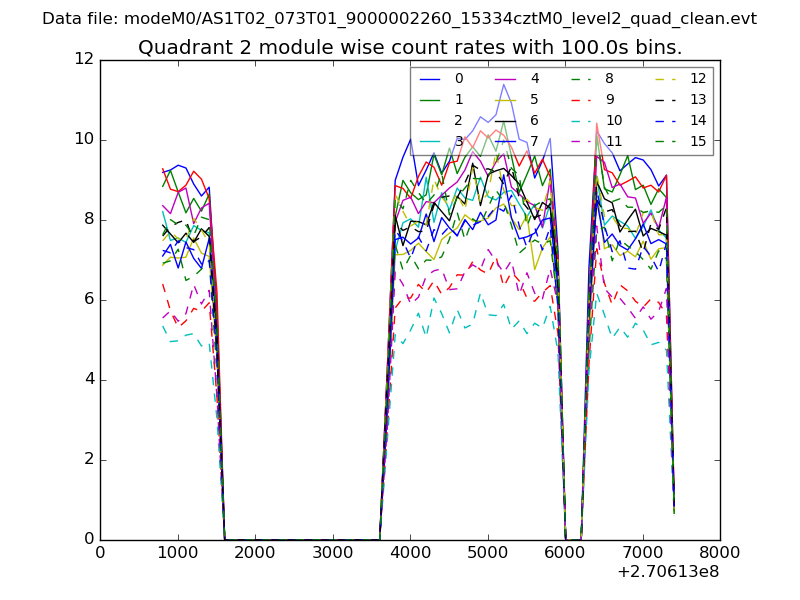
| Module-wise count rates for Quadrant B Data is divided into 100 sec bins |
 |
 |
| Module-wise count rates for Quadrant C Data is divided into 100 sec bins |
 |
 |
| Module-wise count rates for Quadrant D Data is divided into 100 sec bins |
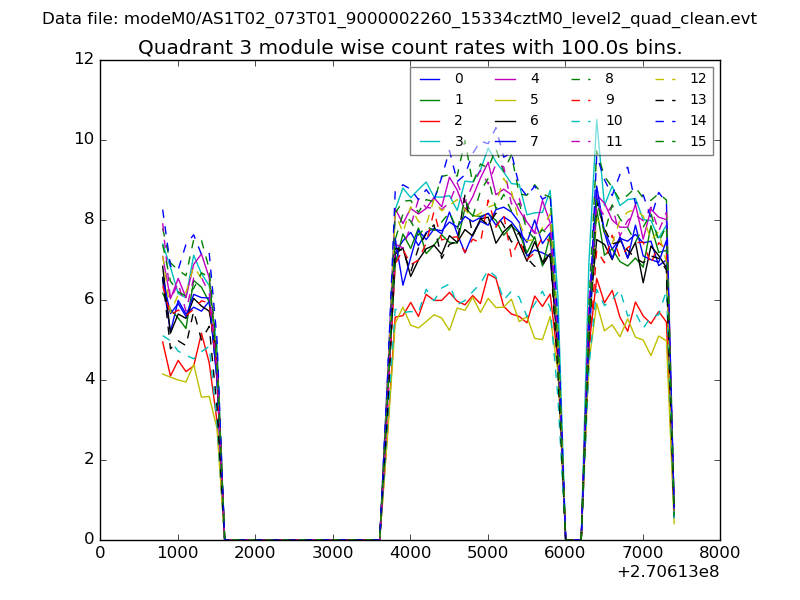 |
 |
| Parameter | Plot |
|---|---|
| CZT HV Monitor | 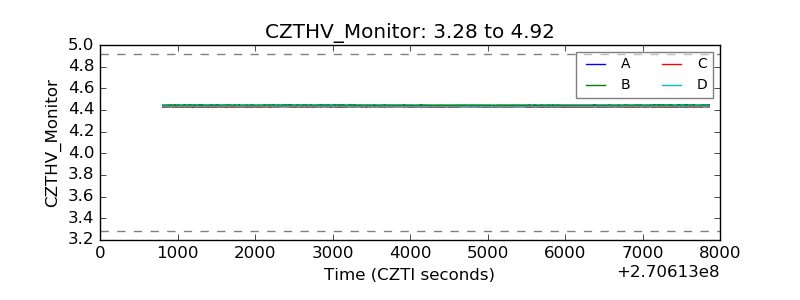 |
| D_VDD | 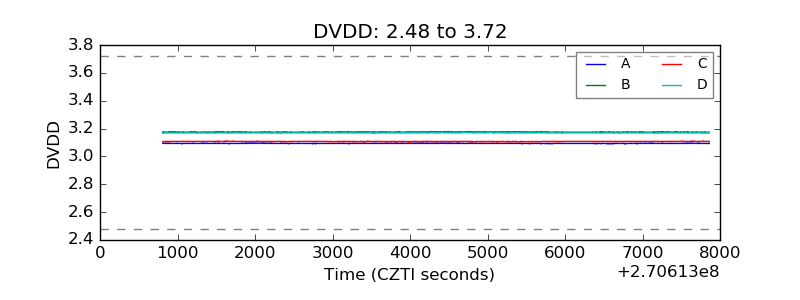 |
| Temperature 1 | 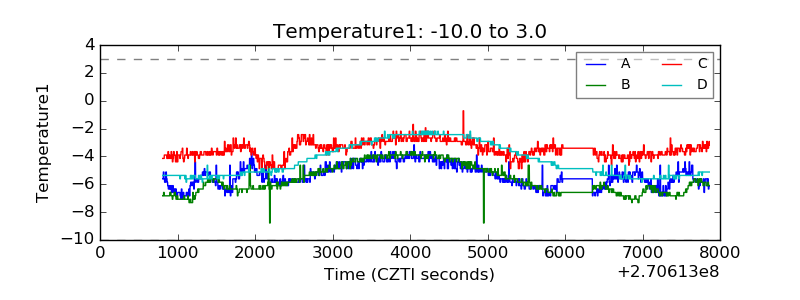 |
| Veto HV Monitor | 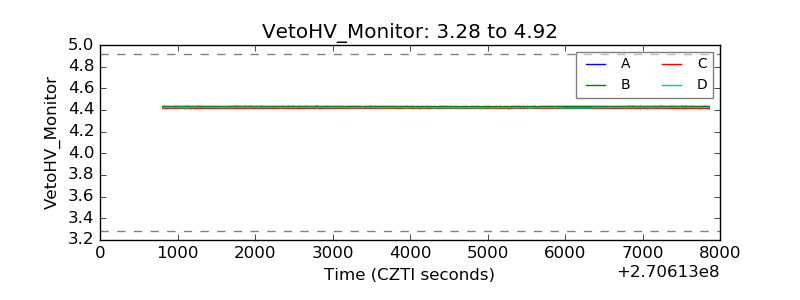 |
| Veto LLD | 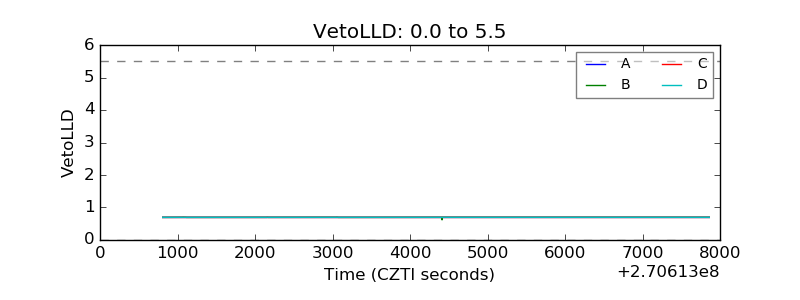 |
| Alpha Counter | 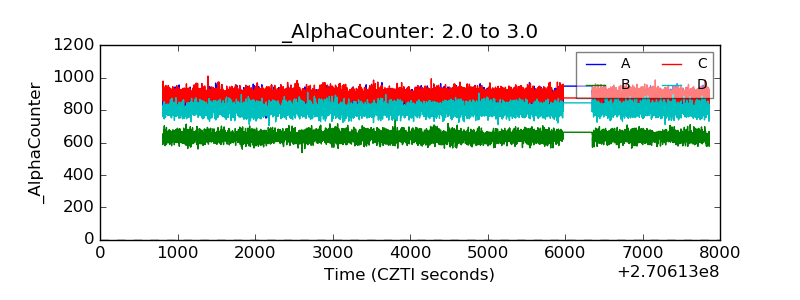 |
| _CPM_Rate | 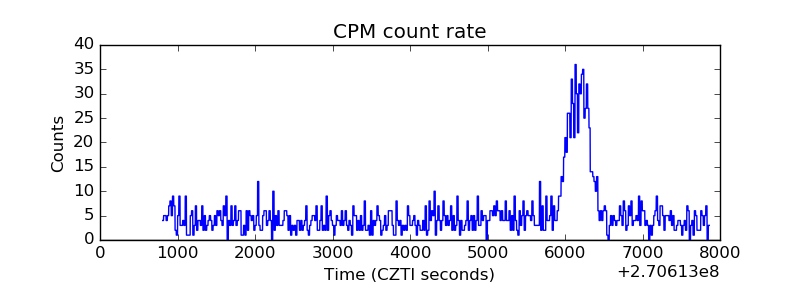 |
| CZT Counter | 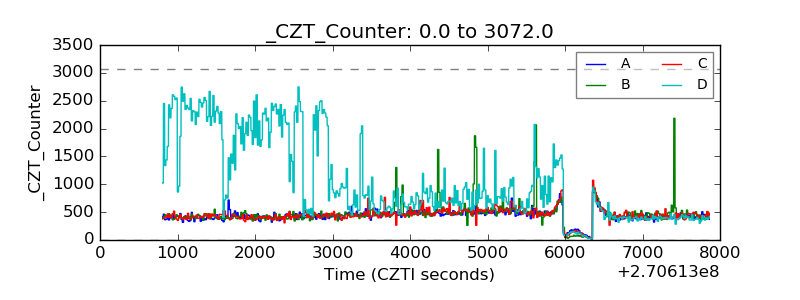 |
| +2.5 Volts monitor |  |
| +5 Volts monitor |  |
| _ROLL_ROT | 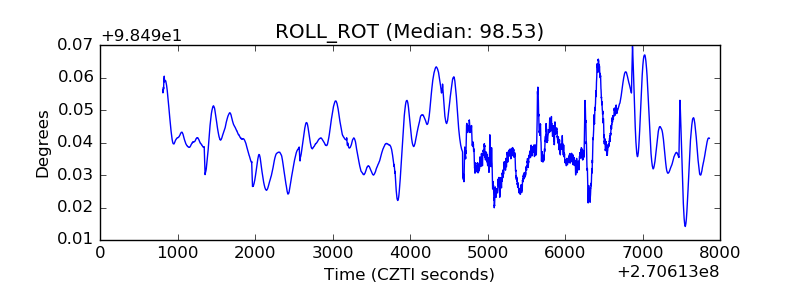 |
| _Roll_DEC | 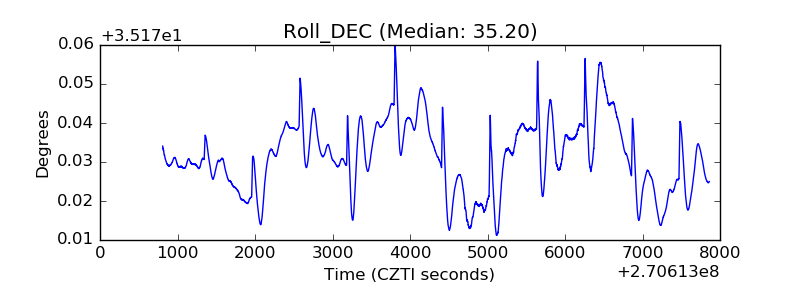 |
| _Roll_RA | 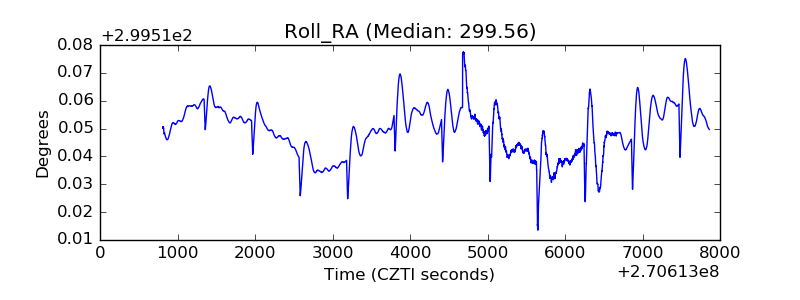 |
| Veto Counter | 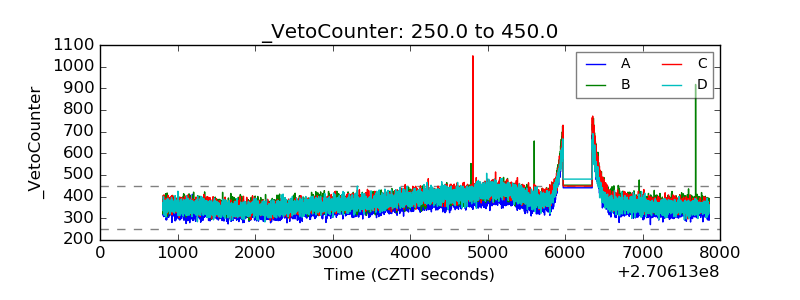 |