| Param | Original file | Final file |
|---|---|---|
| Filename | modeM0/AS1T02_073T01_9000002260_15336cztM0_level2.evt | modeM0/AS1T02_073T01_9000002260_15336cztM0_level2_quad_clean.evt |
| Size (bytes) | 969,261,120 | 157,464,000 |
| Size | 924.4 MB | 150.2 MB |
| Events in quadrant A | 6,194,598 | 981,906 |
| Events in quadrant B | 6,919,886 | 991,614 |
| Events in quadrant C | 6,767,016 | 981,239 |
| Events in quadrant D | 8,561,380 | 883,305 |
| Mode SS | |||
|---|---|---|---|
| Quadrant | BADHDUFLAG | Total packets | Discarded packets |
| A | 0 | 276 | 0 |
| B | 0 | 276 | 0 |
| C | 0 | 276 | 0 |
| D | 0 | 276 | 0 |
| Mode M0 | |||
|---|---|---|---|
| Quadrant | BADHDUFLAG | Total packets | Discarded packets |
| A | 0 | 27485 | 4 |
| B | 0 | 29289 | 3 |
| C | 0 | 28417 | 3 |
| D | 0 | 35309 | 3 |
| Mode M9 | |||
|---|---|---|---|
| Quadrant | BADHDUFLAG | Total packets | Discarded packets |
| A | 0 | 16 | 0 |
| B | 0 | 16 | 0 |
| C | 0 | 16 | 0 |
| D | 0 | 16 | 0 |
| Quadrant | Total seconds | Saturated seconds | Saturation percentage |
|---|---|---|---|
| A | 13460 | 211 | 1.567608% |
| B | 13460 | 356 | 2.644874% |
| C | 13460 | 128 | 0.950966% |
| D | 13460 | 950 | 7.057949% |
Noise dominated data is calculated using 1-second bins in cleaned event files. If a bin has >2000 counts, and if more than 50% of those come from <1% of pixels, then it is considered to be noise-dominated and hence unusable.
| Quadrant | # 1 sec bins | Bins with >0 counts | Bins with >2000 counts | High rate bins dominated by noise | Noise dominated (total time) | Noise dominated (detector-on time) | Marked lightcurve |
|---|---|---|---|---|---|---|---|
| A | 15106 | 13463 | 0 | 0 | 0.00% | 0.00% | 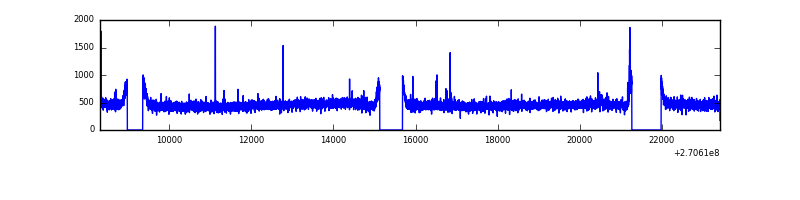 |
| B | 15106 | 13461 | 70 | 70 | 0.46% | 0.52% | 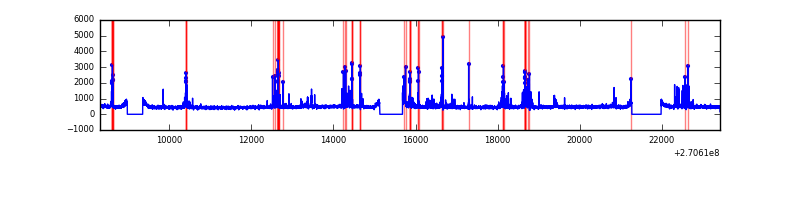 |
| C | 15106 | 13463 | 1 | 1 | 0.01% | 0.01% | 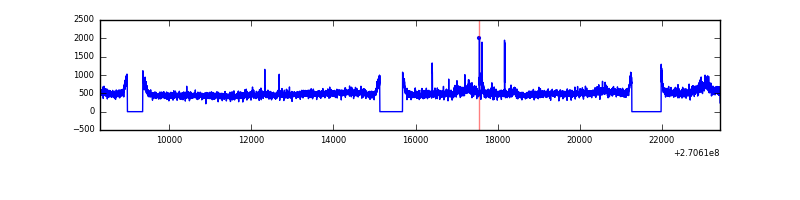 |
| D | 15106 | 13462 | 705 | 705 | 4.67% | 5.24% | 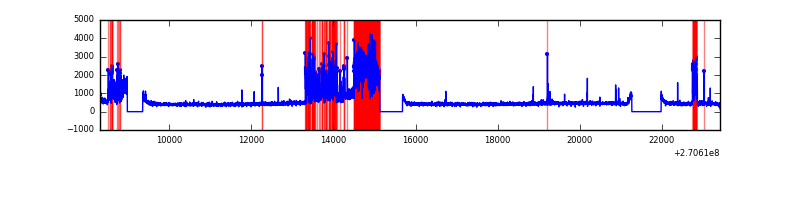 |
Top three noisy pixels from each quadrant. If the there are fewer than three noisy pixels in the level2.evt file, extra rows are filled as -1
| Pixel properties | Quadrant properties | ||||||
|---|---|---|---|---|---|---|---|
| Quadrant | DetID | PixID | Counts | Sigma | Mean | Median | Sigma |
| A | 9 | 143 | 22037 | 63.62 | 1600 | 1562 | 321.8 |
| A | 0 | 226 | 13850 | 38.18 | 1600 | 1562 | 321.8 |
| A | 4 | 2 | 13006 | 35.56 | 1600 | 1562 | 321.8 |
| B | 10 | 16 | 639588 | 2060.77 | 1596 | 1553 | 309.6 |
| B | 12 | 111 | 38307 | 118.71 | 1596 | 1553 | 309.6 |
| B | 11 | 111 | 33451 | 103.03 | 1596 | 1553 | 309.6 |
| C | 3 | 233 | 657720 | 1804.13 | 1564 | 1574 | 363.7 |
| C | 13 | 61 | 11048 | 26.05 | 1564 | 1574 | 363.7 |
| C | 15 | 127 | 8176 | 18.15 | 1564 | 1574 | 363.7 |
| D | 13 | 122 | 2620855 | 7144.1 | 1508 | 1465 | 366.7 |
| D | 2 | 14 | 165382 | 447.06 | 1508 | 1465 | 366.7 |
| D | 2 | 234 | 42244 | 111.22 | 1508 | 1465 | 366.7 |
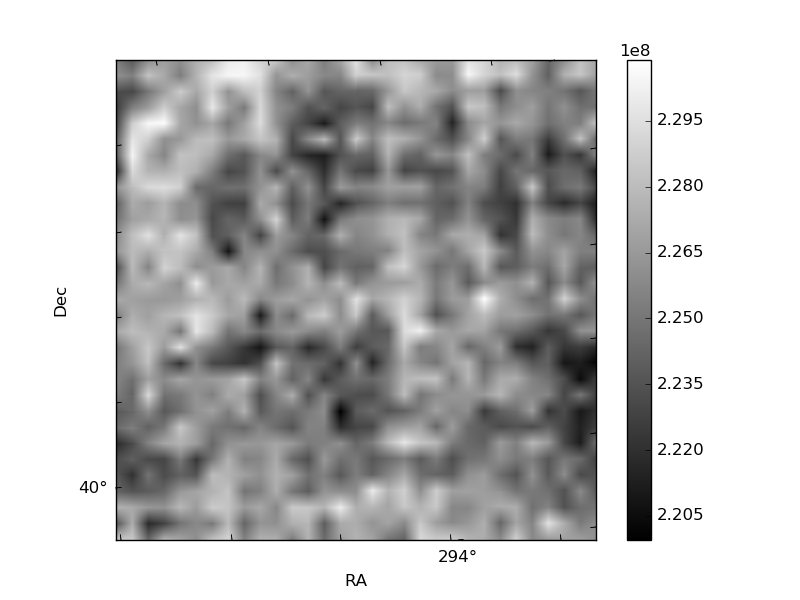
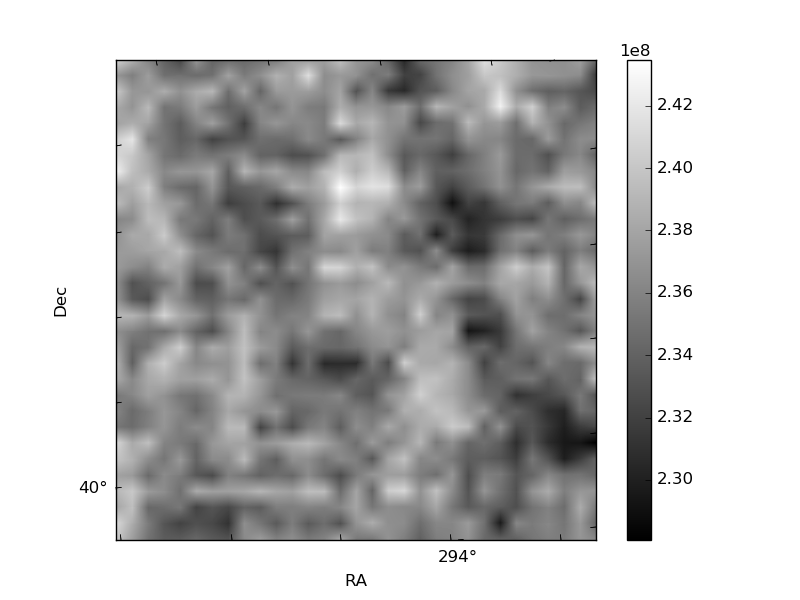
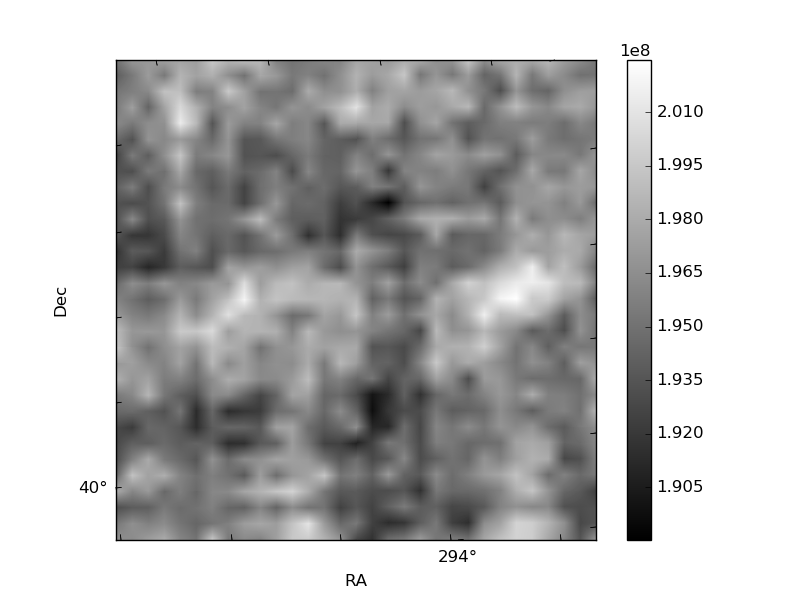
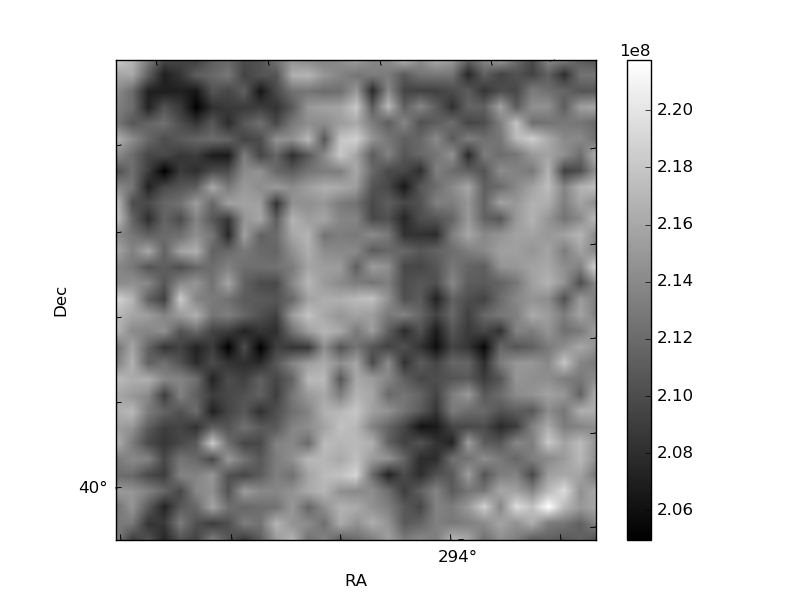
Histogram calculated using DETX and DETY for each event in the final _common_clean file
| Quadrant A | 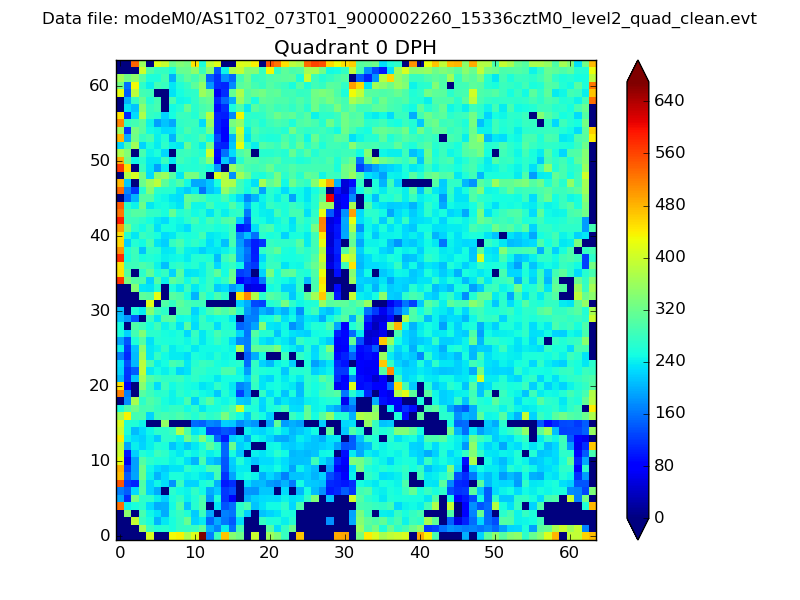 |
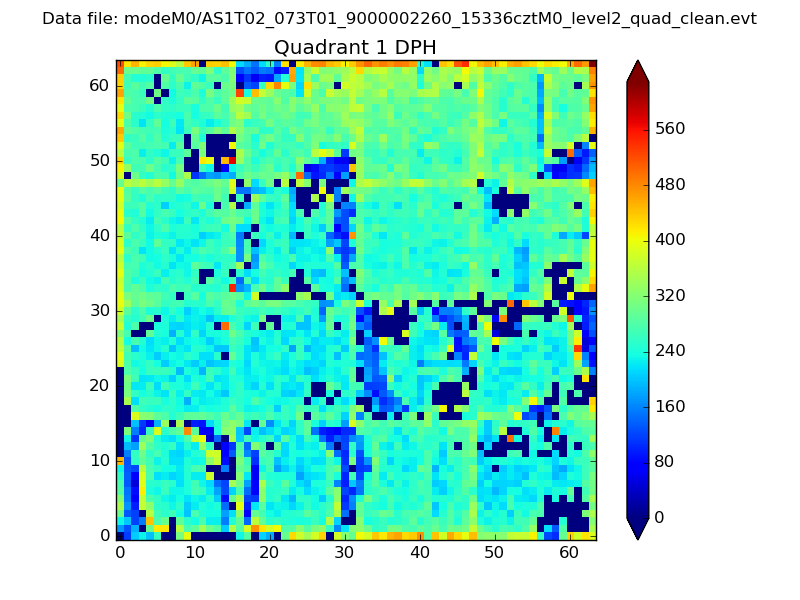 |
Quadrant B |
|---|---|---|---|
| Quadrant D | 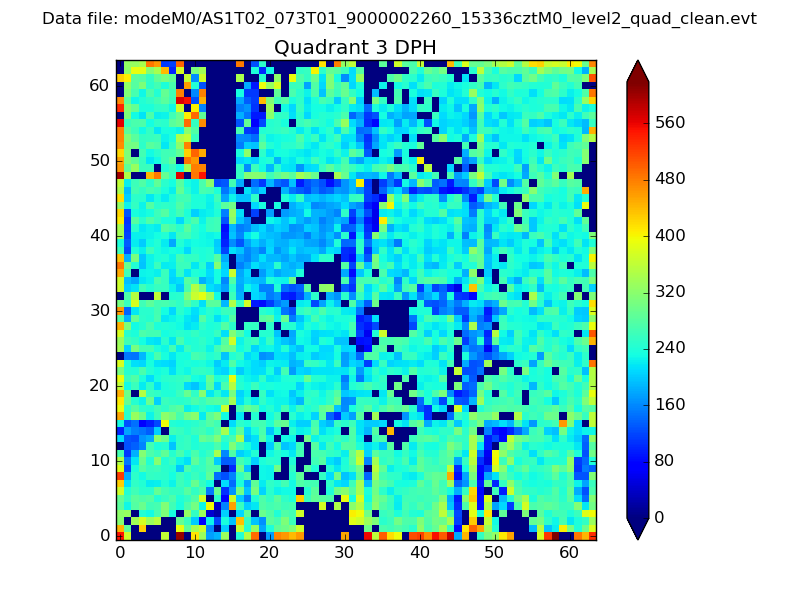 |
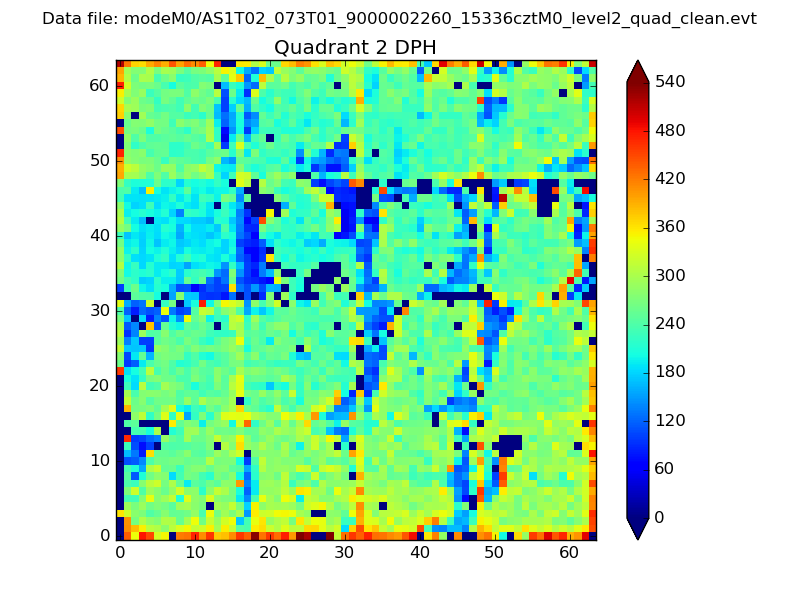 |
Quadrant C |
| Plot type | Count rate plots | Images |
|---|---|---|
| Comparison with Poisson distribution Blue bars denote a histogram of data divided into 1 sec bins. Red curve is a Poisson curve with rate = median count rate of data. |
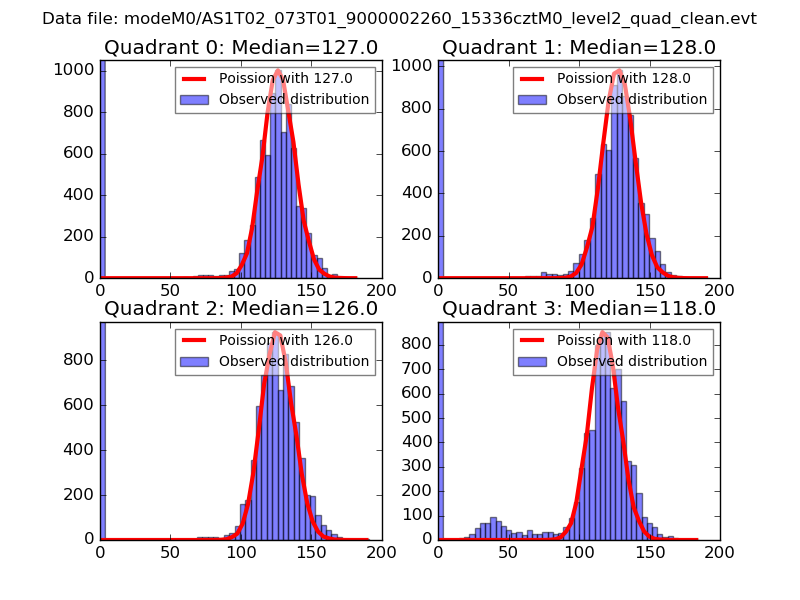 |
 |
| Quadrant-wise count rates Data is divided into 100 sec bins |
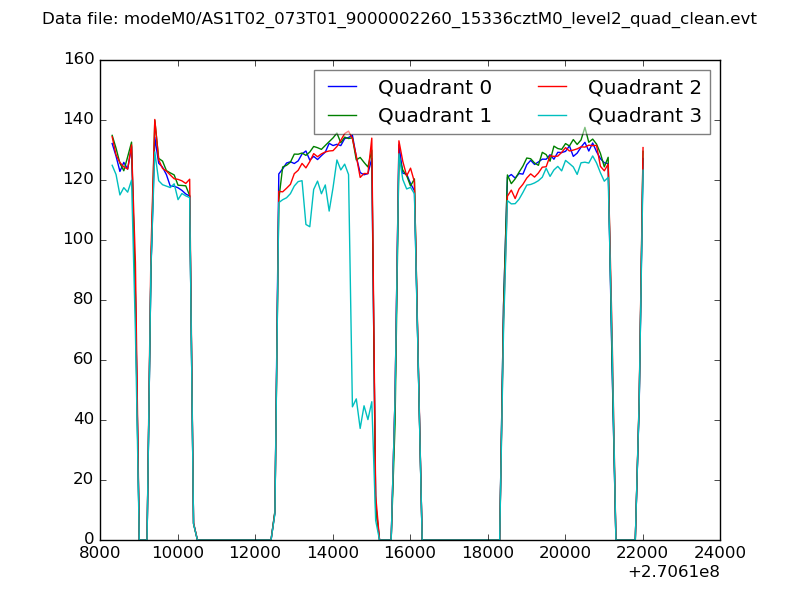 |
|
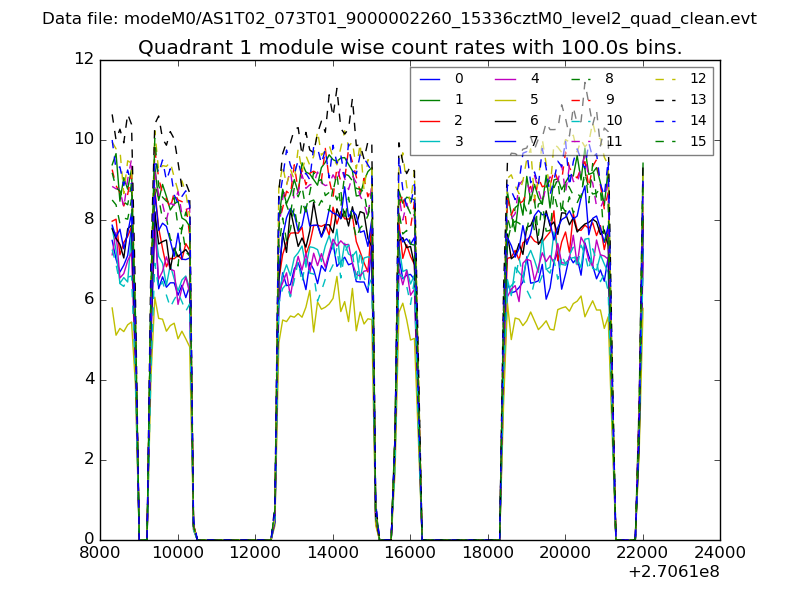
| Module-wise count rates for Quadrant A Data is divided into 100 sec bins |
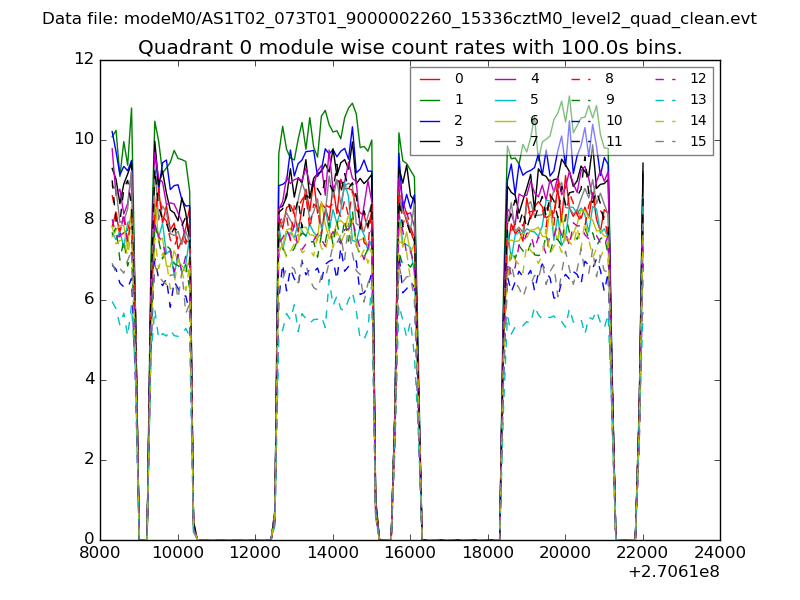 |
 |
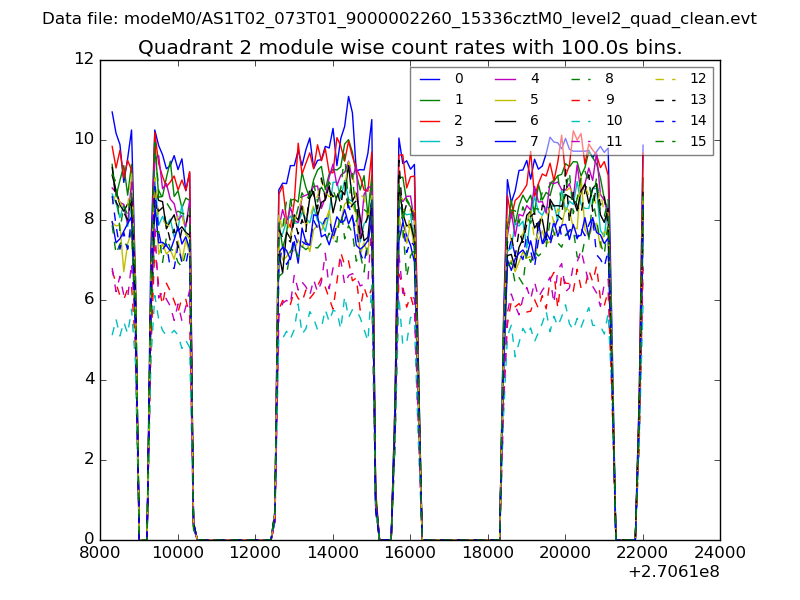
| Module-wise count rates for Quadrant B Data is divided into 100 sec bins |
 |
 |
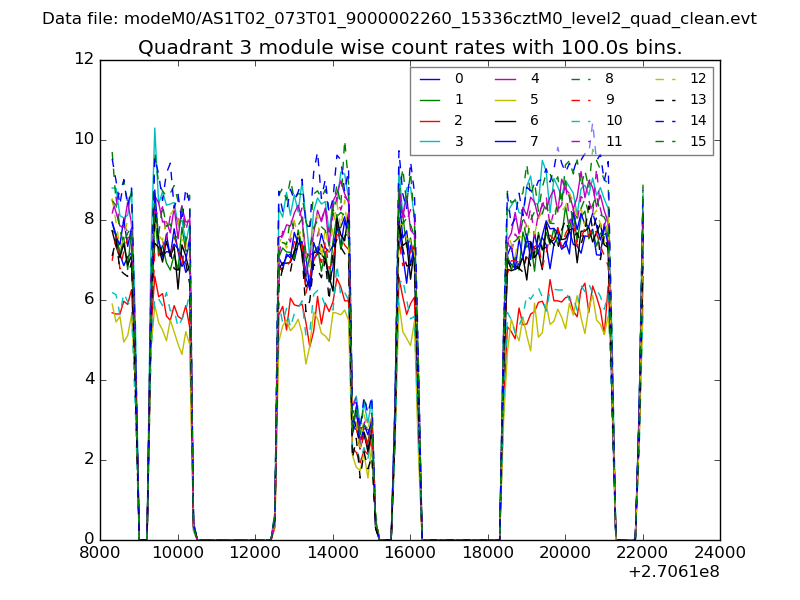
| Module-wise count rates for Quadrant C Data is divided into 100 sec bins |
 |
 |
| Module-wise count rates for Quadrant D Data is divided into 100 sec bins |
 |
 |
| Parameter | Plot |
|---|---|
| CZT HV Monitor | 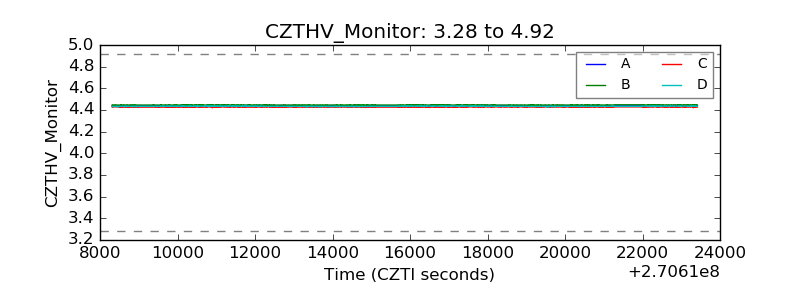 |
| D_VDD | 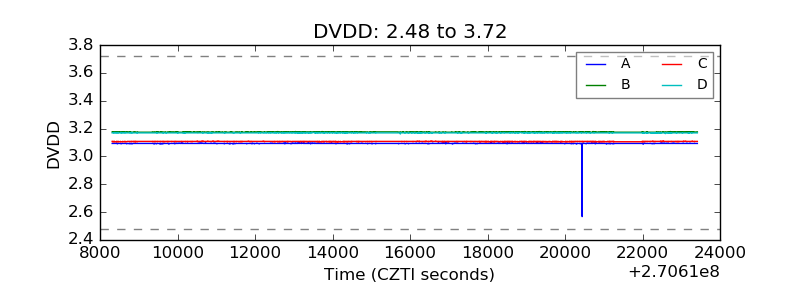 |
| Temperature 1 | 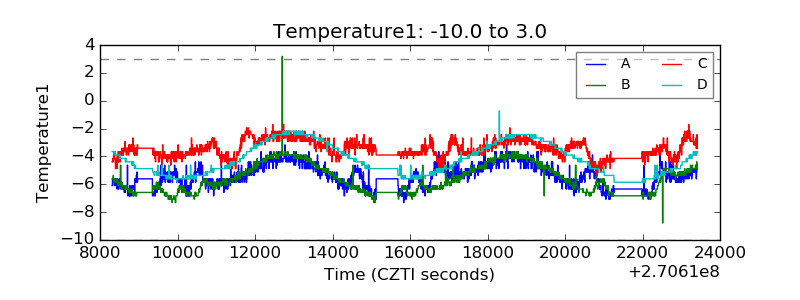 |
| Veto HV Monitor | 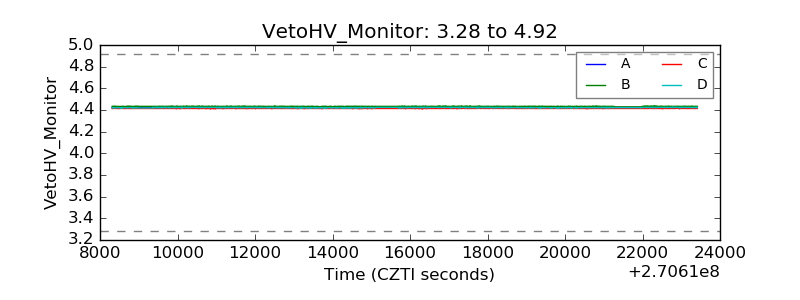 |
| Veto LLD | 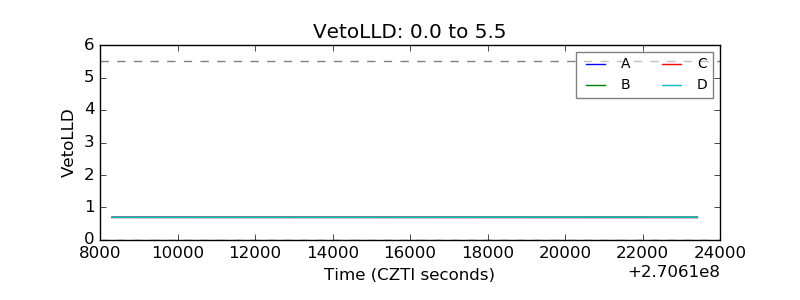 |
| Alpha Counter | 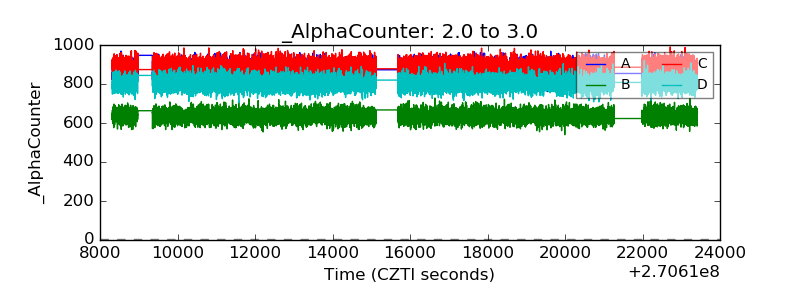 |
| _CPM_Rate | 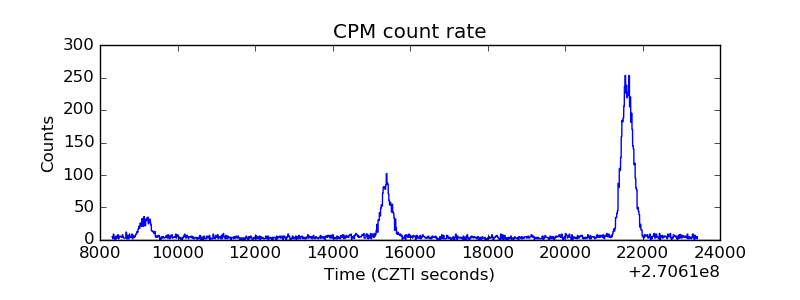 |
| CZT Counter | 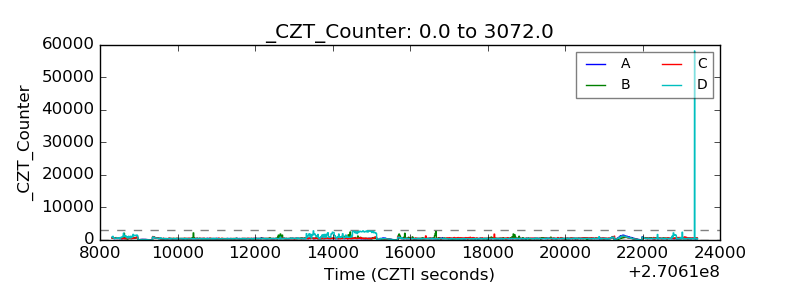 |
| +2.5 Volts monitor | 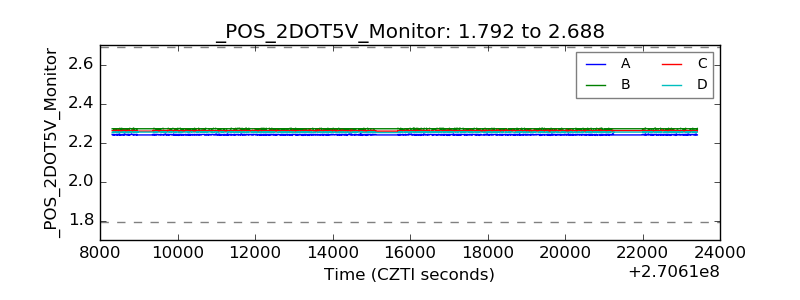 |
| +5 Volts monitor |  |
| _ROLL_ROT | 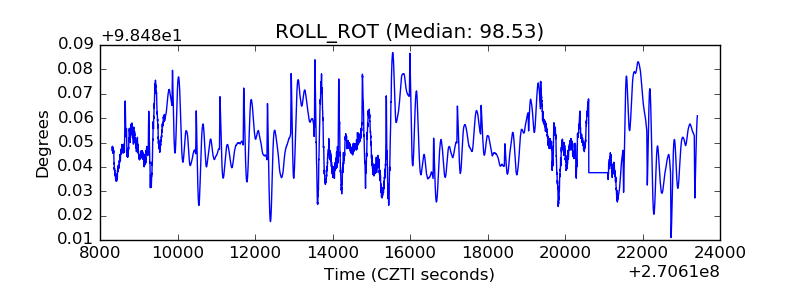 |
| _Roll_DEC | 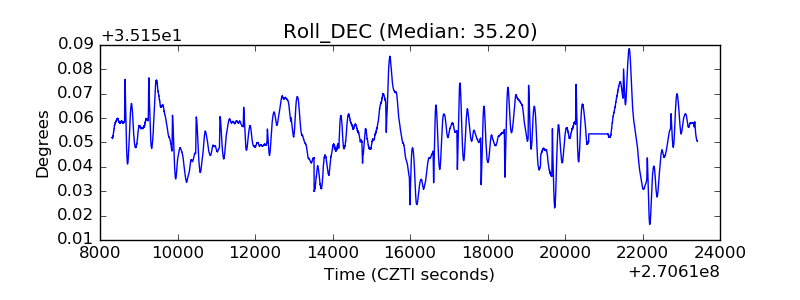 |
| _Roll_RA | 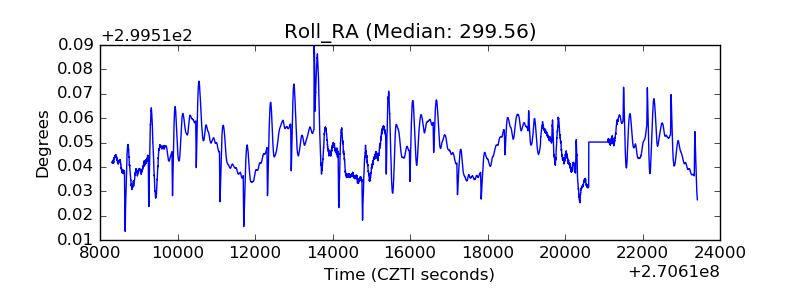 |
| Veto Counter |  |