| Param | Original file | Final file |
|---|---|---|
| Filename | modeM0/AS1T02_073T01_9000002260_15337cztM0_level2.evt | modeM0/AS1T02_073T01_9000002260_15337cztM0_level2_quad_clean.evt |
| Size (bytes) | 466,427,520 | 69,094,080 |
| Size | 444.8 MB | 65.9 MB |
| Events in quadrant A | 3,193,614 | 408,800 |
| Events in quadrant B | 3,472,314 | 413,438 |
| Events in quadrant C | 3,498,220 | 404,975 |
| Events in quadrant D | 3,498,605 | 389,716 |
| Mode SS | |||
|---|---|---|---|
| Quadrant | BADHDUFLAG | Total packets | Discarded packets |
| A | 0 | 140 | 0 |
| B | 0 | 140 | 0 |
| C | 0 | 140 | 0 |
| D | 0 | 140 | 0 |
| Mode M0 | |||
|---|---|---|---|
| Quadrant | BADHDUFLAG | Total packets | Discarded packets |
| A | 0 | 13900 | 3 |
| B | 0 | 14522 | 2 |
| C | 0 | 14381 | 2 |
| D | 0 | 15063 | 2 |
| Mode M9 | |||
|---|---|---|---|
| Quadrant | BADHDUFLAG | Total packets | Discarded packets |
| A | 0 | 10 | 0 |
| B | 0 | 10 | 0 |
| C | 0 | 10 | 0 |
| D | 0 | 11 | 0 |
| Quadrant | Total seconds | Saturated seconds | Saturation percentage |
|---|---|---|---|
| A | 6810 | 56 | 0.822320% |
| B | 6810 | 77 | 1.130690% |
| C | 6810 | 45 | 0.660793% |
| D | 6810 | 97 | 1.424376% |
Noise dominated data is calculated using 1-second bins in cleaned event files. If a bin has >2000 counts, and if more than 50% of those come from <1% of pixels, then it is considered to be noise-dominated and hence unusable.
| Quadrant | # 1 sec bins | Bins with >0 counts | Bins with >2000 counts | High rate bins dominated by noise | Noise dominated (total time) | Noise dominated (detector-on time) | Marked lightcurve |
|---|---|---|---|---|---|---|---|
| A | 7691 | 6811 | 0 | 0 | 0.00% | 0.00% | 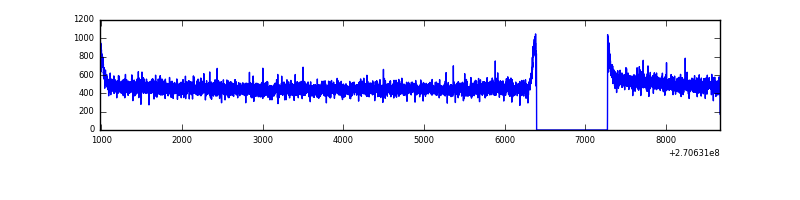 |
| B | 7691 | 6811 | 7 | 7 | 0.09% | 0.10% | 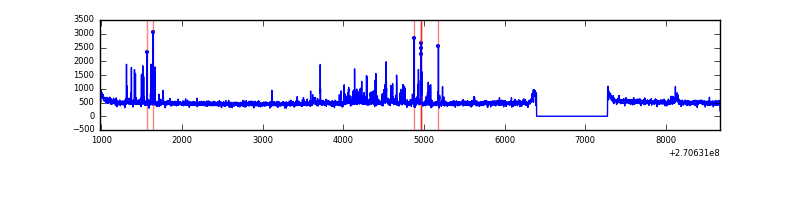 |
| C | 7691 | 6812 | 0 | 0 | 0.00% | 0.00% | 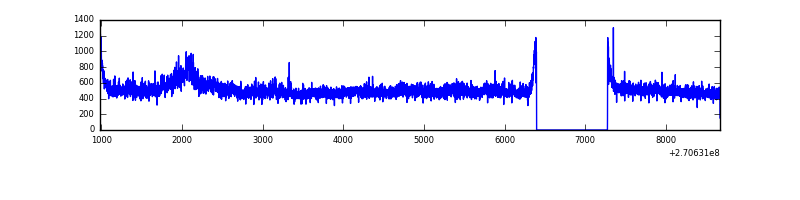 |
| D | 7691 | 6811 | 38 | 38 | 0.49% | 0.56% | 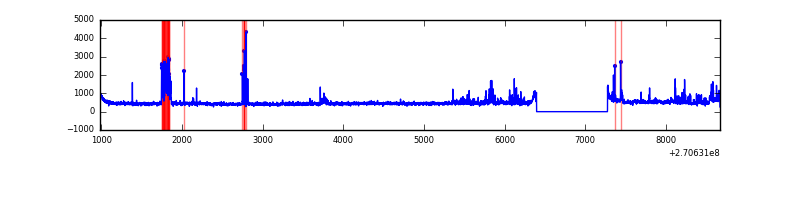 |
Top three noisy pixels from each quadrant. If the there are fewer than three noisy pixels in the level2.evt file, extra rows are filled as -1
| Pixel properties | Quadrant properties | ||||||
|---|---|---|---|---|---|---|---|
| Quadrant | DetID | PixID | Counts | Sigma | Mean | Median | Sigma |
| A | 0 | 226 | 7199 | 37.88 | 829 | 810 | 168.7 |
| A | 15 | 239 | 6490 | 33.68 | 829 | 810 | 168.7 |
| A | 12 | 194 | 5950 | 30.47 | 829 | 810 | 168.7 |
| B | 3 | 64 | 148698 | 919.21 | 826 | 803 | 160.9 |
| B | 10 | 16 | 51846 | 317.25 | 826 | 803 | 160.9 |
| B | 10 | 245 | 26151 | 157.54 | 826 | 803 | 160.9 |
| C | 3 | 233 | 379517 | 2037.49 | 799 | 801 | 185.9 |
| C | 13 | 61 | 5753 | 26.64 | 799 | 801 | 185.9 |
| C | 0 | 207 | 2718 | 10.31 | 799 | 801 | 185.9 |
| D | 13 | 122 | 234946 | 1198.01 | 798 | 774 | 195.5 |
| D | 2 | 14 | 161454 | 822.03 | 798 | 774 | 195.5 |
| D | 2 | 136 | 47017 | 236.58 | 798 | 774 | 195.5 |
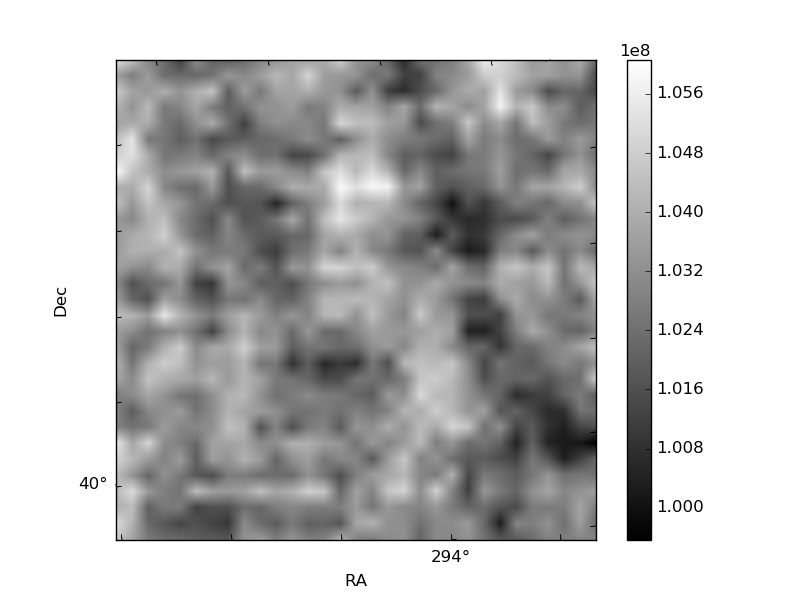
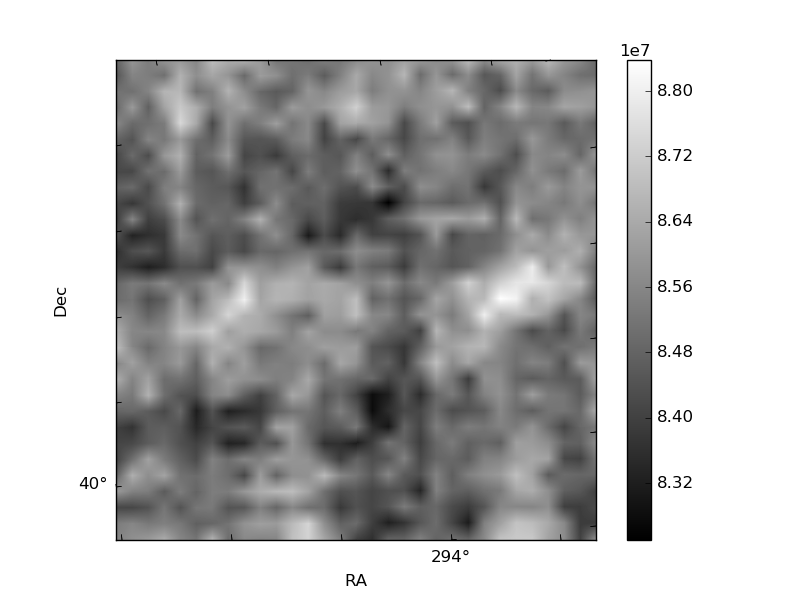
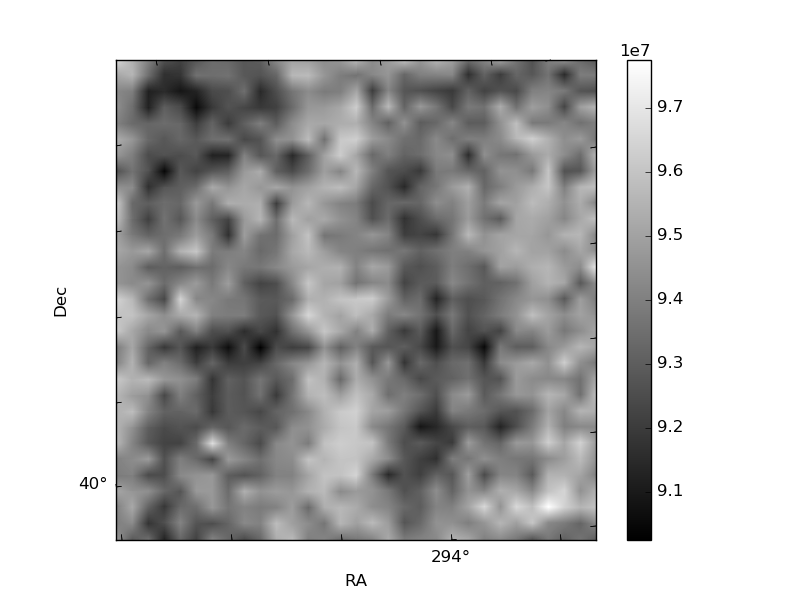
Histogram calculated using DETX and DETY for each event in the final _common_clean file
| Quadrant A | 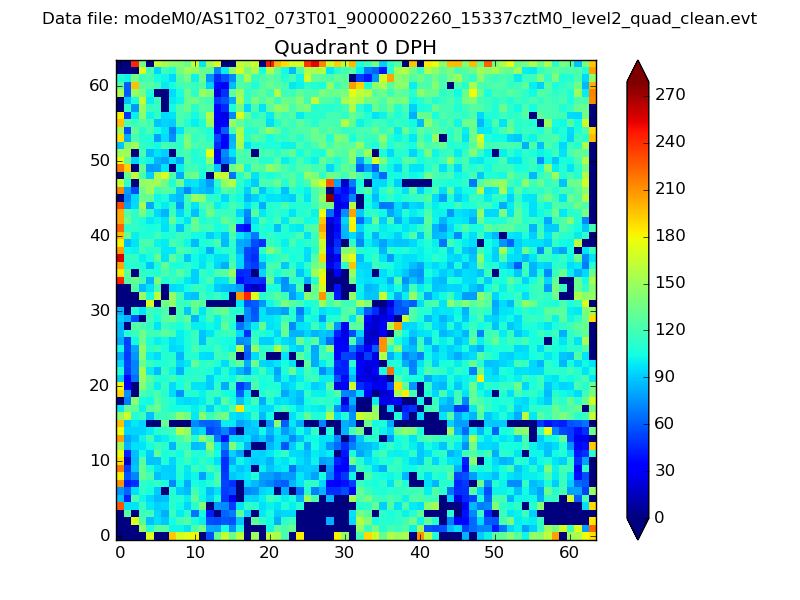 |
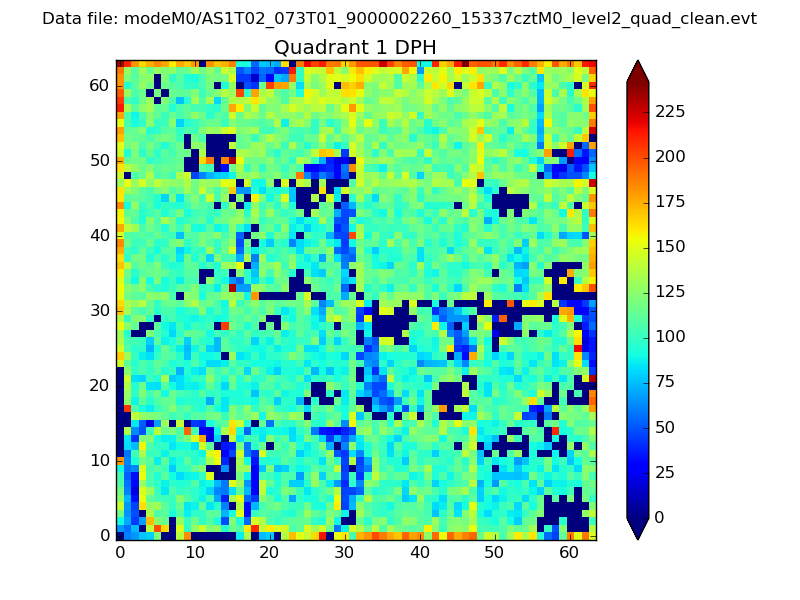 |
Quadrant B |
|---|---|---|---|
| Quadrant D | 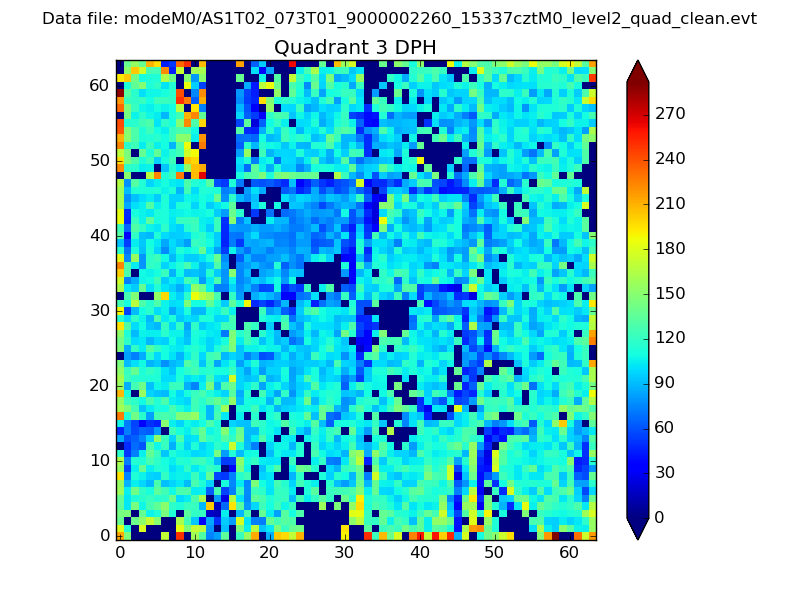 |
 |
Quadrant C |
| Plot type | Count rate plots | Images |
|---|---|---|
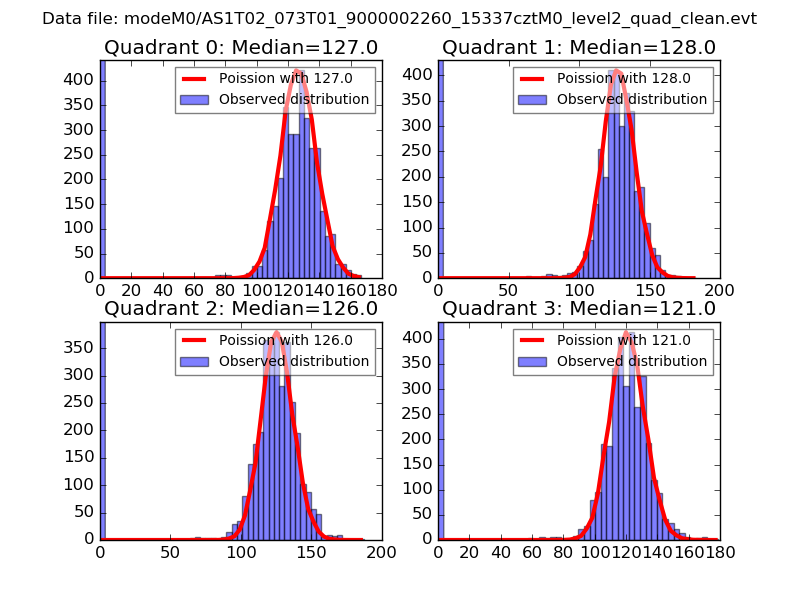
| Comparison with Poisson distribution Blue bars denote a histogram of data divided into 1 sec bins. Red curve is a Poisson curve with rate = median count rate of data. |
 |
 |
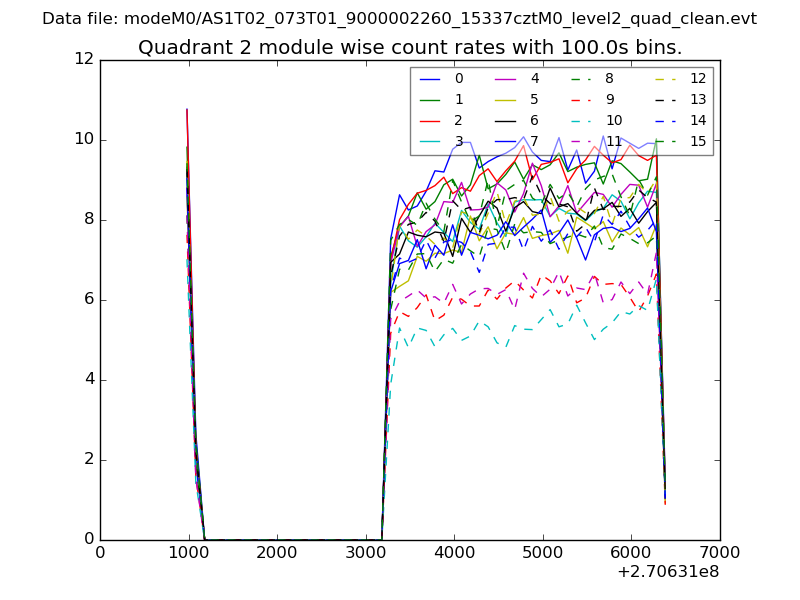
| Quadrant-wise count rates Data is divided into 100 sec bins |
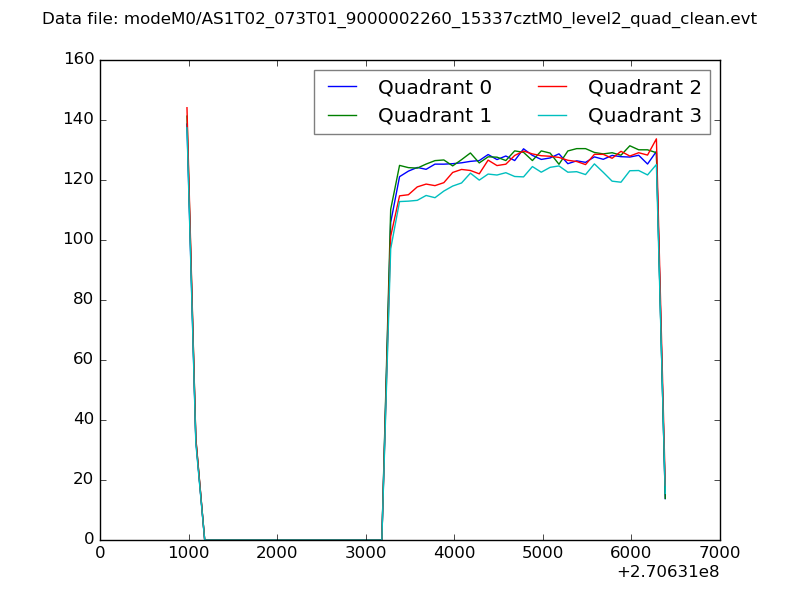 |
|
| Module-wise count rates for Quadrant A Data is divided into 100 sec bins |
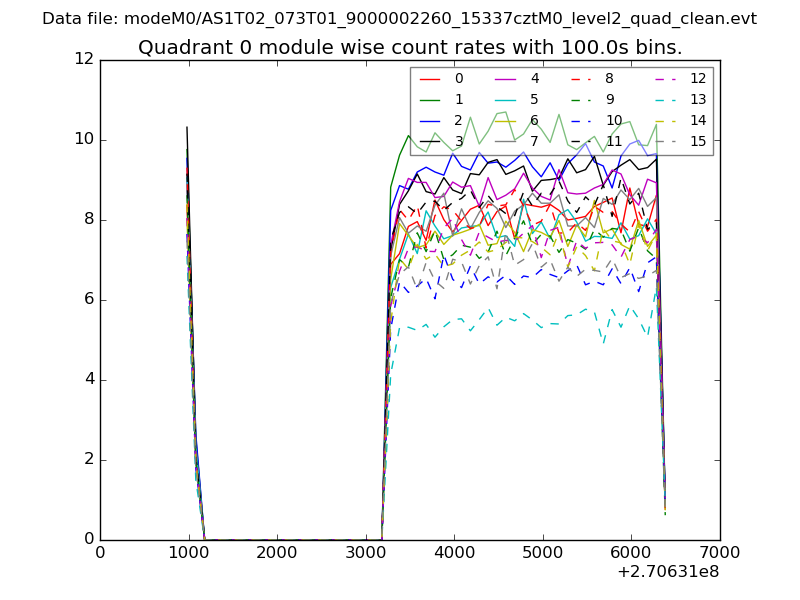 |
 |
| Module-wise count rates for Quadrant B Data is divided into 100 sec bins |
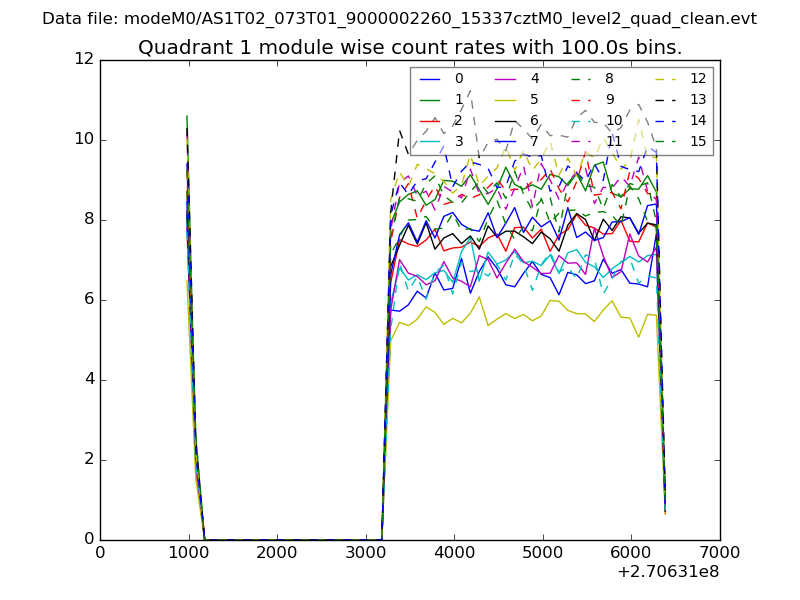 |
 |
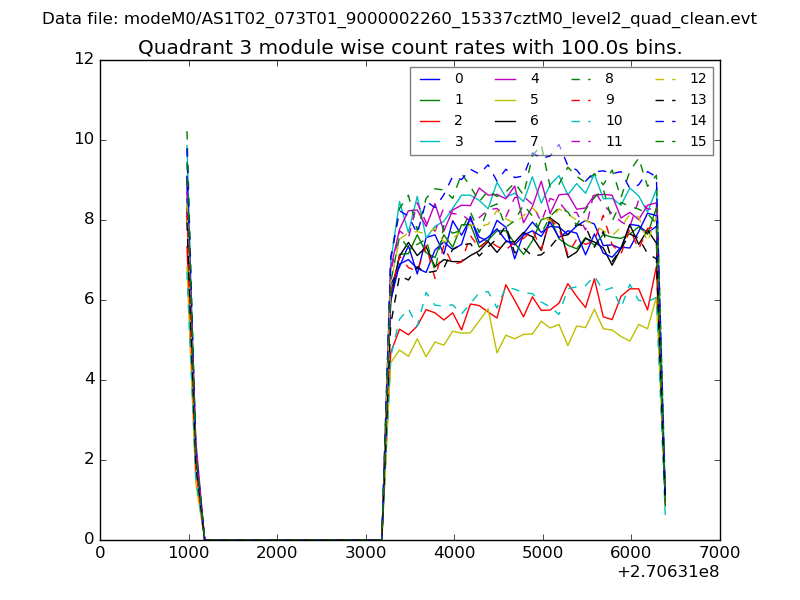
| Module-wise count rates for Quadrant C Data is divided into 100 sec bins |
 |
 |
| Module-wise count rates for Quadrant D Data is divided into 100 sec bins |
 |
 |
| Parameter | Plot |
|---|---|
| CZT HV Monitor | 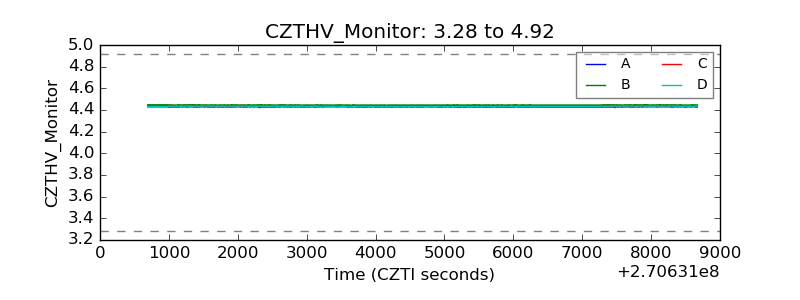 |
| D_VDD | 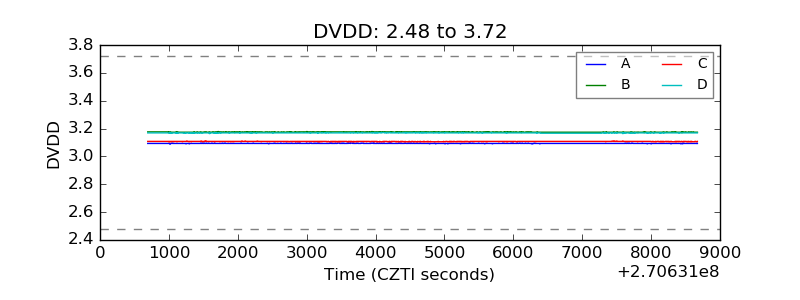 |
| Temperature 1 | 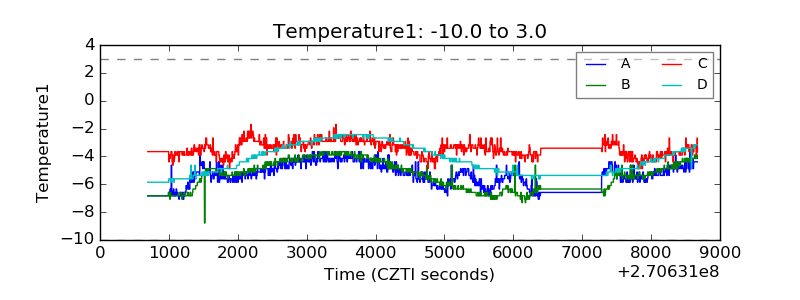 |
| Veto HV Monitor | 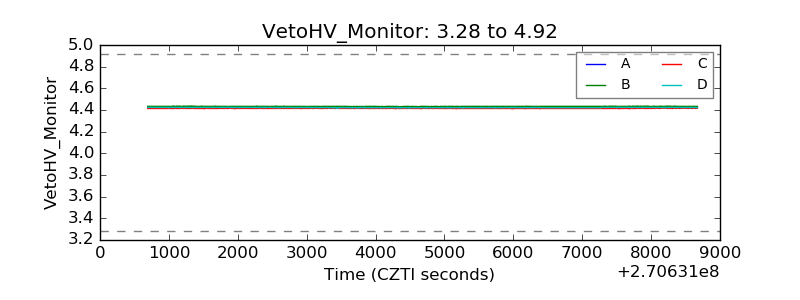 |
| Veto LLD | 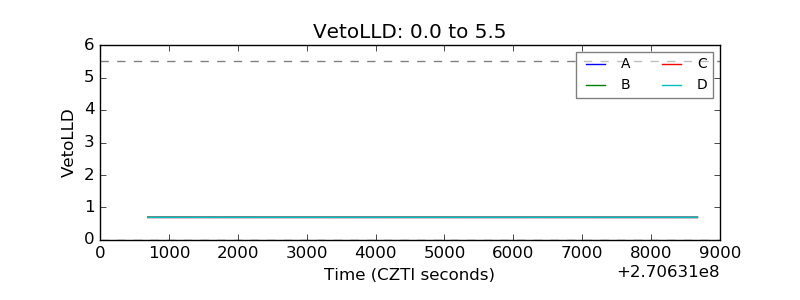 |
| Alpha Counter | 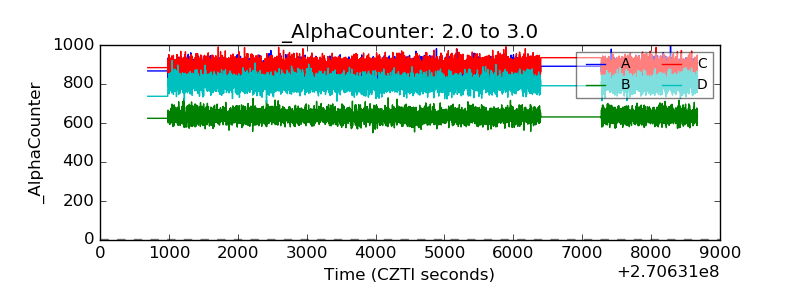 |
| _CPM_Rate | 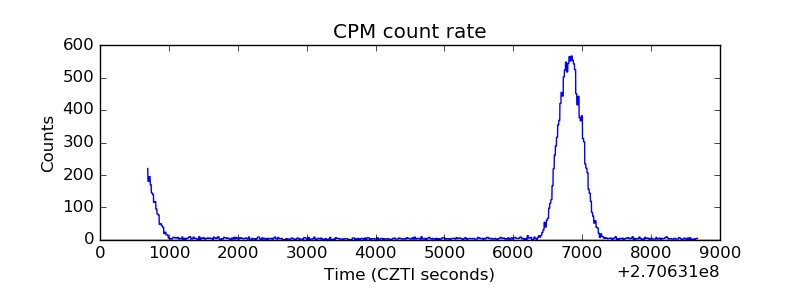 |
| CZT Counter | 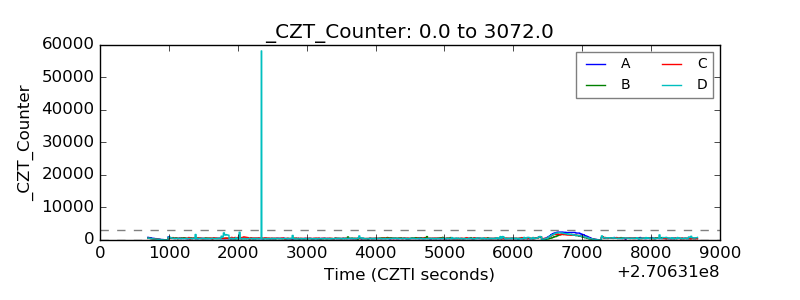 |
| +2.5 Volts monitor |  |
| +5 Volts monitor | 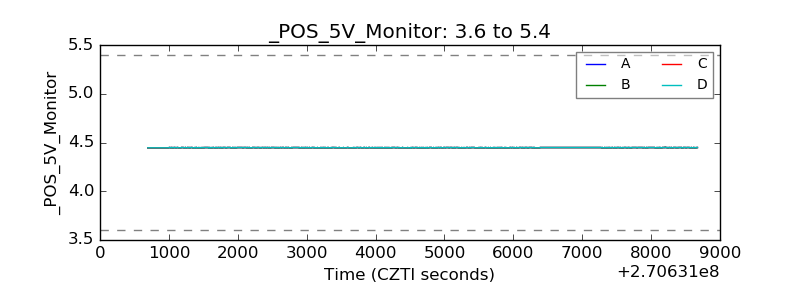 |
| _ROLL_ROT | 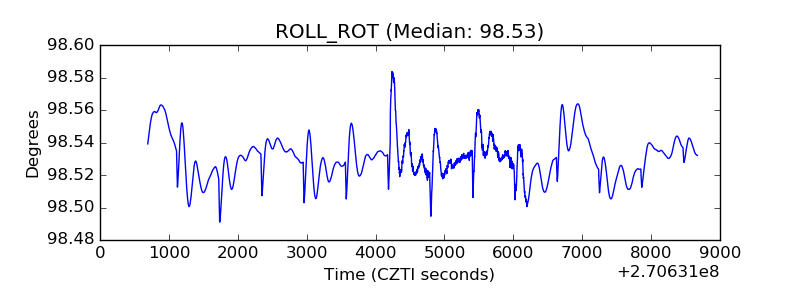 |
| _Roll_DEC | 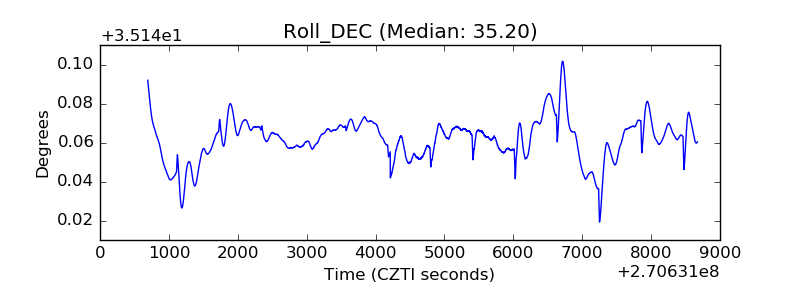 |
| _Roll_RA |  |
| Veto Counter | 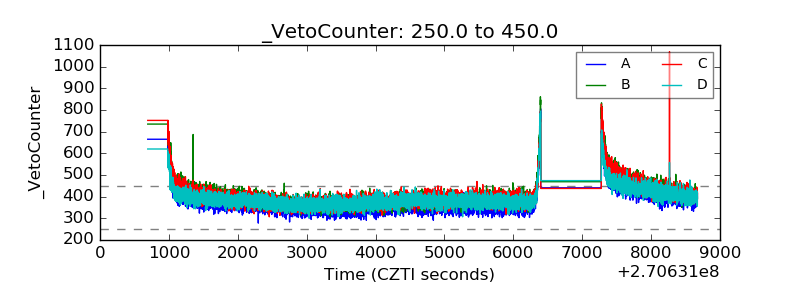 |