| Param | Original file | Final file |
|---|---|---|
| Filename | modeM0/AS1T02_073T01_9000002260_15338cztM0_level2.evt | modeM0/AS1T02_073T01_9000002260_15338cztM0_level2_quad_clean.evt |
| Size (bytes) | 514,776,960 | 86,823,360 |
| Size | 490.9 MB | 82.8 MB |
| Events in quadrant A | 3,555,534 | 537,726 |
| Events in quadrant B | 3,606,380 | 543,625 |
| Events in quadrant C | 3,633,650 | 531,911 |
| Events in quadrant D | 4,298,918 | 507,693 |
| Mode SS | |||
|---|---|---|---|
| Quadrant | BADHDUFLAG | Total packets | Discarded packets |
| A | 0 | 152 | 0 |
| B | 0 | 152 | 0 |
| C | 0 | 152 | 0 |
| D | 0 | 152 | 0 |
| Mode M0 | |||
|---|---|---|---|
| Quadrant | BADHDUFLAG | Total packets | Discarded packets |
| A | 0 | 15181 | 3 |
| B | 0 | 15219 | 2 |
| C | 0 | 15217 | 2 |
| D | 0 | 17496 | 2 |
| Mode M9 | |||
|---|---|---|---|
| Quadrant | BADHDUFLAG | Total packets | Discarded packets |
| A | 0 | 18 | 0 |
| B | 0 | 18 | 0 |
| C | 0 | 18 | 0 |
| D | 0 | 18 | 0 |
| Quadrant | Total seconds | Saturated seconds | Saturation percentage |
|---|---|---|---|
| A | 7293 | 103 | 1.412313% |
| B | 7293 | 111 | 1.522007% |
| C | 7293 | 85 | 1.165501% |
| D | 7293 | 106 | 1.453449% |
Noise dominated data is calculated using 1-second bins in cleaned event files. If a bin has >2000 counts, and if more than 50% of those come from <1% of pixels, then it is considered to be noise-dominated and hence unusable.
| Quadrant | # 1 sec bins | Bins with >0 counts | Bins with >2000 counts | High rate bins dominated by noise | Noise dominated (total time) | Noise dominated (detector-on time) | Marked lightcurve |
|---|---|---|---|---|---|---|---|
| A | 9194 | 7294 | 2 | 2 | 0.02% | 0.03% | 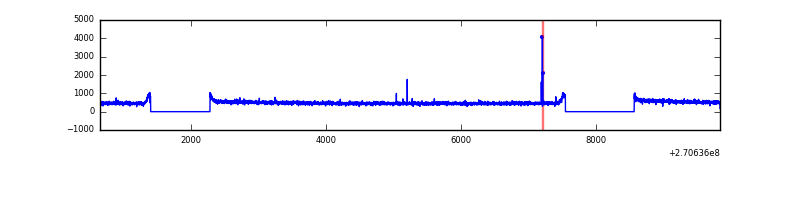 |
| B | 9194 | 7294 | 0 | 0 | 0.00% | 0.00% | 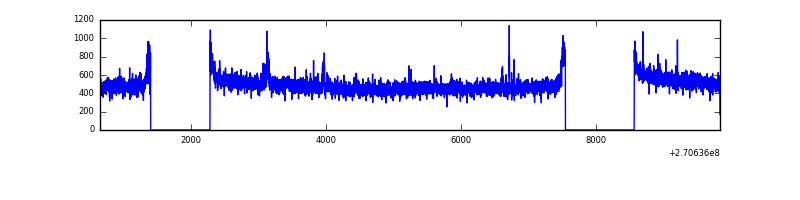 |
| C | 9194 | 7295 | 0 | 0 | 0.00% | 0.00% | 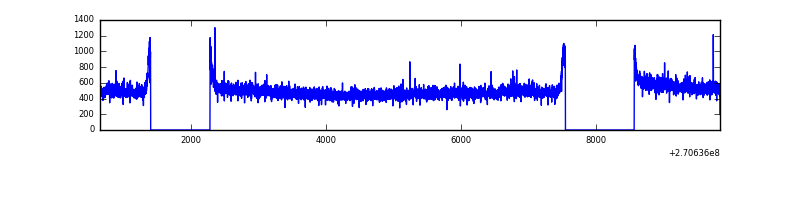 |
| D | 9194 | 7294 | 22 | 22 | 0.24% | 0.30% | 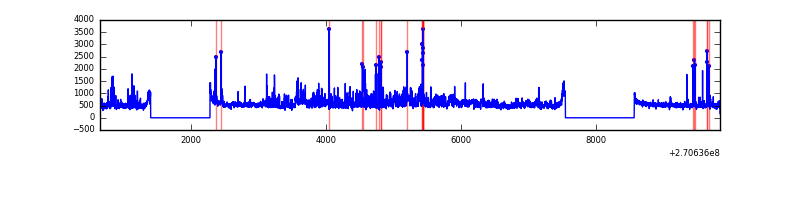 |
Top three noisy pixels from each quadrant. If the there are fewer than three noisy pixels in the level2.evt file, extra rows are filled as -1
| Pixel properties | Quadrant properties | ||||||
|---|---|---|---|---|---|---|---|
| Quadrant | DetID | PixID | Counts | Sigma | Mean | Median | Sigma |
| A | 4 | 2 | 17639 | 90.04 | 919 | 899 | 185.9 |
| A | 0 | 226 | 8121 | 38.84 | 919 | 899 | 185.9 |
| A | 15 | 239 | 6707 | 31.24 | 919 | 899 | 185.9 |
| B | 10 | 245 | 27493 | 151.32 | 913 | 892 | 175.8 |
| B | 12 | 111 | 21511 | 117.29 | 913 | 892 | 175.8 |
| B | 11 | 111 | 18804 | 101.89 | 913 | 892 | 175.8 |
| C | 3 | 233 | 145539 | 706.28 | 888 | 894 | 204.8 |
| C | 7 | 247 | 21507 | 100.65 | 888 | 894 | 204.8 |
| C | 13 | 61 | 6440 | 27.08 | 888 | 894 | 204.8 |
| D | 13 | 122 | 829206 | 3836.53 | 886 | 859 | 215.9 |
| D | 2 | 136 | 57309 | 261.45 | 886 | 859 | 215.9 |
| D | 2 | 234 | 24104 | 107.66 | 886 | 859 | 215.9 |
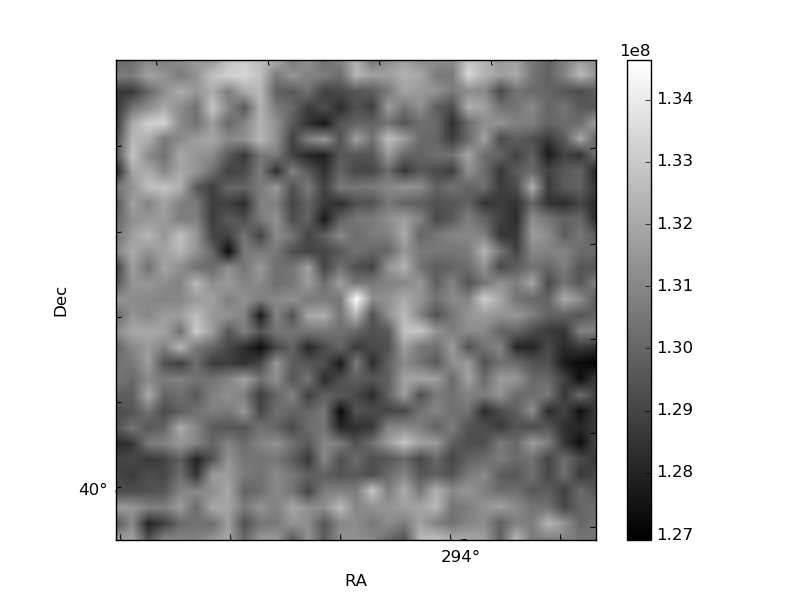
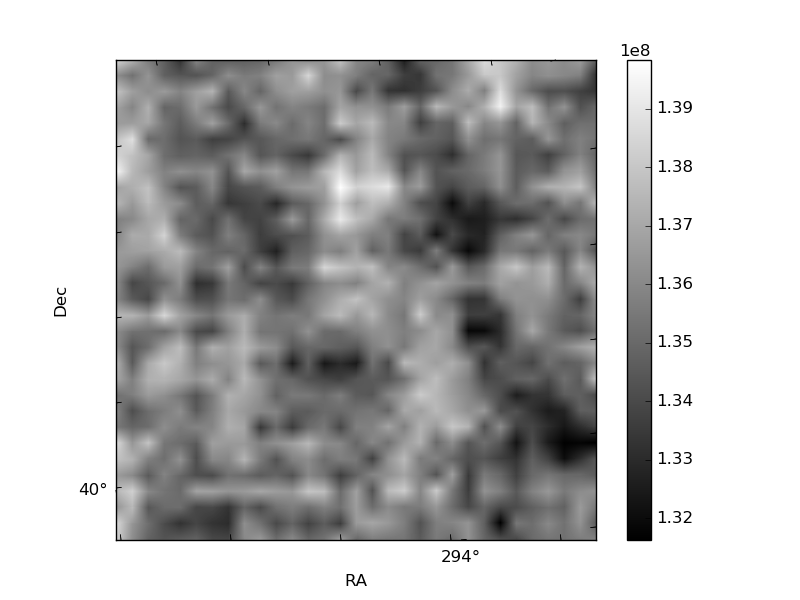
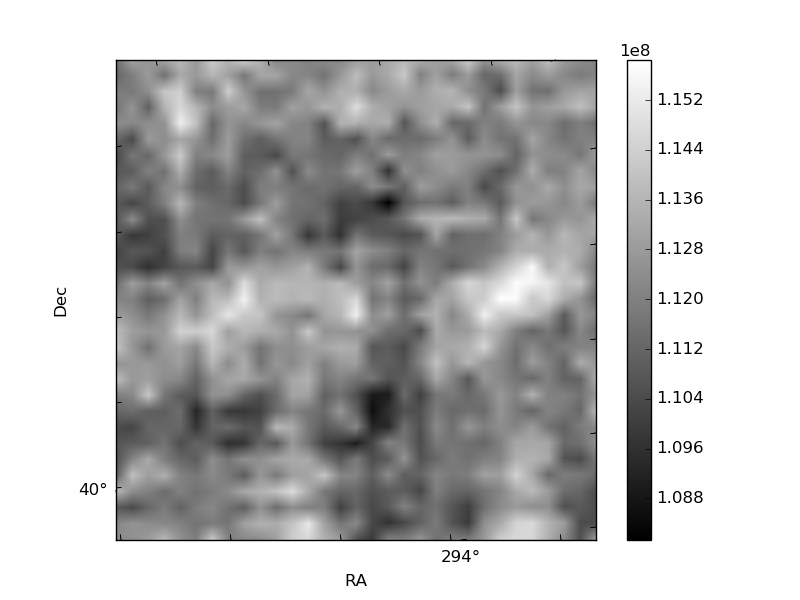
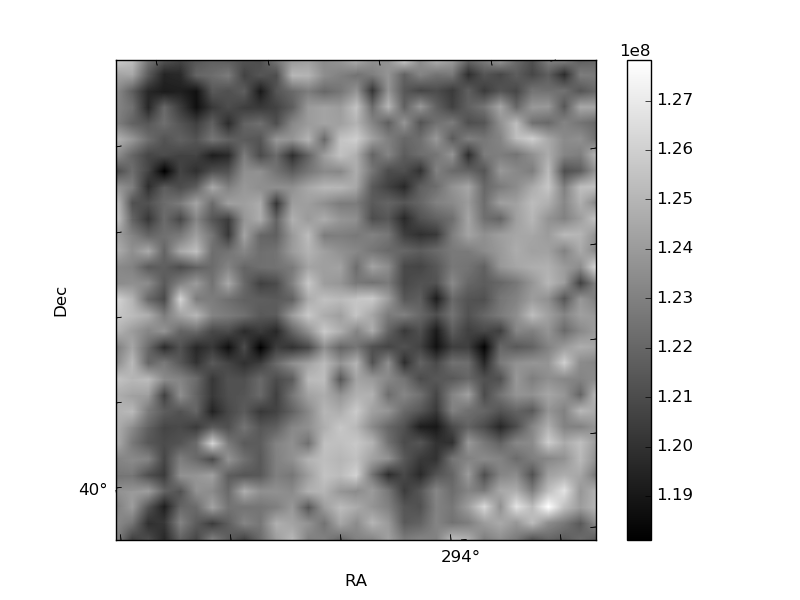
Histogram calculated using DETX and DETY for each event in the final _common_clean file
| Quadrant A | 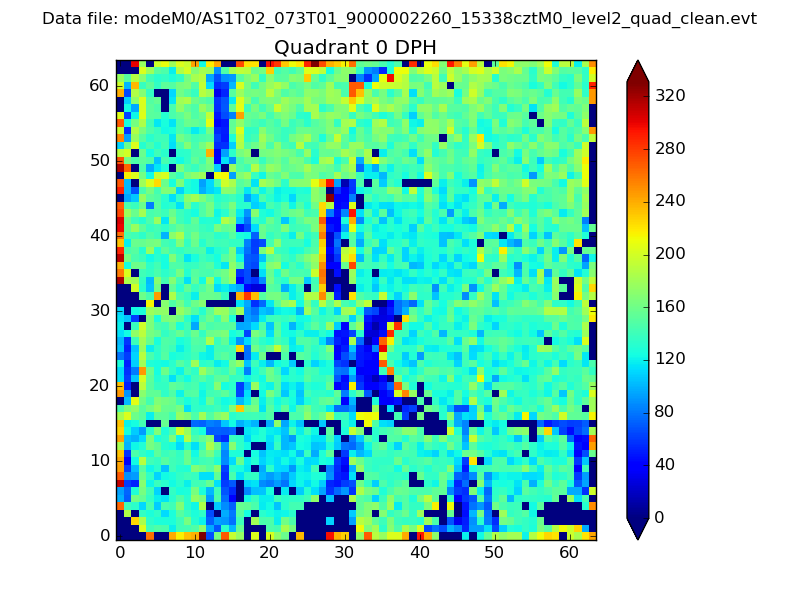 |
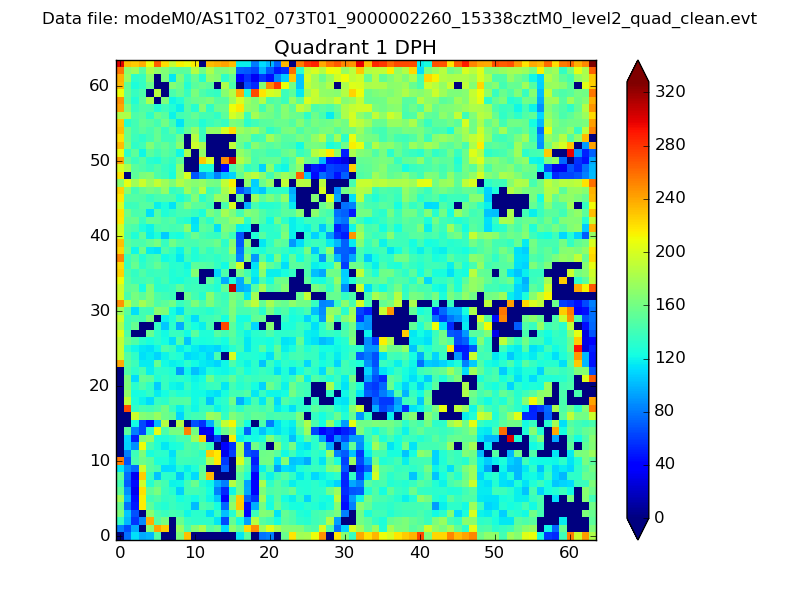 |
Quadrant B |
|---|---|---|---|
| Quadrant D | 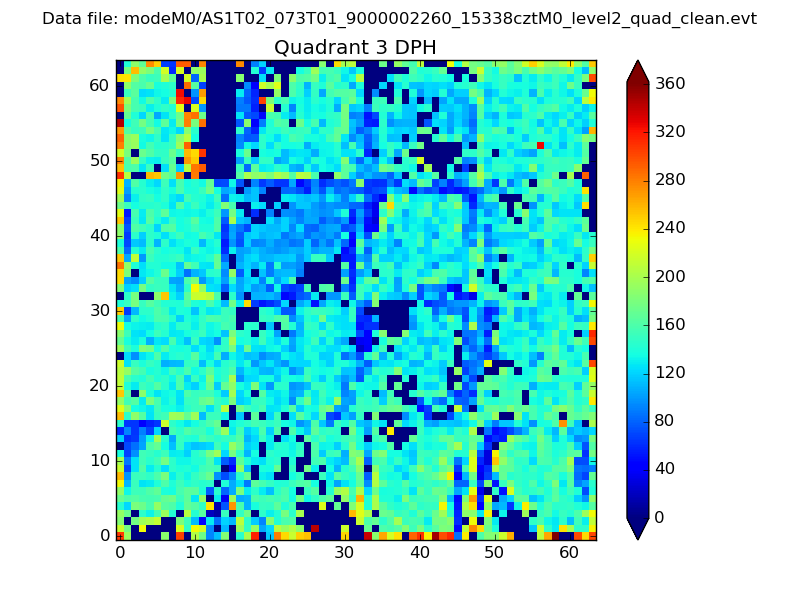 |
 |
Quadrant C |
| Plot type | Count rate plots | Images |
|---|---|---|
| Comparison with Poisson distribution Blue bars denote a histogram of data divided into 1 sec bins. Red curve is a Poisson curve with rate = median count rate of data. |
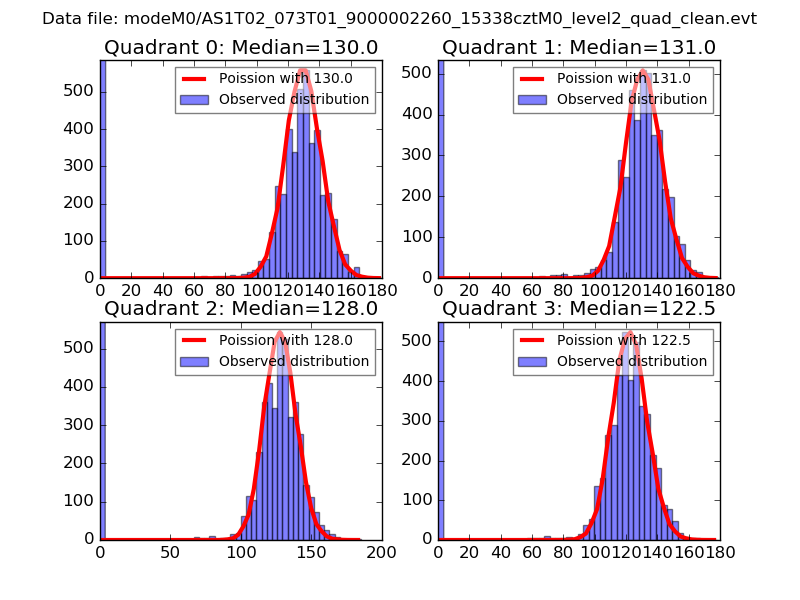 |
 |
| Quadrant-wise count rates Data is divided into 100 sec bins |
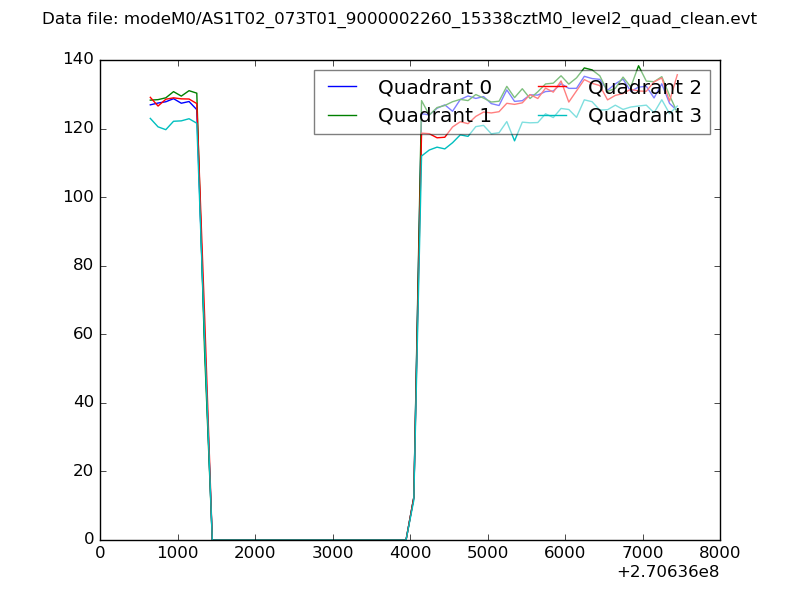 |
|
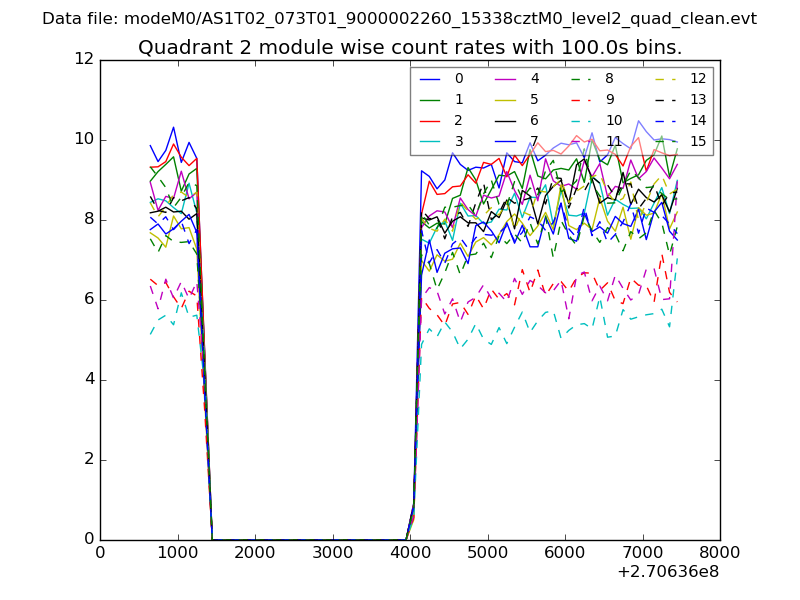
| Module-wise count rates for Quadrant A Data is divided into 100 sec bins |
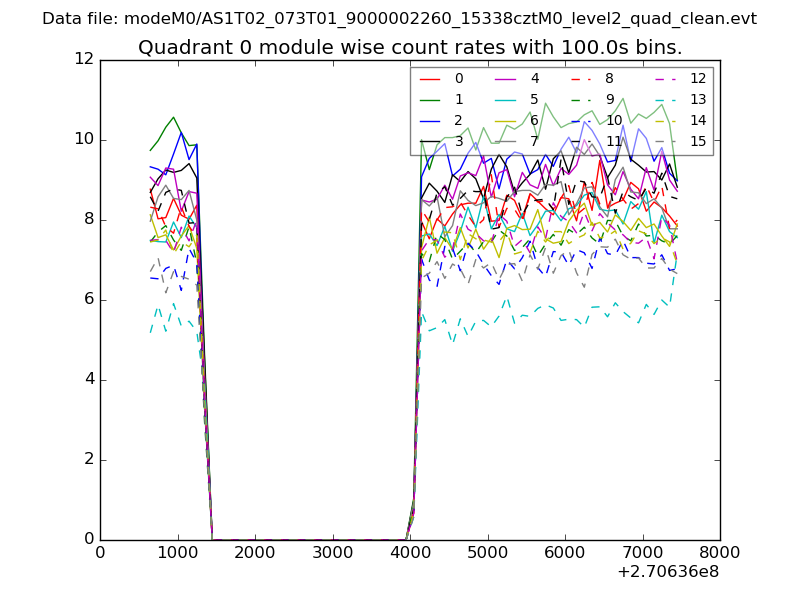 |
 |
| Module-wise count rates for Quadrant B Data is divided into 100 sec bins |
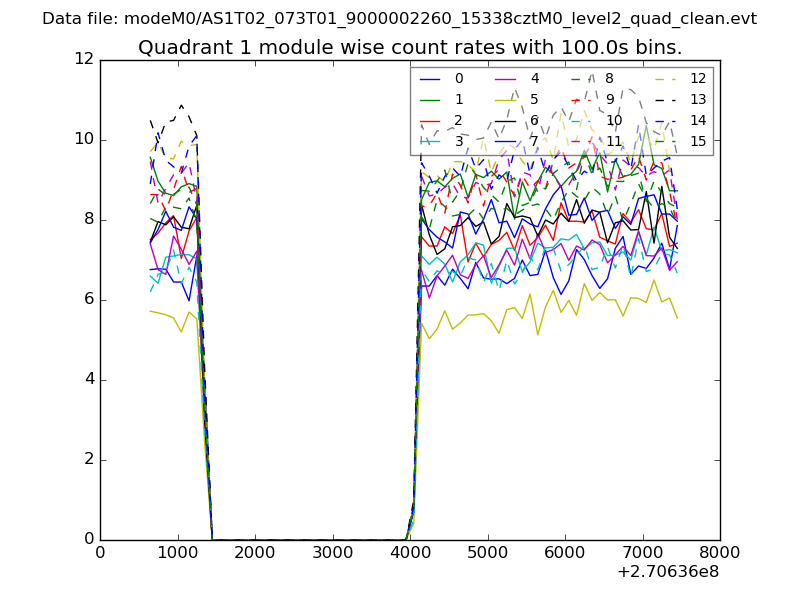 |
 |
| Module-wise count rates for Quadrant C Data is divided into 100 sec bins |
 |
 |
| Module-wise count rates for Quadrant D Data is divided into 100 sec bins |
 |
 |
| Parameter | Plot |
|---|---|
| CZT HV Monitor | 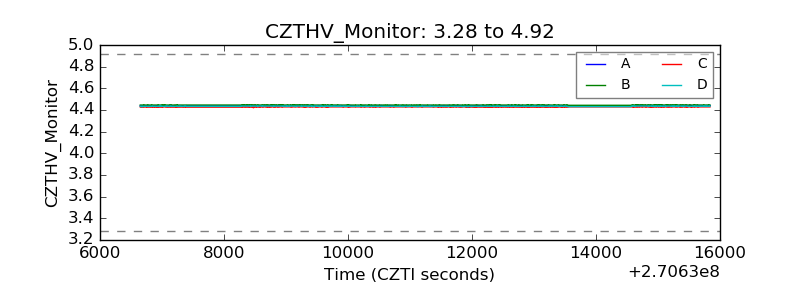 |
| D_VDD | 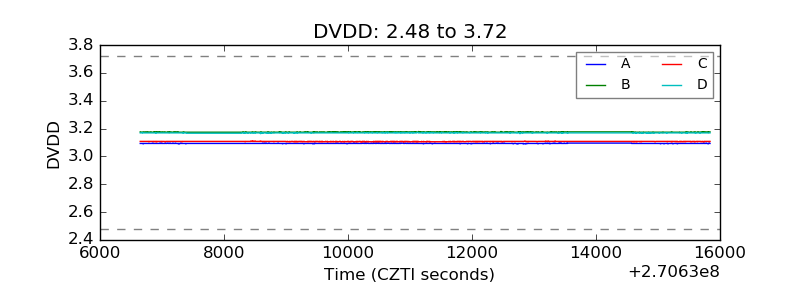 |
| Temperature 1 | 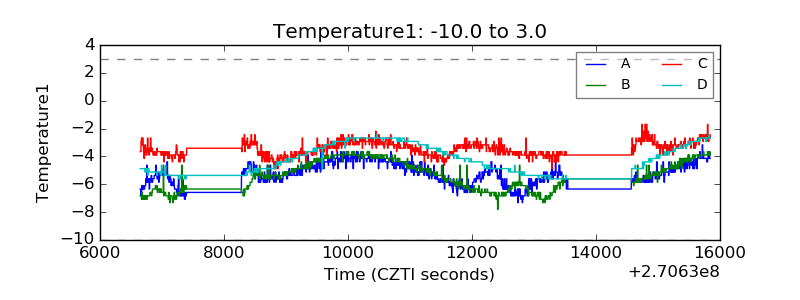 |
| Veto HV Monitor | 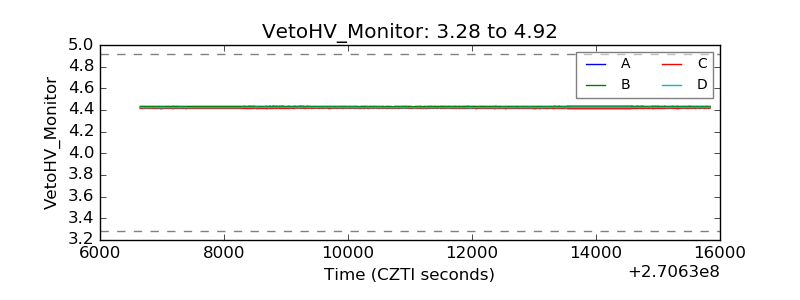 |
| Veto LLD | 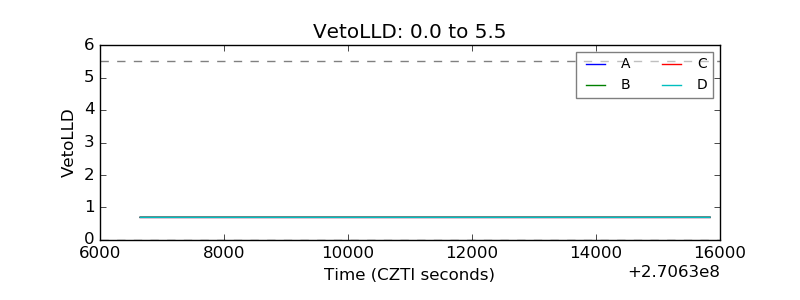 |
| Alpha Counter | 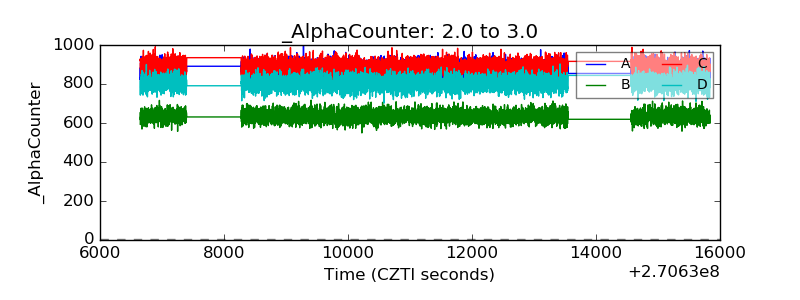 |
| _CPM_Rate | 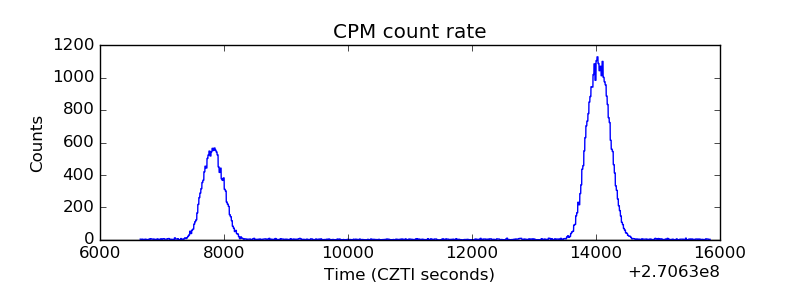 |
| CZT Counter |  |
| +2.5 Volts monitor |  |
| +5 Volts monitor |  |
| _ROLL_ROT |  |
| _Roll_DEC |  |
| _Roll_RA |  |
| Veto Counter |  |