| Param | Original file | Final file |
|---|---|---|
| Filename | modeM0/AS1T02_073T01_9000002260_15340cztM0_level2.evt | modeM0/AS1T02_073T01_9000002260_15340cztM0_level2_quad_clean.evt |
| Size (bytes) | 501,978,240 | 93,323,520 |
| Size | 478.7 MB | 89.0 MB |
| Events in quadrant A | 3,516,116 | 593,051 |
| Events in quadrant B | 3,583,324 | 600,172 |
| Events in quadrant C | 3,743,650 | 586,421 |
| Events in quadrant D | 3,888,200 | 563,118 |
| Mode SS | |||
|---|---|---|---|
| Quadrant | BADHDUFLAG | Total packets | Discarded packets |
| A | 0 | 144 | 0 |
| B | 0 | 144 | 0 |
| C | 0 | 144 | 0 |
| D | 0 | 144 | 0 |
| Mode M0 | |||
|---|---|---|---|
| Quadrant | BADHDUFLAG | Total packets | Discarded packets |
| A | 0 | 14900 | 3 |
| B | 0 | 15015 | 2 |
| C | 0 | 15235 | 2 |
| D | 0 | 15981 | 2 |
| Mode M9 | |||
|---|---|---|---|
| Quadrant | BADHDUFLAG | Total packets | Discarded packets |
| A | 0 | 21 | 0 |
| B | 0 | 21 | 0 |
| C | 0 | 21 | 0 |
| D | 0 | 21 | 0 |
| Quadrant | Total seconds | Saturated seconds | Saturation percentage |
|---|---|---|---|
| A | 6935 | 144 | 2.076424% |
| B | 6935 | 156 | 2.249459% |
| C | 6935 | 117 | 1.687094% |
| D | 6935 | 125 | 1.802451% |
Noise dominated data is calculated using 1-second bins in cleaned event files. If a bin has >2000 counts, and if more than 50% of those come from <1% of pixels, then it is considered to be noise-dominated and hence unusable.
| Quadrant | # 1 sec bins | Bins with >0 counts | Bins with >2000 counts | High rate bins dominated by noise | Noise dominated (total time) | Noise dominated (detector-on time) | Marked lightcurve |
|---|---|---|---|---|---|---|---|
| A | 9071 | 6936 | 2 | 2 | 0.02% | 0.03% | 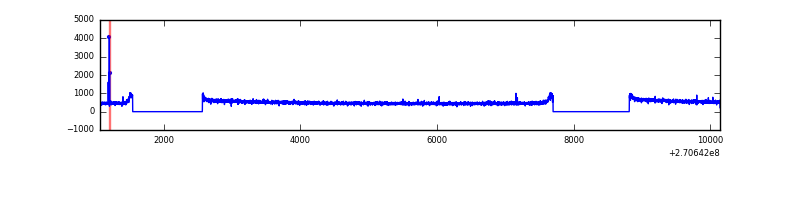 |
| B | 9071 | 6936 | 2 | 2 | 0.02% | 0.03% | 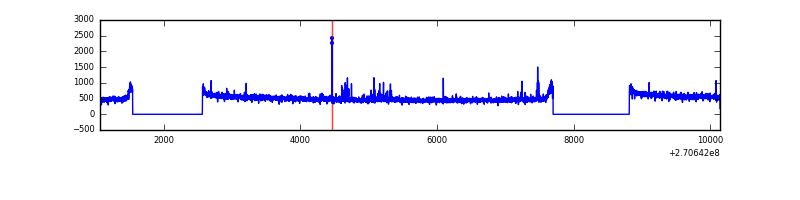 |
| C | 9071 | 6936 | 0 | 0 | 0.00% | 0.00% | 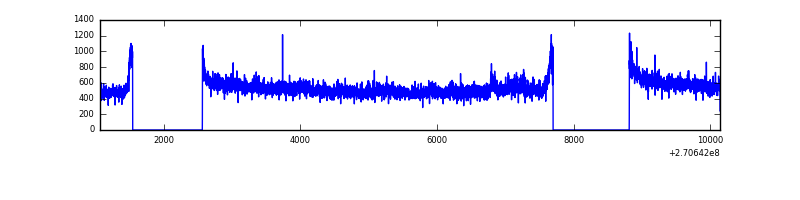 |
| D | 9071 | 6936 | 17 | 17 | 0.19% | 0.25% | 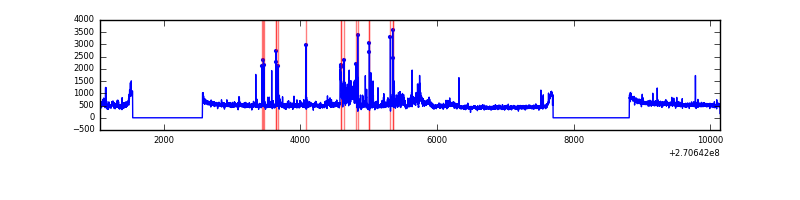 |
Top three noisy pixels from each quadrant. If the there are fewer than three noisy pixels in the level2.evt file, extra rows are filled as -1
| Pixel properties | Quadrant properties | ||||||
|---|---|---|---|---|---|---|---|
| Quadrant | DetID | PixID | Counts | Sigma | Mean | Median | Sigma |
| A | 4 | 2 | 15509 | 80.13 | 909 | 890 | 182.4 |
| A | 0 | 226 | 7974 | 38.83 | 909 | 890 | 182.4 |
| A | 12 | 194 | 6773 | 32.25 | 909 | 890 | 182.4 |
| B | 8 | 3 | 39162 | 224.34 | 899 | 878 | 170.7 |
| B | 12 | 111 | 20515 | 115.07 | 899 | 878 | 170.7 |
| B | 11 | 111 | 17984 | 100.24 | 899 | 878 | 170.7 |
| C | 3 | 233 | 309549 | 1528.4 | 880 | 884 | 202.0 |
| C | 13 | 61 | 6246 | 26.55 | 880 | 884 | 202.0 |
| C | 7 | 247 | 3146 | 11.2 | 880 | 884 | 202.0 |
| D | 13 | 122 | 491499 | 2284.23 | 881 | 855 | 214.8 |
| D | 2 | 136 | 37347 | 169.89 | 881 | 855 | 214.8 |
| D | 2 | 234 | 22944 | 102.84 | 881 | 855 | 214.8 |
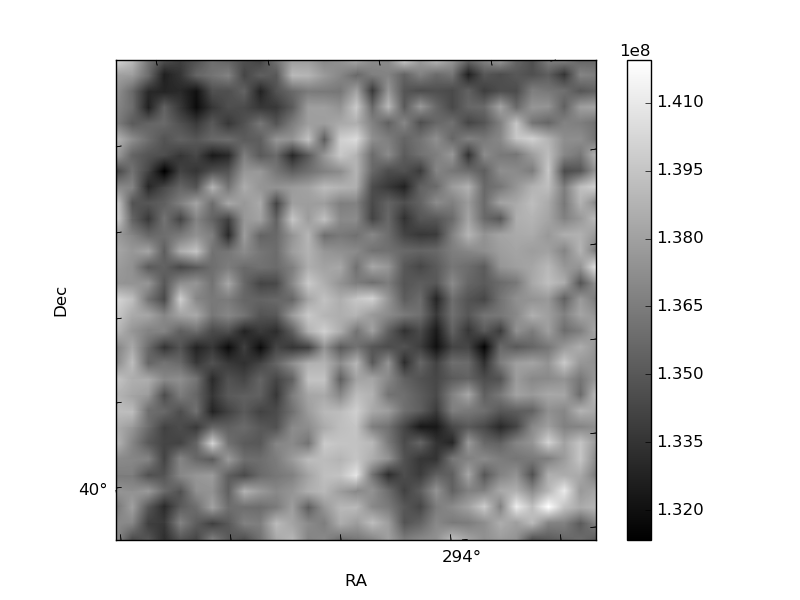
Histogram calculated using DETX and DETY for each event in the final _common_clean file
| Quadrant A |  |
 |
Quadrant B |
|---|---|---|---|
| Quadrant D |  |
 |
Quadrant C |
| Plot type | Count rate plots | Images |
|---|---|---|
| Comparison with Poisson distribution Blue bars denote a histogram of data divided into 1 sec bins. Red curve is a Poisson curve with rate = median count rate of data. |
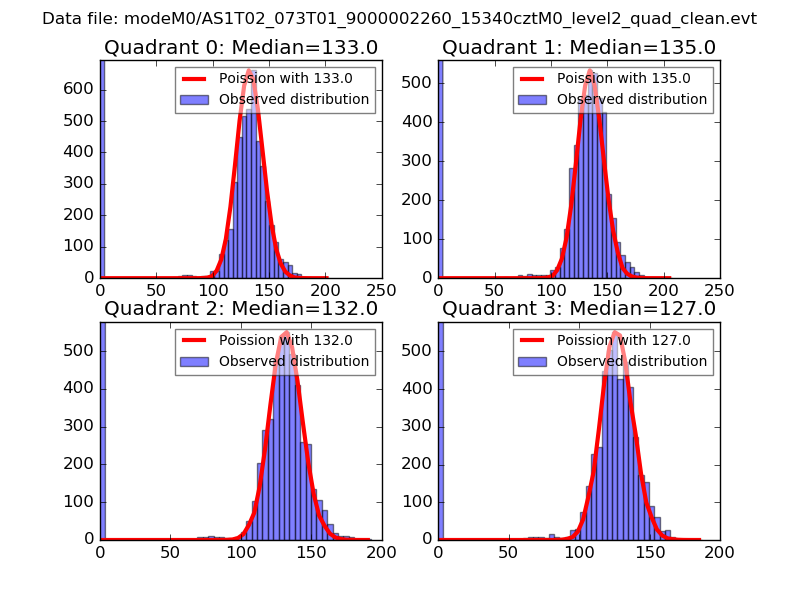 |
 |
| Quadrant-wise count rates Data is divided into 100 sec bins |
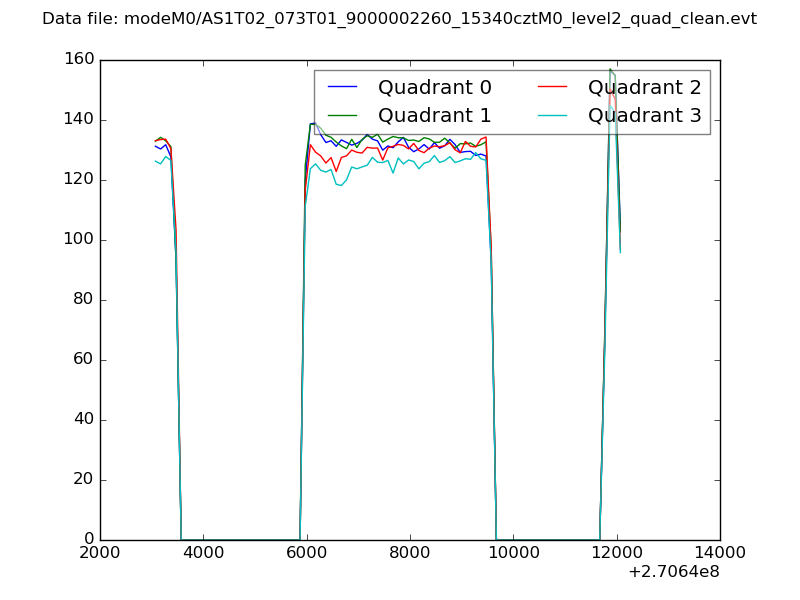 |
|
| Module-wise count rates for Quadrant A Data is divided into 100 sec bins |
 |
 |
| Module-wise count rates for Quadrant B Data is divided into 100 sec bins |
 |
 |
| Module-wise count rates for Quadrant C Data is divided into 100 sec bins |
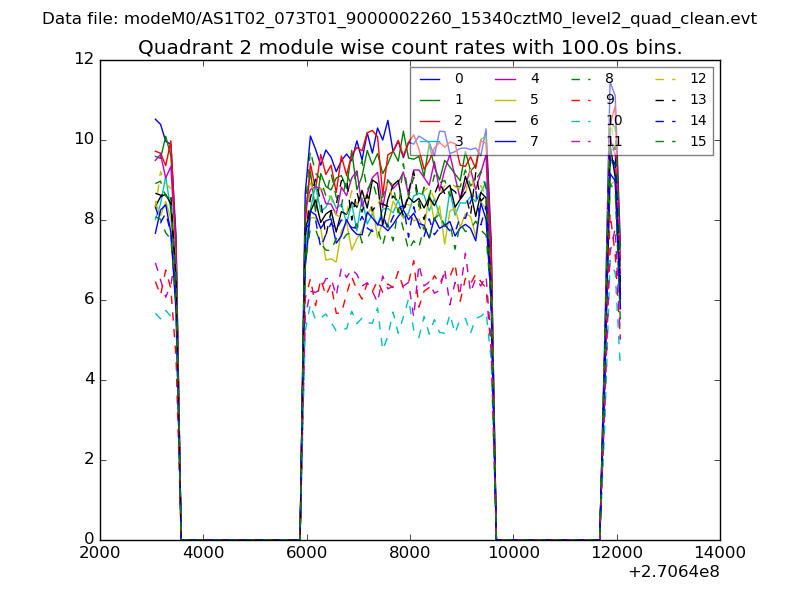 |
 |
| Module-wise count rates for Quadrant D Data is divided into 100 sec bins |
 |
 |
| Parameter | Plot |
|---|---|
| CZT HV Monitor |  |
| D_VDD |  |
| Temperature 1 |  |
| Veto HV Monitor |  |
| Veto LLD |  |
| Alpha Counter | 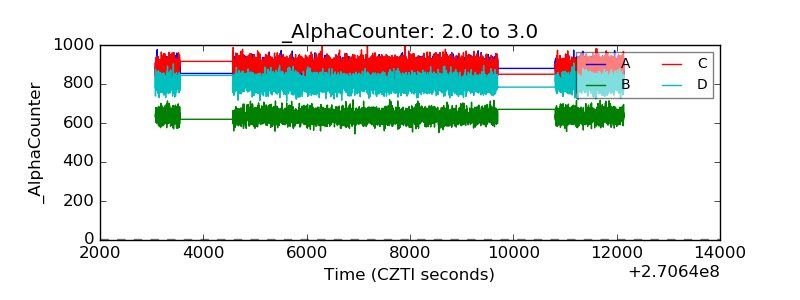 |
| _CPM_Rate | 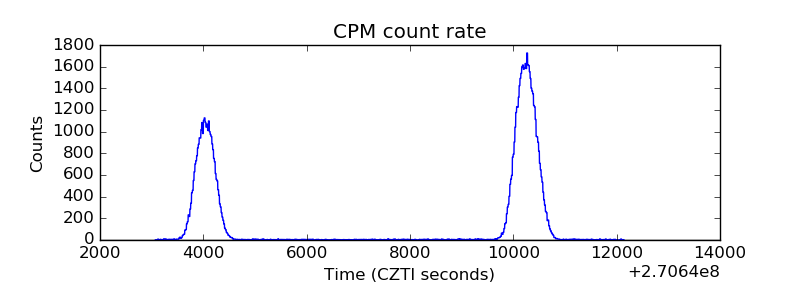 |
| CZT Counter |  |
| +2.5 Volts monitor |  |
| +5 Volts monitor |  |
| _ROLL_ROT |  |
| _Roll_DEC |  |
| _Roll_RA |  |
| Veto Counter |  |