| Param | Original file | Final file |
|---|---|---|
| Filename | modeM0/AS1T02_073T01_9000002260_15341cztM0_level2.evt | modeM0/AS1T02_073T01_9000002260_15341cztM0_level2_quad_clean.evt |
| Size (bytes) | 485,424,000 | 100,033,920 |
| Size | 462.9 MB | 95.4 MB |
| Events in quadrant A | 3,435,097 | 650,792 |
| Events in quadrant B | 3,663,031 | 657,636 |
| Events in quadrant C | 3,606,315 | 642,880 |
| Events in quadrant D | 3,549,008 | 618,721 |
| Mode SS | |||
|---|---|---|---|
| Quadrant | BADHDUFLAG | Total packets | Discarded packets |
| A | 0 | 136 | 0 |
| B | 0 | 136 | 0 |
| C | 0 | 136 | 0 |
| D | 0 | 136 | 0 |
| Mode M0 | |||
|---|---|---|---|
| Quadrant | BADHDUFLAG | Total packets | Discarded packets |
| A | 0 | 14534 | 3 |
| B | 0 | 15127 | 2 |
| C | 0 | 14829 | 2 |
| D | 0 | 14848 | 2 |
| Mode M9 | |||
|---|---|---|---|
| Quadrant | BADHDUFLAG | Total packets | Discarded packets |
| A | 0 | 24 | 0 |
| B | 0 | 24 | 0 |
| C | 0 | 24 | 0 |
| D | 0 | 24 | 0 |
| Quadrant | Total seconds | Saturated seconds | Saturation percentage |
|---|---|---|---|
| A | 6589 | 156 | 2.367582% |
| B | 6589 | 159 | 2.413113% |
| C | 6589 | 134 | 2.033693% |
| D | 6589 | 141 | 2.139930% |
Noise dominated data is calculated using 1-second bins in cleaned event files. If a bin has >2000 counts, and if more than 50% of those come from <1% of pixels, then it is considered to be noise-dominated and hence unusable.
| Quadrant | # 1 sec bins | Bins with >0 counts | Bins with >2000 counts | High rate bins dominated by noise | Noise dominated (total time) | Noise dominated (detector-on time) | Marked lightcurve |
|---|---|---|---|---|---|---|---|
| A | 8950 | 6590 | 1 | 1 | 0.01% | 0.02% | 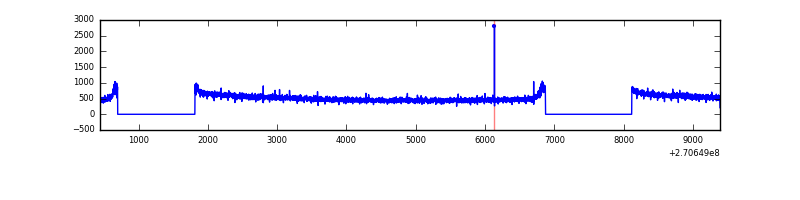 |
| B | 8950 | 6590 | 1 | 1 | 0.01% | 0.02% | 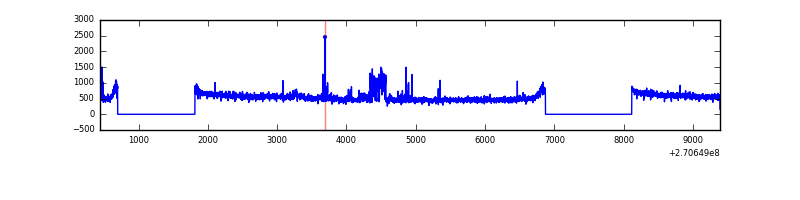 |
| C | 8950 | 6590 | 0 | 0 | 0.00% | 0.00% | 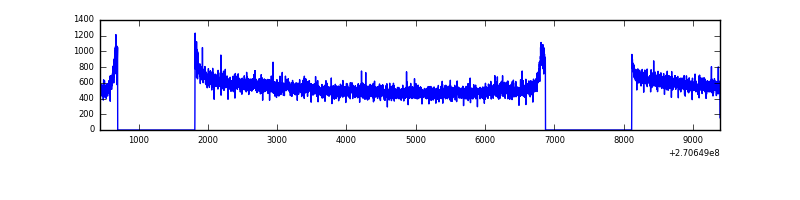 |
| D | 8950 | 6590 | 4 | 4 | 0.04% | 0.06% | 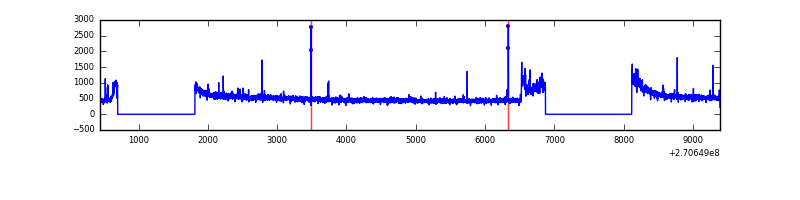 |
Top three noisy pixels from each quadrant. If the there are fewer than three noisy pixels in the level2.evt file, extra rows are filled as -1
| Pixel properties | Quadrant properties | ||||||
|---|---|---|---|---|---|---|---|
| Quadrant | DetID | PixID | Counts | Sigma | Mean | Median | Sigma |
| A | 0 | 226 | 8014 | 39.72 | 892 | 876 | 179.7 |
| A | 12 | 194 | 6732 | 32.59 | 892 | 876 | 179.7 |
| A | 3 | 137 | 5941 | 28.18 | 892 | 876 | 179.7 |
| B | 10 | 245 | 170594 | 1023.25 | 882 | 863 | 165.9 |
| B | 3 | 64 | 26717 | 155.87 | 882 | 863 | 165.9 |
| B | 12 | 111 | 19571 | 112.78 | 882 | 863 | 165.9 |
| C | 3 | 233 | 199788 | 1000.99 | 873 | 878 | 198.7 |
| C | 13 | 61 | 6143 | 26.5 | 873 | 878 | 198.7 |
| C | 7 | 247 | 4311 | 17.28 | 873 | 878 | 198.7 |
| D | 1 | 255 | 179057 | 848.18 | 872 | 849 | 210.1 |
| D | 2 | 234 | 22604 | 103.54 | 872 | 849 | 210.1 |
| D | 13 | 104 | 18633 | 84.64 | 872 | 849 | 210.1 |
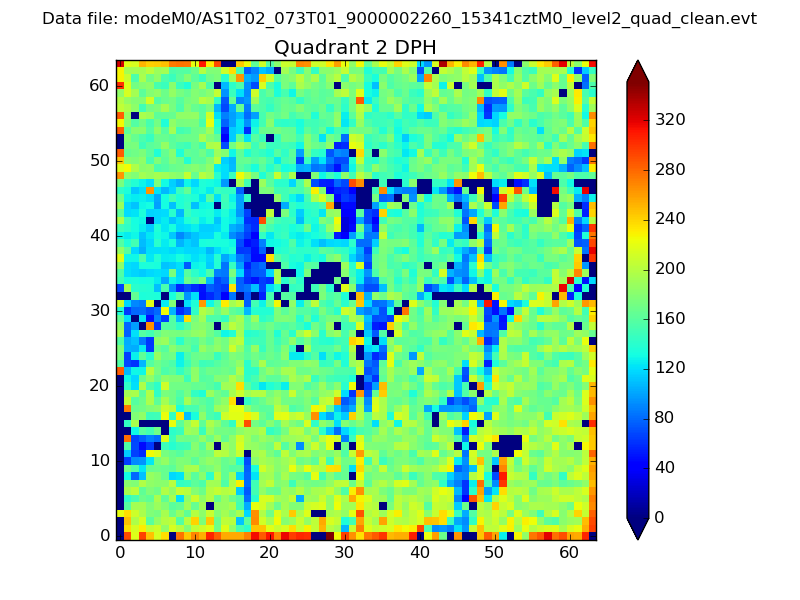
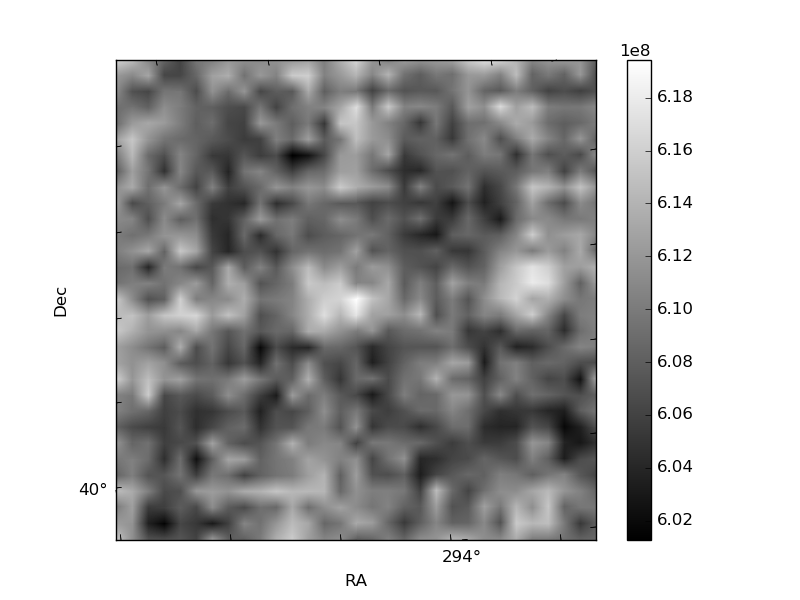
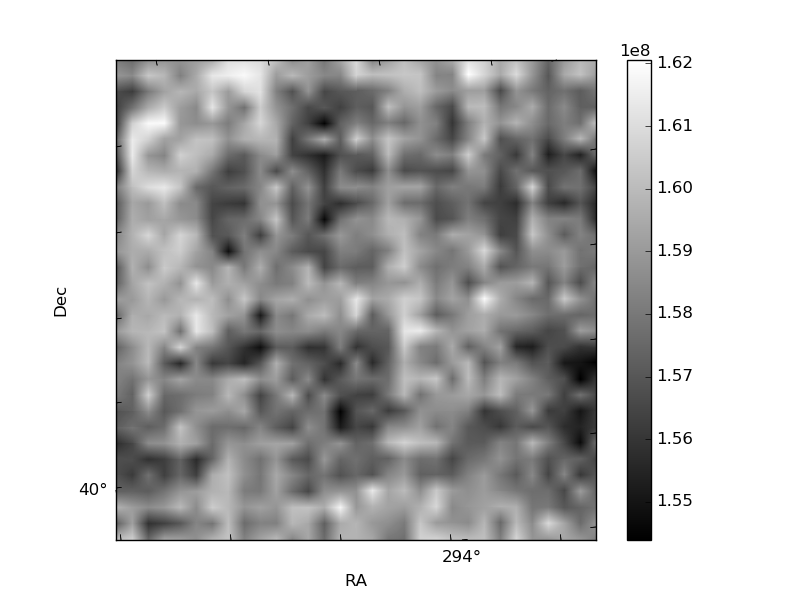
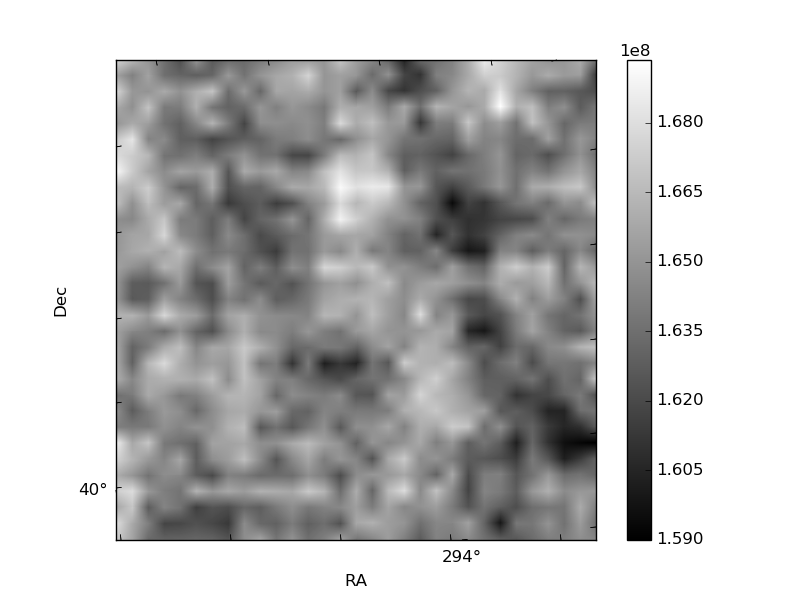
Histogram calculated using DETX and DETY for each event in the final _common_clean file
| Quadrant A | 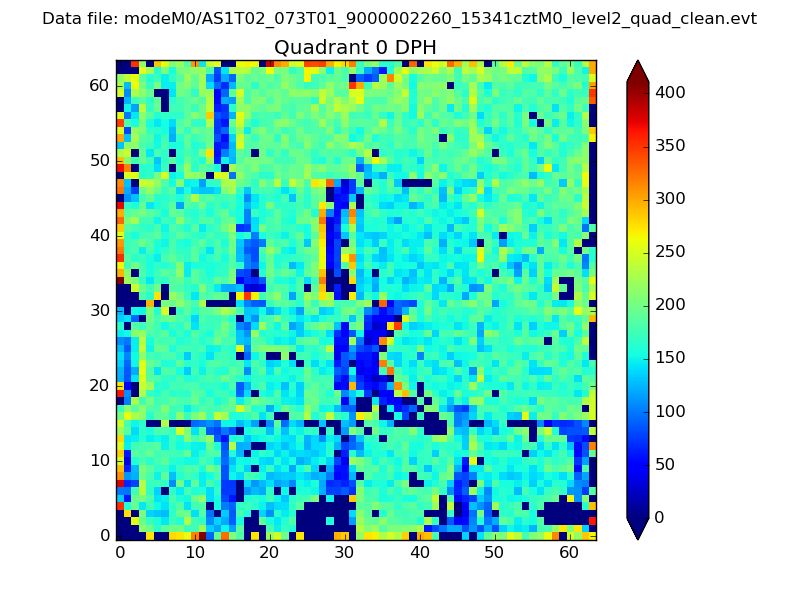 |
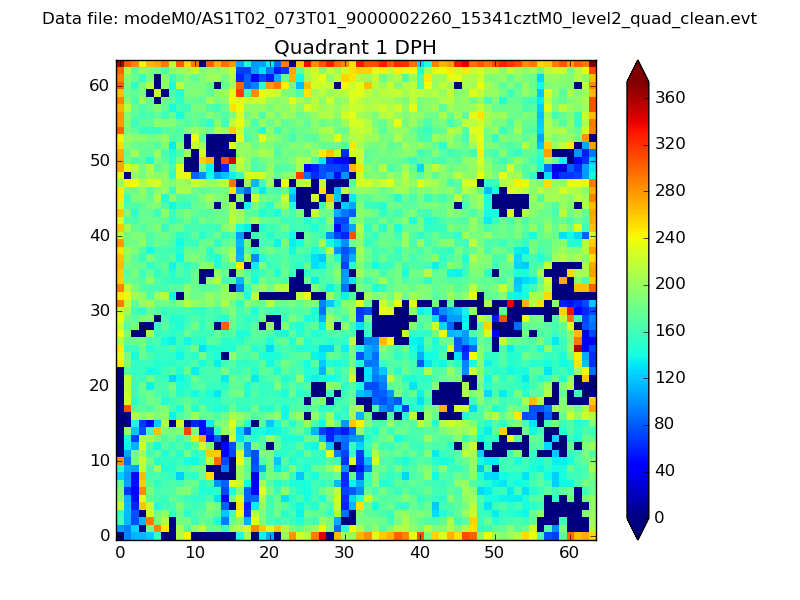 |
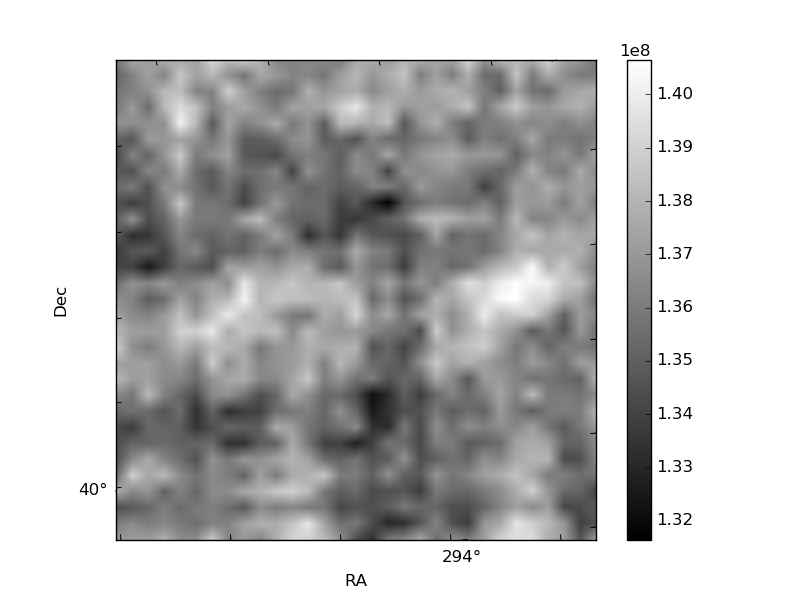
Quadrant B |
|---|---|---|---|
| Quadrant D | 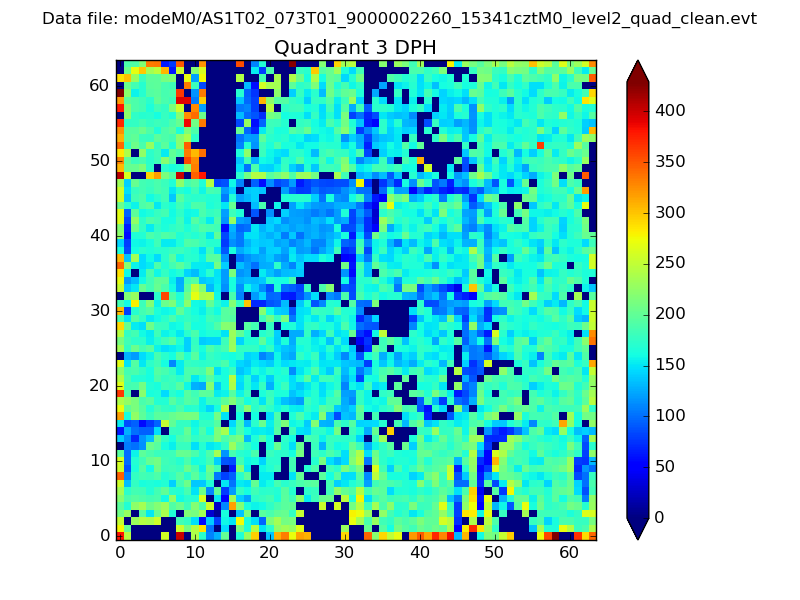 |
 |
Quadrant C |
| Plot type | Count rate plots | Images |
|---|---|---|
| Comparison with Poisson distribution Blue bars denote a histogram of data divided into 1 sec bins. Red curve is a Poisson curve with rate = median count rate of data. |
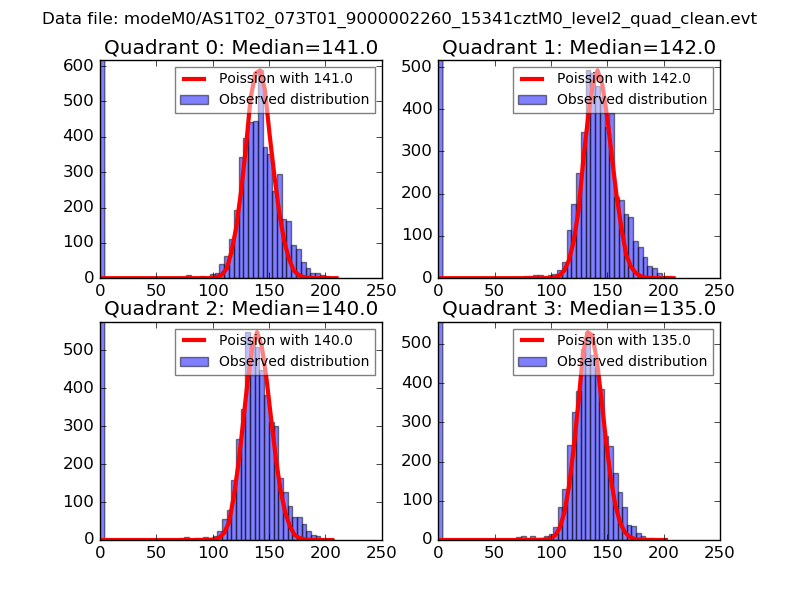 |
 |
| Quadrant-wise count rates Data is divided into 100 sec bins |
 |
|
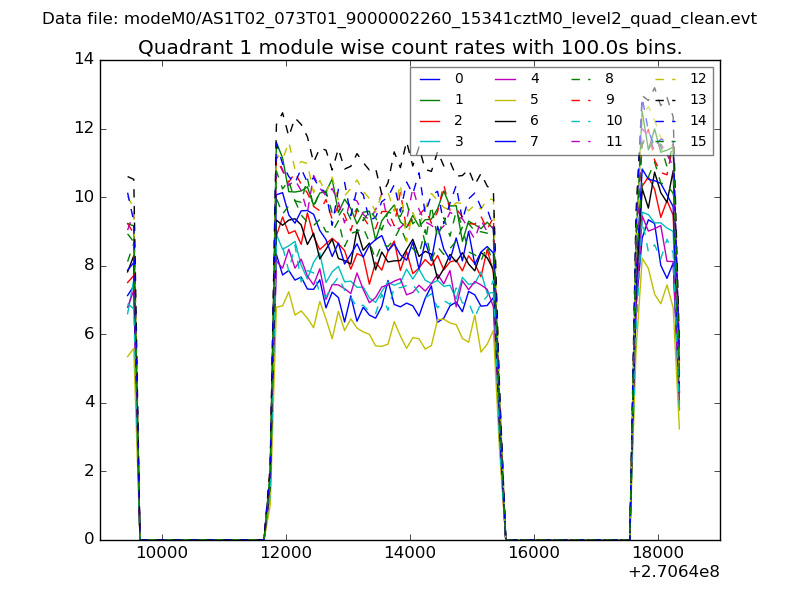
| Module-wise count rates for Quadrant A Data is divided into 100 sec bins |
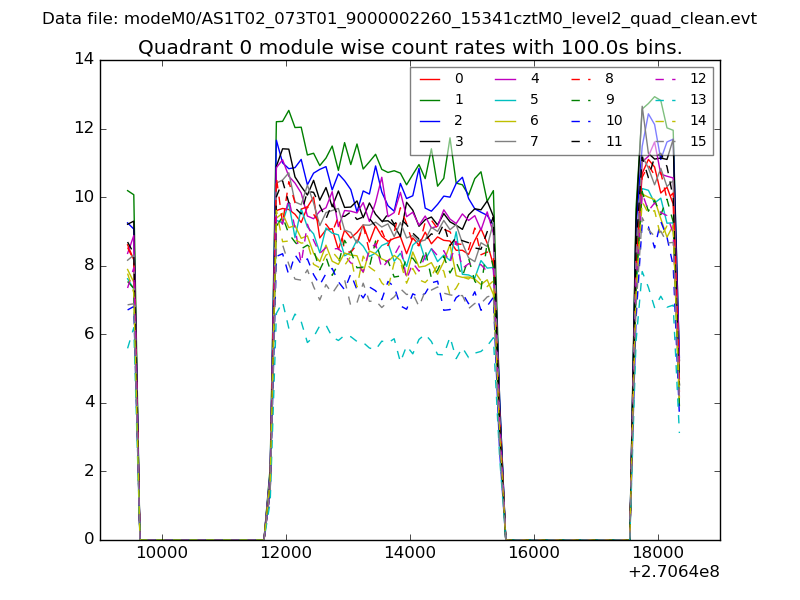 |
 |
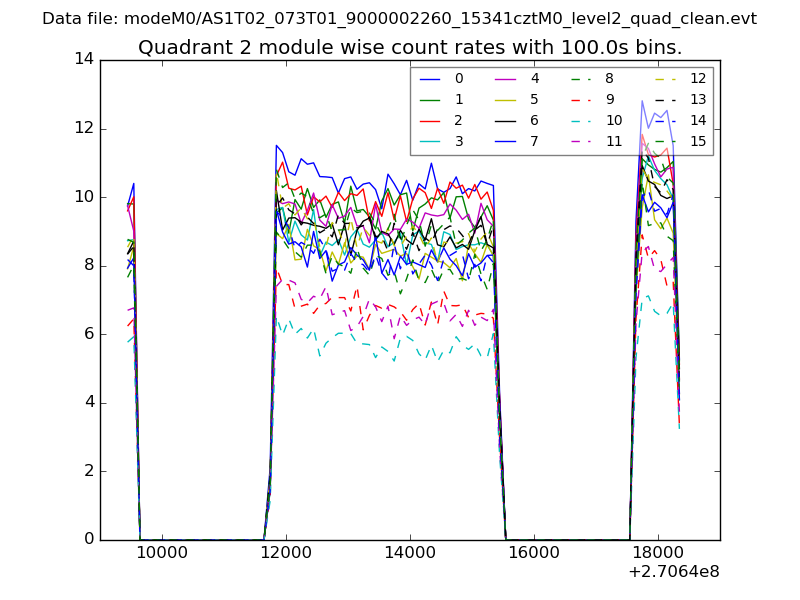
| Module-wise count rates for Quadrant B Data is divided into 100 sec bins |
 |
 |
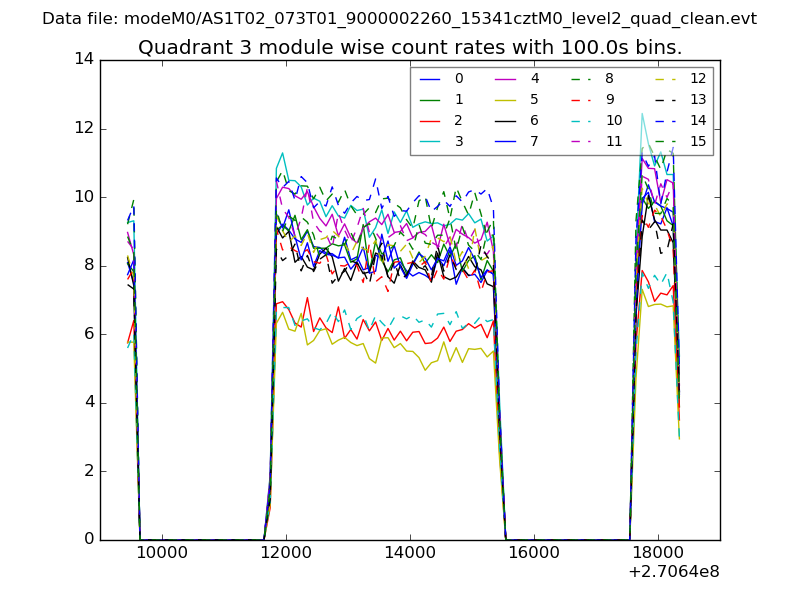
| Module-wise count rates for Quadrant C Data is divided into 100 sec bins |
 |
 |
| Module-wise count rates for Quadrant D Data is divided into 100 sec bins |
 |
 |
| Parameter | Plot |
|---|---|
| CZT HV Monitor | 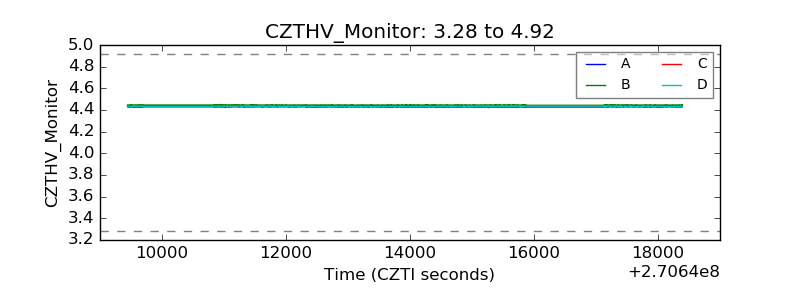 |
| D_VDD | 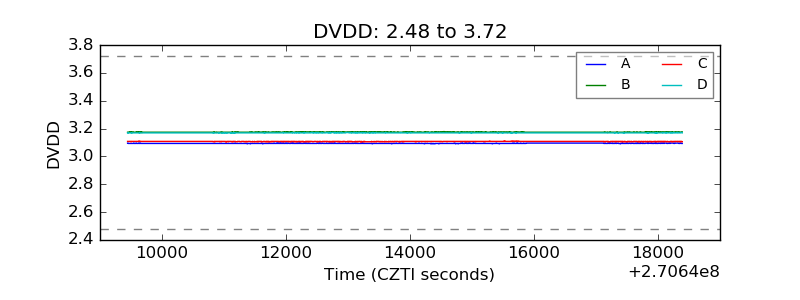 |
| Temperature 1 | 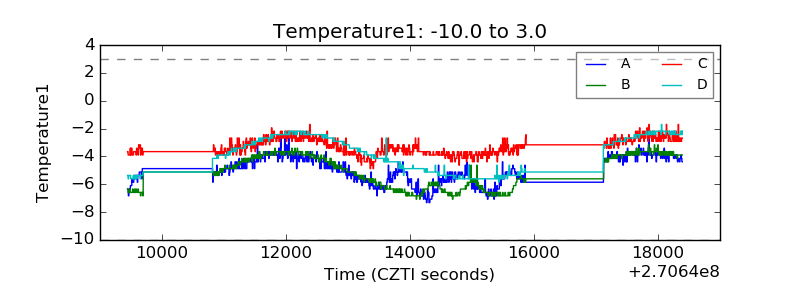 |
| Veto HV Monitor | 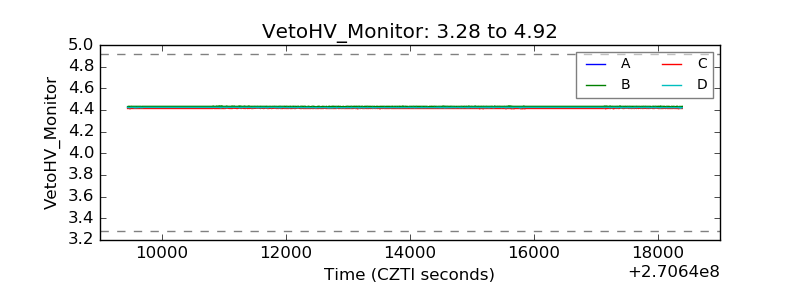 |
| Veto LLD | 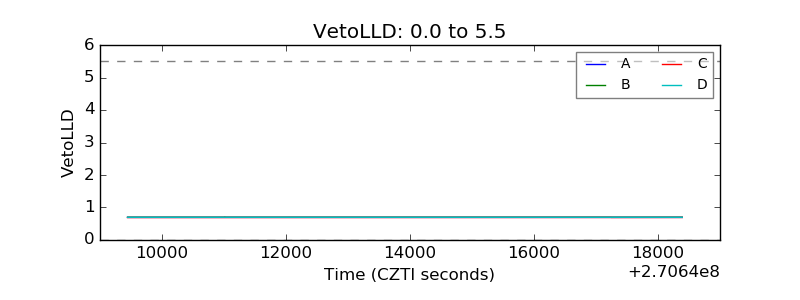 |
| Alpha Counter | 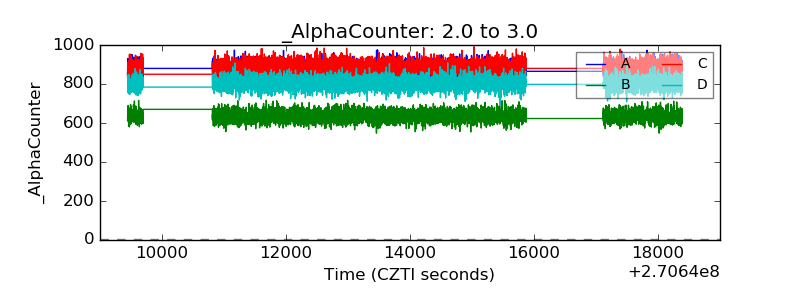 |
| _CPM_Rate | 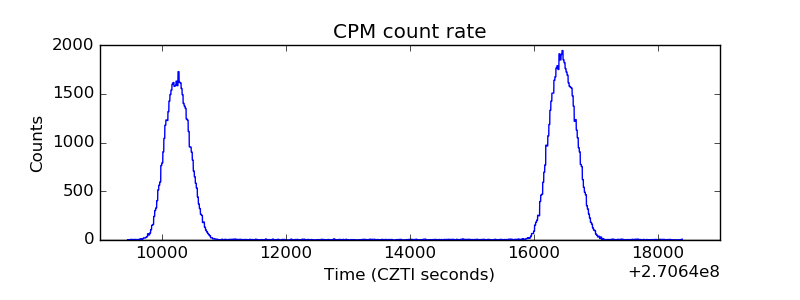 |
| CZT Counter | 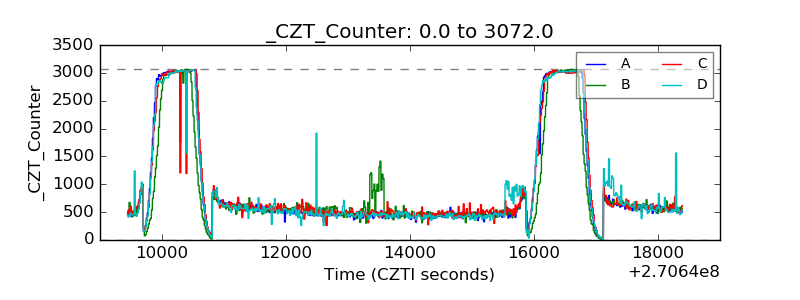 |
| +2.5 Volts monitor |  |
| +5 Volts monitor |  |
| _ROLL_ROT | 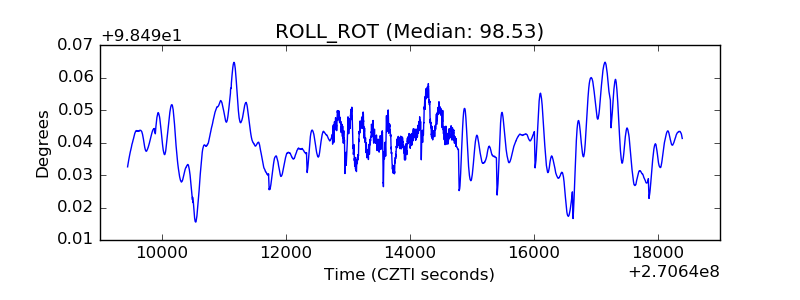 |
| _Roll_DEC | 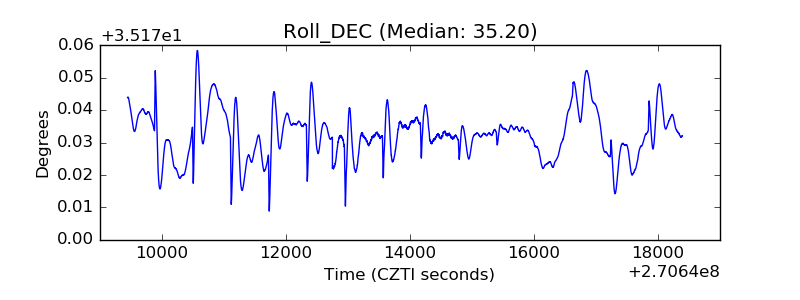 |
| _Roll_RA | 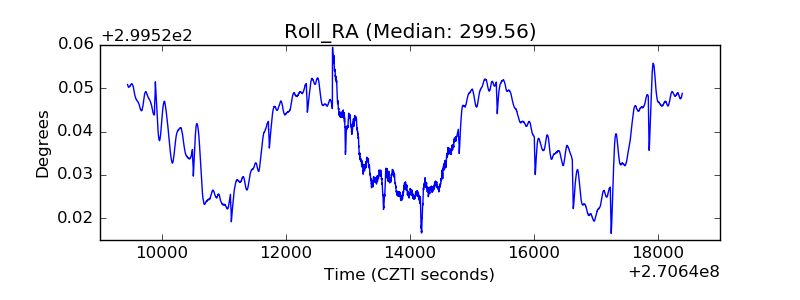 |
| Veto Counter | 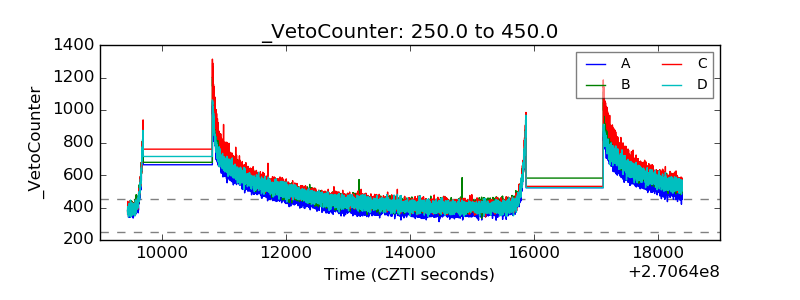 |