| Param | Original file | Final file |
|---|---|---|
| Filename | modeM0/AS1T02_073T01_9000002260_15342cztM0_level2.evt | modeM0/AS1T02_073T01_9000002260_15342cztM0_level2_quad_clean.evt |
| Size (bytes) | 456,410,880 | 109,765,440 |
| Size | 435.3 MB | 104.7 MB |
| Events in quadrant A | 3,281,322 | 725,829 |
| Events in quadrant B | 3,332,197 | 739,557 |
| Events in quadrant C | 3,415,600 | 729,175 |
| Events in quadrant D | 3,367,787 | 692,643 |
| Mode SS | |||
|---|---|---|---|
| Quadrant | BADHDUFLAG | Total packets | Discarded packets |
| A | 0 | 126 | 0 |
| B | 0 | 126 | 0 |
| C | 0 | 126 | 0 |
| D | 0 | 126 | 0 |
| Mode M0 | |||
|---|---|---|---|
| Quadrant | BADHDUFLAG | Total packets | Discarded packets |
| A | 0 | 13826 | 3 |
| B | 0 | 13958 | 2 |
| C | 0 | 14115 | 2 |
| D | 0 | 14079 | 2 |
| Mode M9 | |||
|---|---|---|---|
| Quadrant | BADHDUFLAG | Total packets | Discarded packets |
| A | 0 | 24 | 0 |
| B | 0 | 24 | 0 |
| C | 0 | 24 | 0 |
| D | 0 | 25 | 0 |
| Quadrant | Total seconds | Saturated seconds | Saturation percentage |
|---|---|---|---|
| A | 6270 | 84 | 1.339713% |
| B | 6270 | 87 | 1.387560% |
| C | 6270 | 75 | 1.196172% |
| D | 6270 | 78 | 1.244019% |
Noise dominated data is calculated using 1-second bins in cleaned event files. If a bin has >2000 counts, and if more than 50% of those come from <1% of pixels, then it is considered to be noise-dominated and hence unusable.
| Quadrant | # 1 sec bins | Bins with >0 counts | Bins with >2000 counts | High rate bins dominated by noise | Noise dominated (total time) | Noise dominated (detector-on time) | Marked lightcurve |
|---|---|---|---|---|---|---|---|
| A | 7561 | 6271 | 0 | 0 | 0.00% | 0.00% | 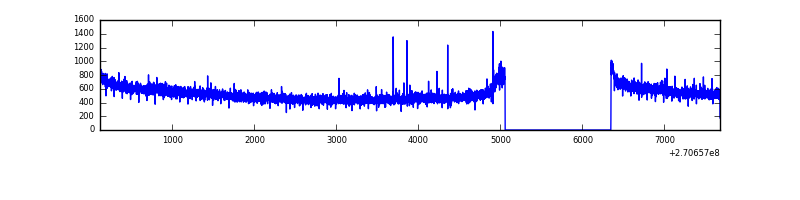 |
| B | 7561 | 6272 | 1 | 1 | 0.01% | 0.02% | 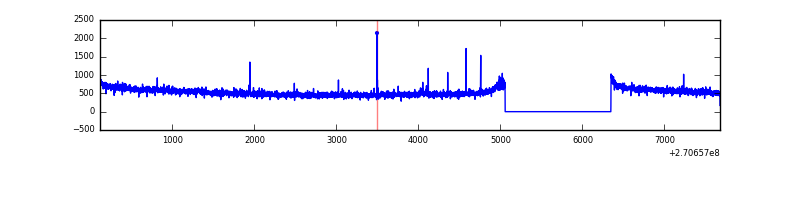 |
| C | 7561 | 6271 | 0 | 0 | 0.00% | 0.00% | 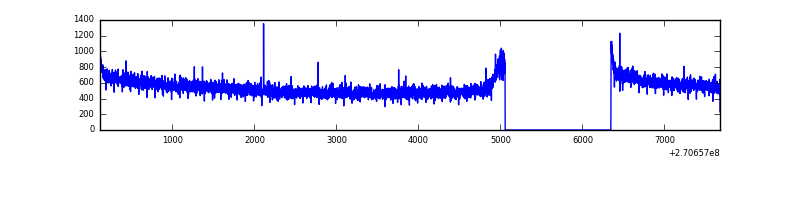 |
| D | 7561 | 6271 | 5 | 5 | 0.07% | 0.08% | 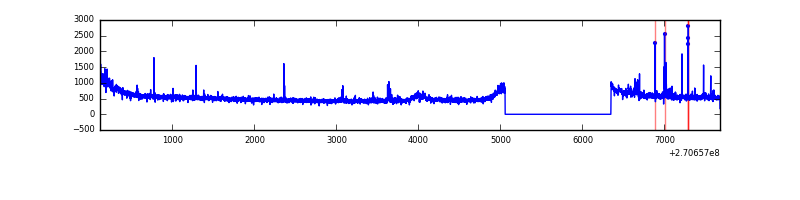 |
Top three noisy pixels from each quadrant. If the there are fewer than three noisy pixels in the level2.evt file, extra rows are filled as -1
| Pixel properties | Quadrant properties | ||||||
|---|---|---|---|---|---|---|---|
| Quadrant | DetID | PixID | Counts | Sigma | Mean | Median | Sigma |
| A | 0 | 226 | 7532 | 39.51 | 851 | 836 | 169.5 |
| A | 4 | 2 | 7525 | 39.47 | 851 | 836 | 169.5 |
| A | 12 | 194 | 6373 | 32.67 | 851 | 836 | 169.5 |
| B | 3 | 64 | 22096 | 134.42 | 844 | 825 | 158.2 |
| B | 12 | 111 | 18368 | 110.86 | 844 | 825 | 158.2 |
| B | 0 | 205 | 16852 | 101.28 | 844 | 825 | 158.2 |
| C | 3 | 233 | 132855 | 692.54 | 838 | 845 | 190.6 |
| C | 7 | 247 | 14436 | 71.3 | 838 | 845 | 190.6 |
| C | 13 | 61 | 5984 | 26.96 | 838 | 845 | 190.6 |
| D | 1 | 255 | 107162 | 526.12 | 837 | 814 | 202.1 |
| D | 10 | 70 | 40186 | 194.78 | 837 | 814 | 202.1 |
| D | 2 | 234 | 22910 | 109.31 | 837 | 814 | 202.1 |
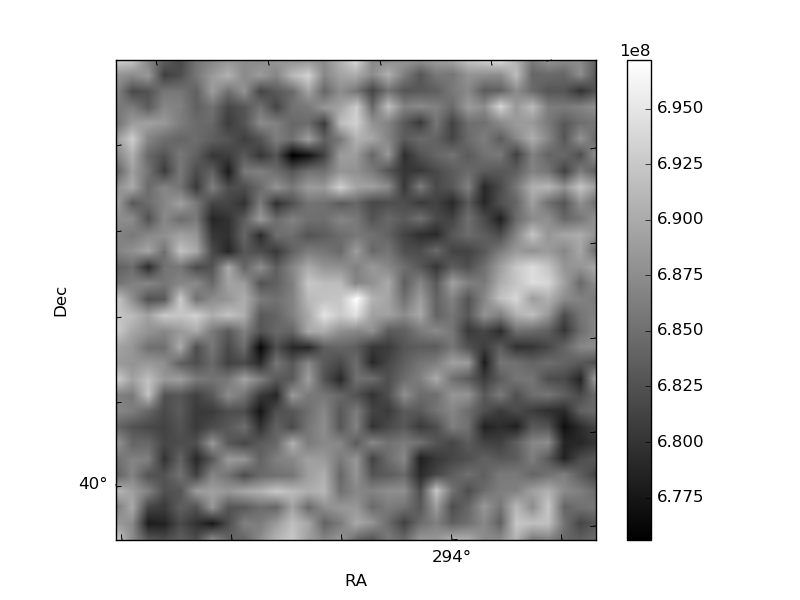
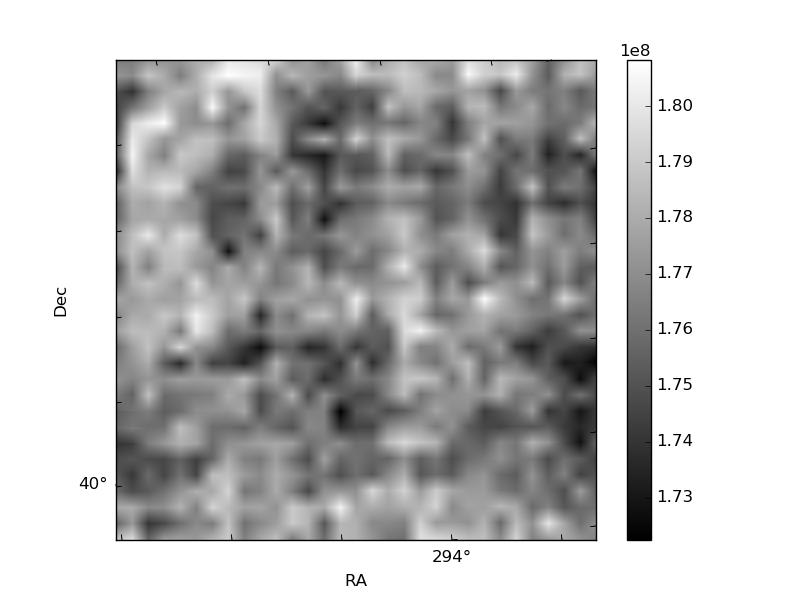
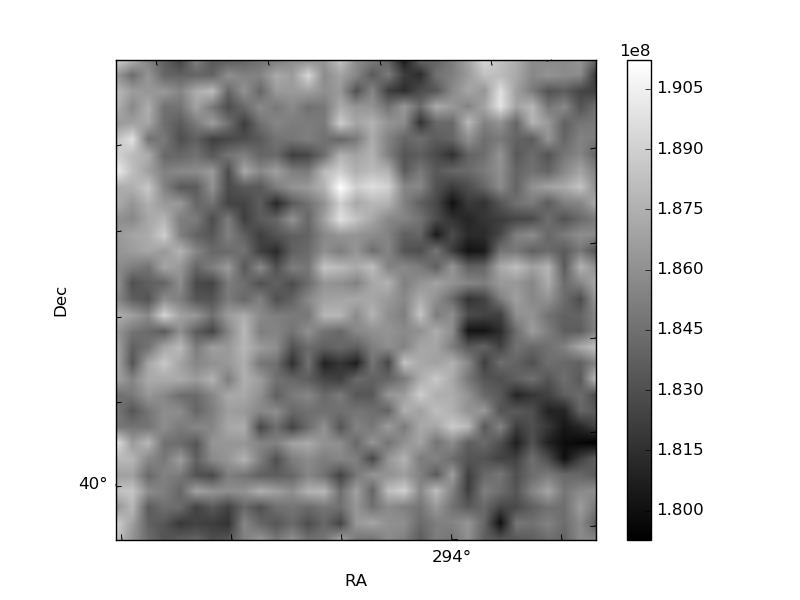
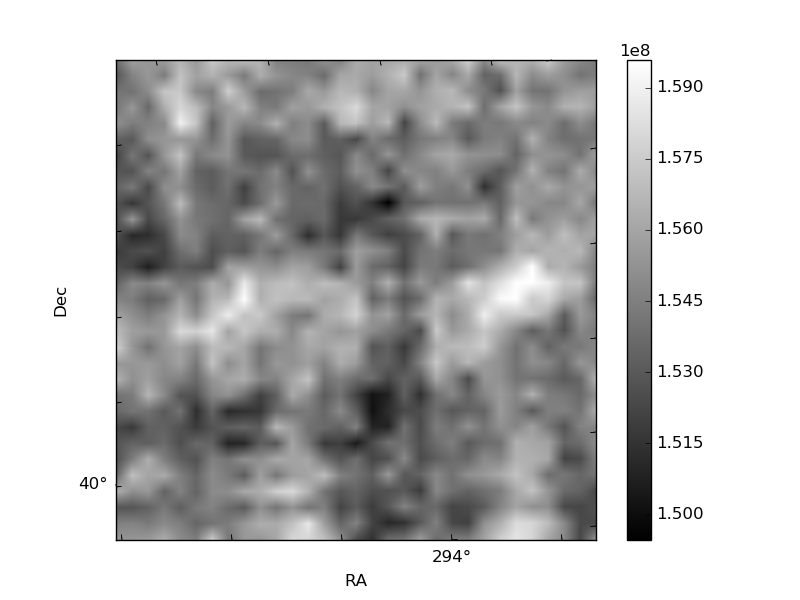
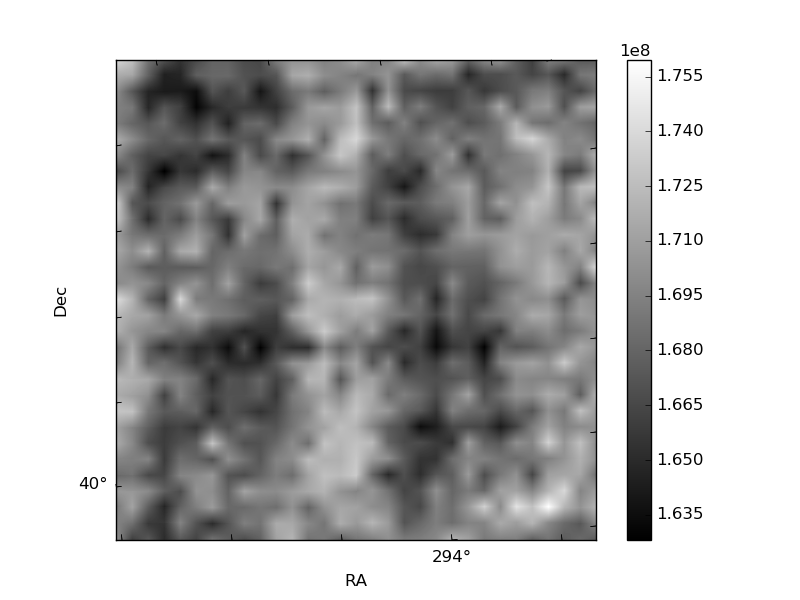
Histogram calculated using DETX and DETY for each event in the final _common_clean file
| Quadrant A | 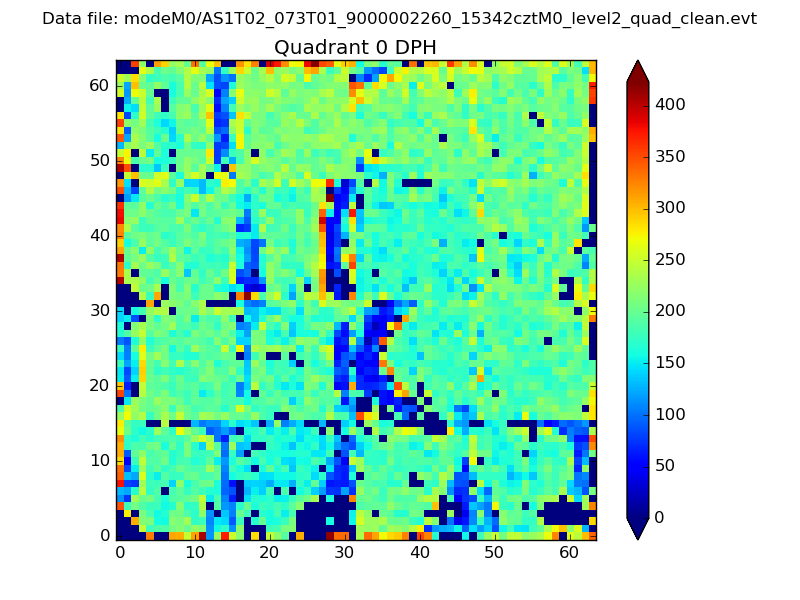 |
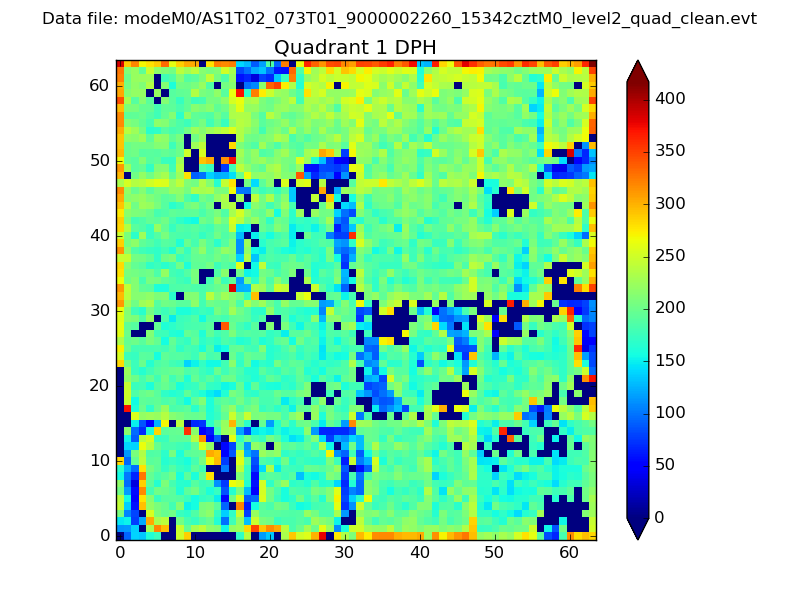 |
Quadrant B |
|---|---|---|---|
| Quadrant D | 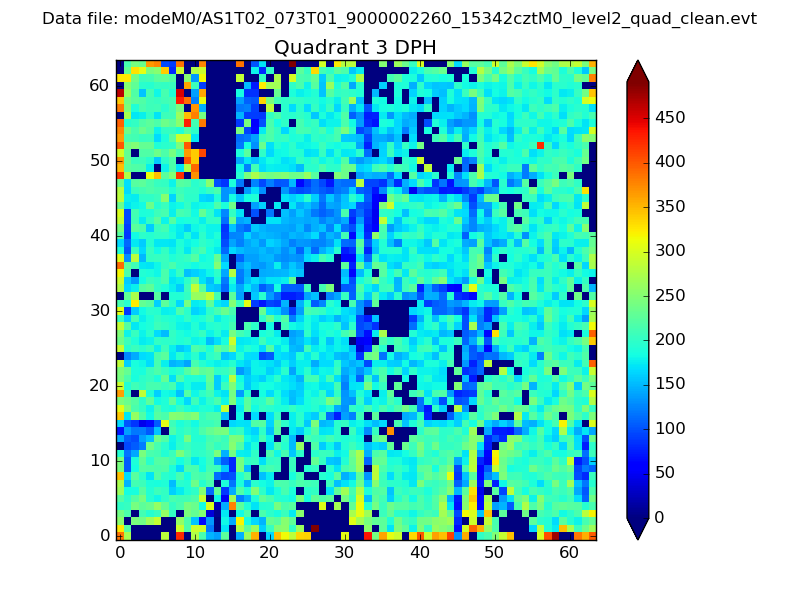 |
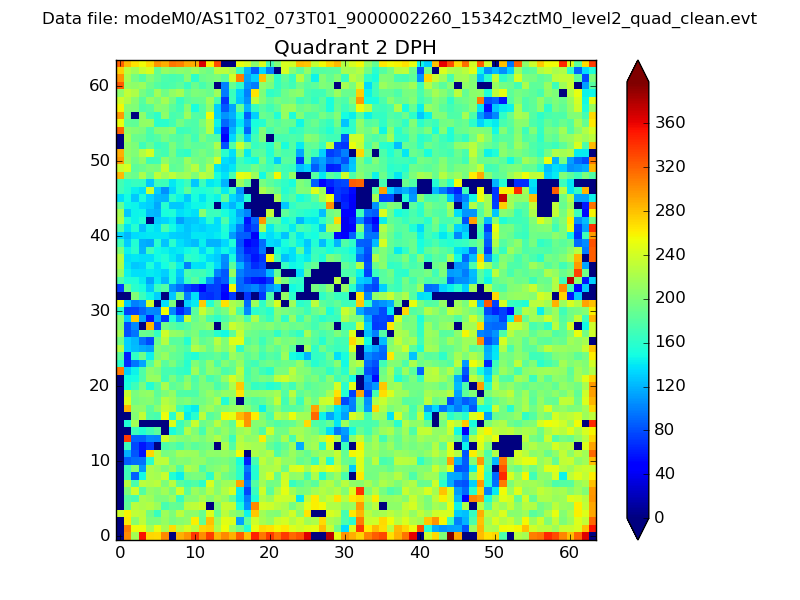 |
Quadrant C |
| Plot type | Count rate plots | Images |
|---|---|---|
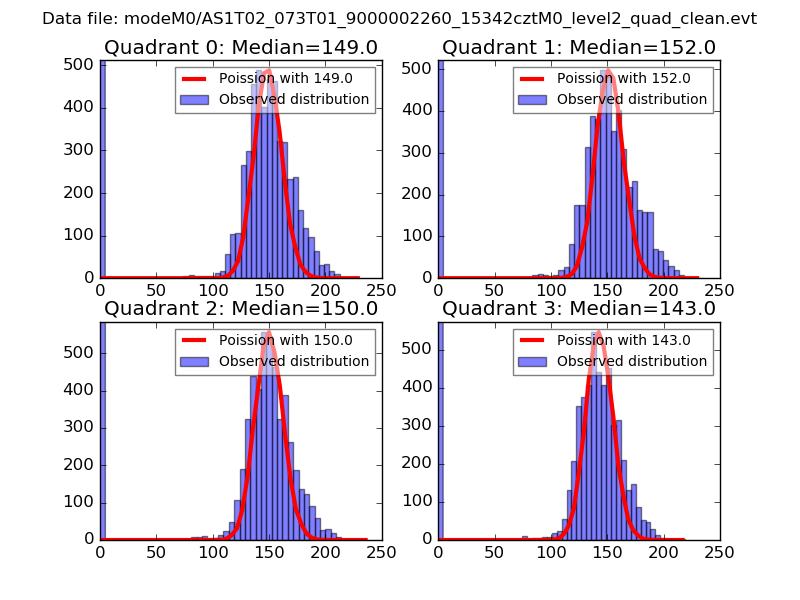
| Comparison with Poisson distribution Blue bars denote a histogram of data divided into 1 sec bins. Red curve is a Poisson curve with rate = median count rate of data. |
 |
 |
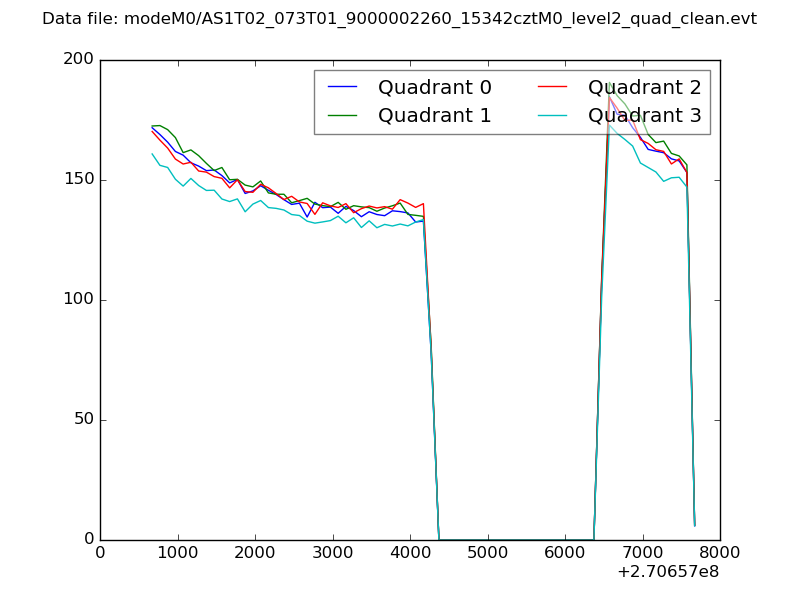
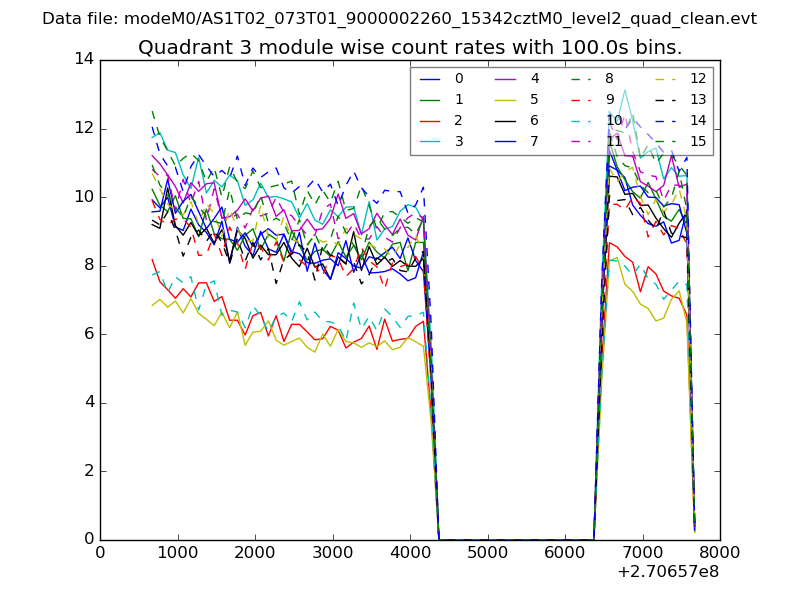
| Quadrant-wise count rates Data is divided into 100 sec bins |
 |
|
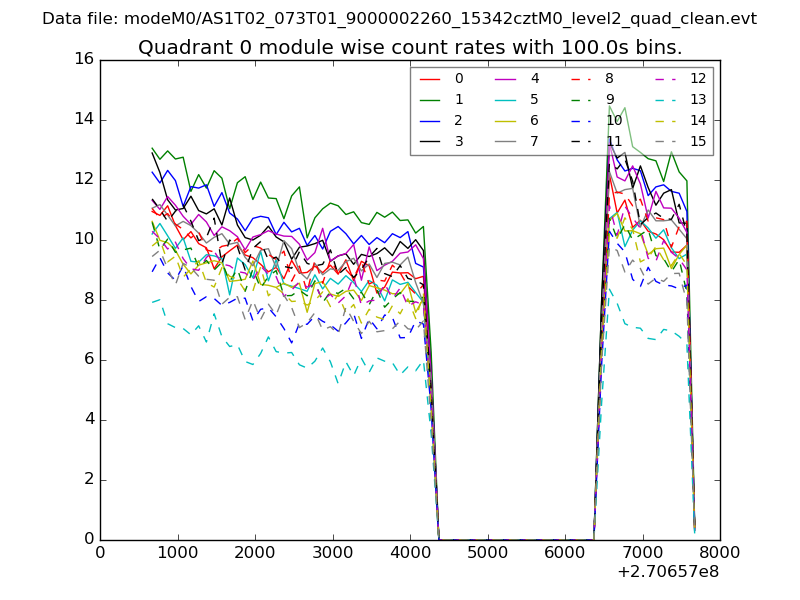
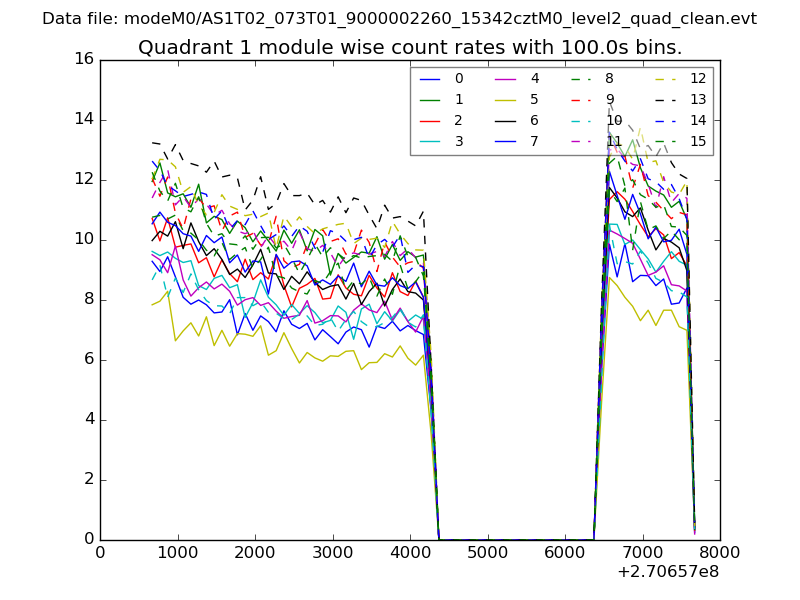
| Module-wise count rates for Quadrant A Data is divided into 100 sec bins |
 |
 |
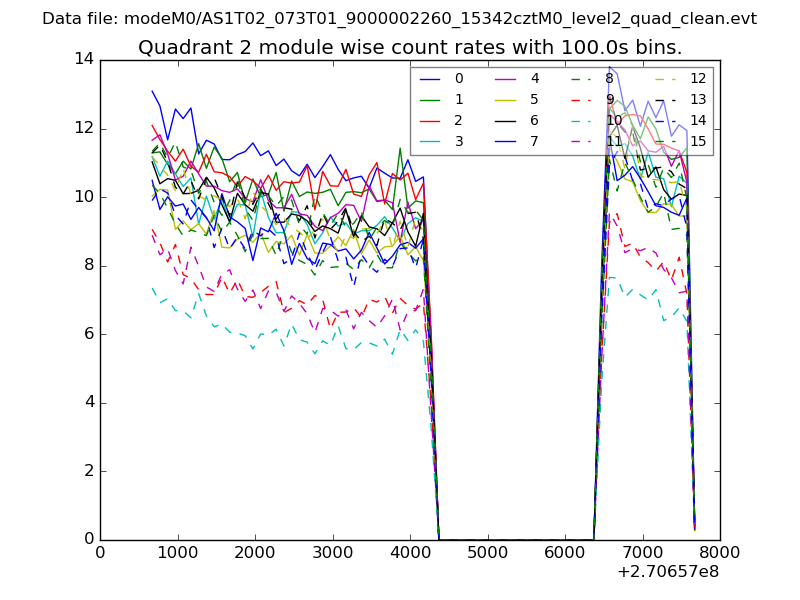
| Module-wise count rates for Quadrant B Data is divided into 100 sec bins |
 |
 |
| Module-wise count rates for Quadrant C Data is divided into 100 sec bins |
 |
 |
| Module-wise count rates for Quadrant D Data is divided into 100 sec bins |
 |
 |
| Parameter | Plot |
|---|---|
| CZT HV Monitor | 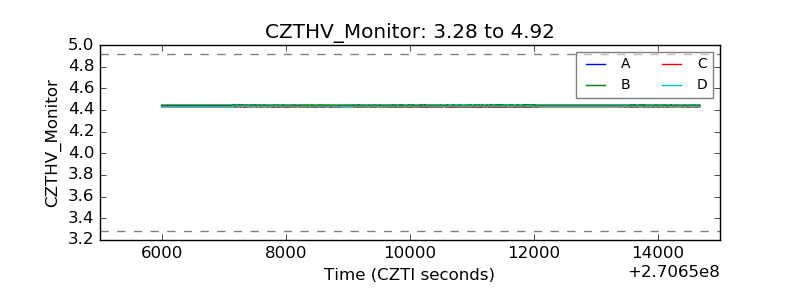 |
| D_VDD | 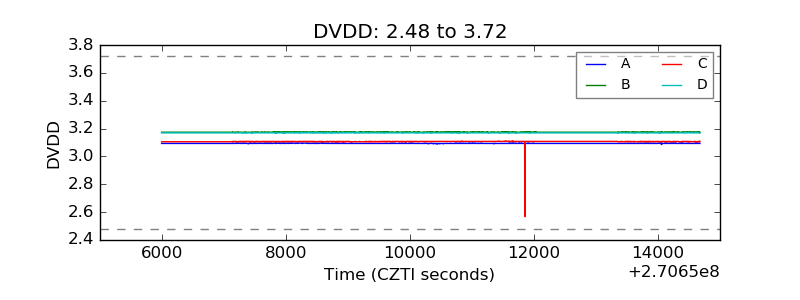 |
| Temperature 1 | 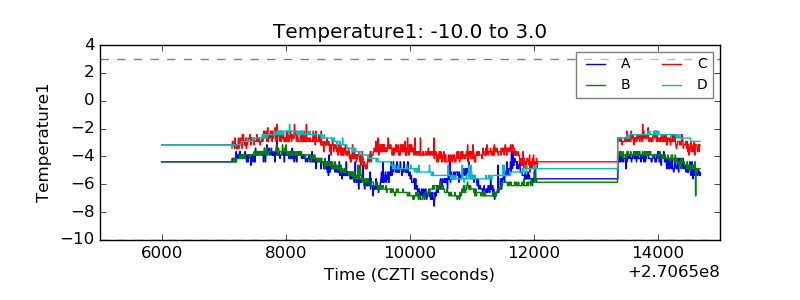 |
| Veto HV Monitor | 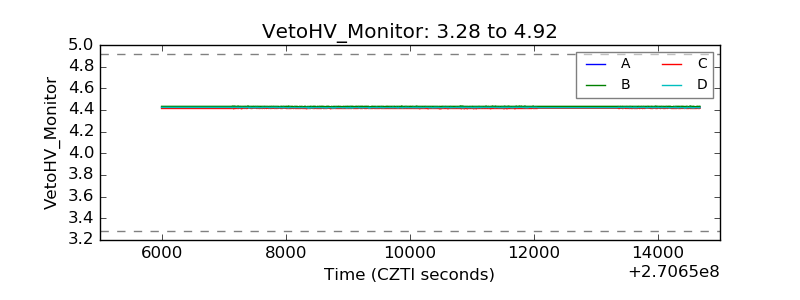 |
| Veto LLD | 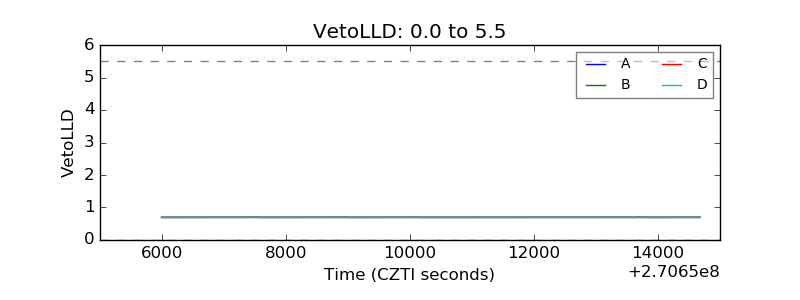 |
| Alpha Counter | 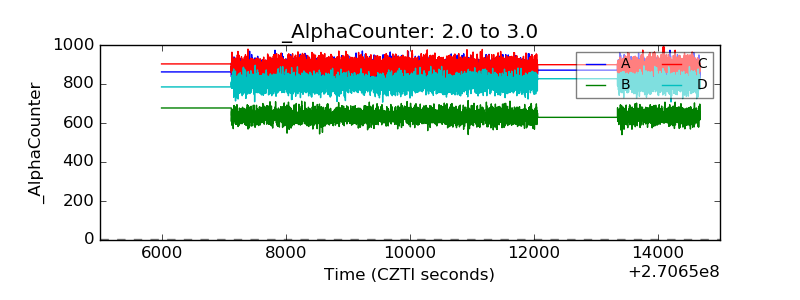 |
| _CPM_Rate | 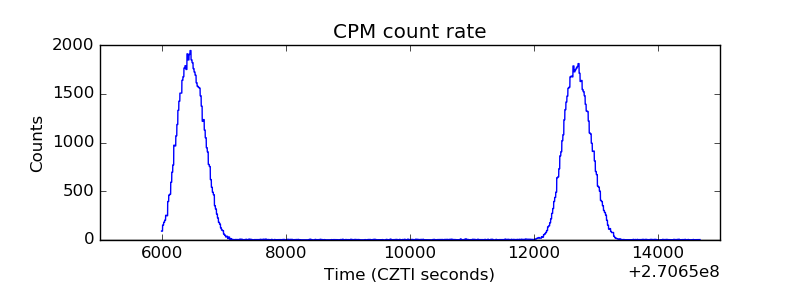 |
| CZT Counter | 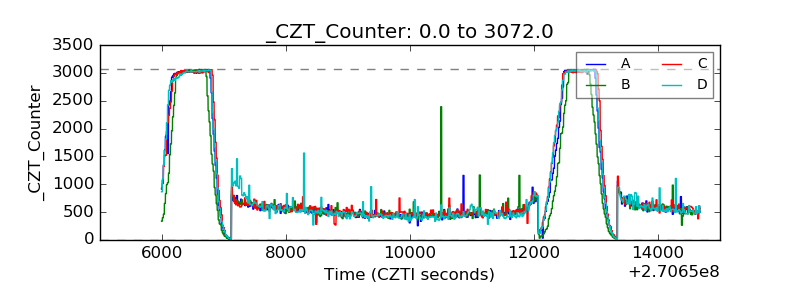 |
| +2.5 Volts monitor | 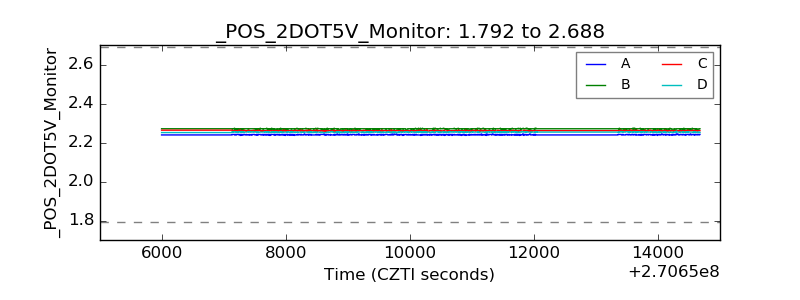 |
| +5 Volts monitor |  |
| _ROLL_ROT | 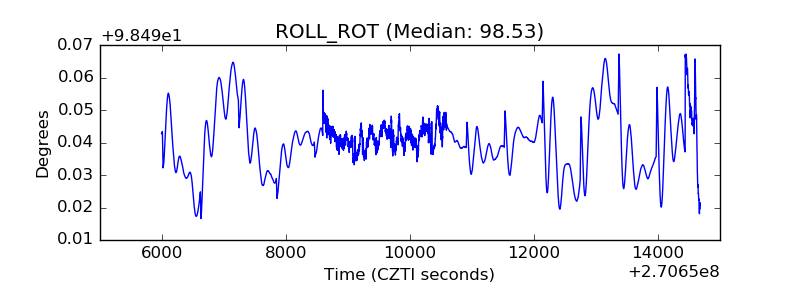 |
| _Roll_DEC | 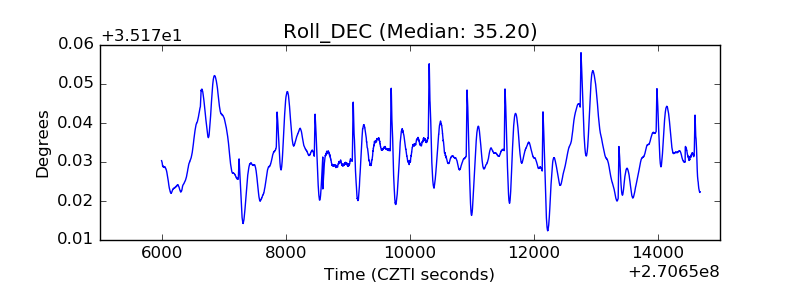 |
| _Roll_RA | 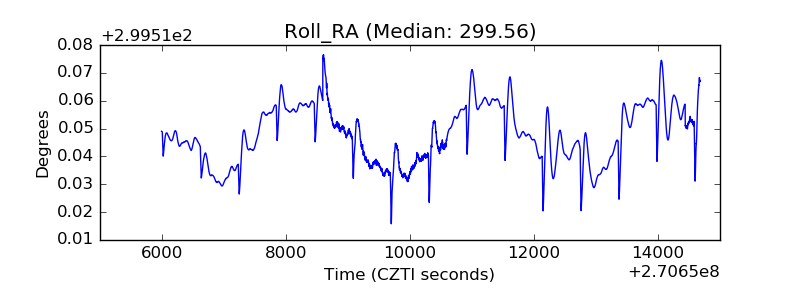 |
| Veto Counter | 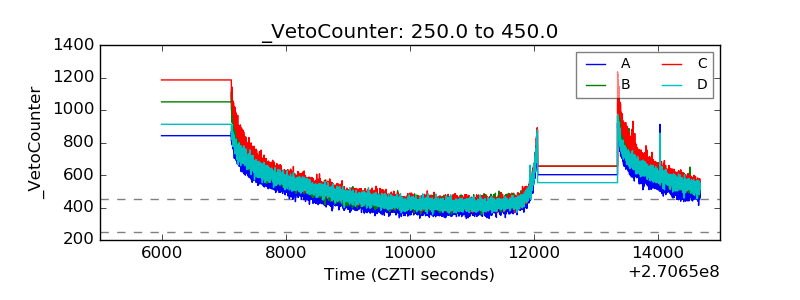 |