| Param | Original file | Final file |
|---|---|---|
| Filename | modeM0/AS1T02_073T01_9000002260_15343cztM0_level2.evt | modeM0/AS1T02_073T01_9000002260_15343cztM0_level2_quad_clean.evt |
| Size (bytes) | 447,439,680 | 111,864,960 |
| Size | 426.7 MB | 106.7 MB |
| Events in quadrant A | 3,047,295 | 747,222 |
| Events in quadrant B | 3,093,754 | 764,550 |
| Events in quadrant C | 3,232,962 | 754,739 |
| Events in quadrant D | 3,765,553 | 698,763 |
| Mode SS | |||
|---|---|---|---|
| Quadrant | BADHDUFLAG | Total packets | Discarded packets |
| A | 0 | 122 | 0 |
| B | 0 | 122 | 0 |
| C | 0 | 122 | 0 |
| D | 0 | 122 | 0 |
| Mode M0 | |||
|---|---|---|---|
| Quadrant | BADHDUFLAG | Total packets | Discarded packets |
| A | 0 | 12911 | 2 |
| B | 0 | 12981 | 1 |
| C | 0 | 13312 | 1 |
| D | 0 | 15394 | 1 |
| Mode M9 | |||
|---|---|---|---|
| Quadrant | BADHDUFLAG | Total packets | Discarded packets |
| A | 0 | 14 | 0 |
| B | 0 | 14 | 0 |
| C | 0 | 14 | 0 |
| D | 0 | 14 | 0 |
| Quadrant | Total seconds | Saturated seconds | Saturation percentage |
|---|---|---|---|
| A | 6057 | 35 | 0.577844% |
| B | 6057 | 41 | 0.676903% |
| C | 6057 | 25 | 0.412746% |
| D | 6057 | 235 | 3.879808% |
Noise dominated data is calculated using 1-second bins in cleaned event files. If a bin has >2000 counts, and if more than 50% of those come from <1% of pixels, then it is considered to be noise-dominated and hence unusable.
| Quadrant | # 1 sec bins | Bins with >0 counts | Bins with >2000 counts | High rate bins dominated by noise | Noise dominated (total time) | Noise dominated (detector-on time) | Marked lightcurve |
|---|---|---|---|---|---|---|---|
| A | 7428 | 6059 | 3 | 3 | 0.04% | 0.05% | 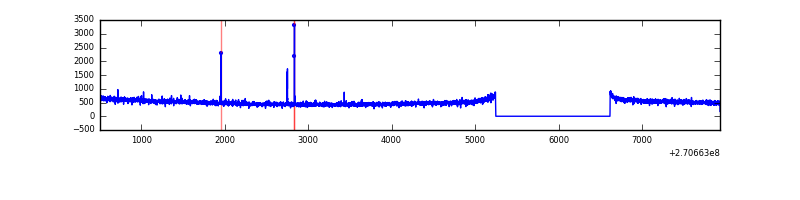 |
| B | 7428 | 6059 | 0 | 0 | 0.00% | 0.00% | 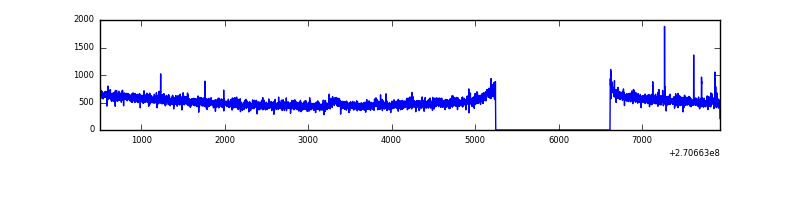 |
| C | 7428 | 6059 | 0 | 0 | 0.00% | 0.00% |  |
| D | 7428 | 6059 | 191 | 191 | 2.57% | 3.15% | 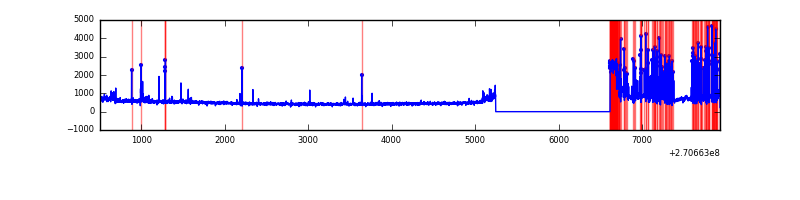 |
Top three noisy pixels from each quadrant. If the there are fewer than three noisy pixels in the level2.evt file, extra rows are filled as -1
| Pixel properties | Quadrant properties | ||||||
|---|---|---|---|---|---|---|---|
| Quadrant | DetID | PixID | Counts | Sigma | Mean | Median | Sigma |
| A | 9 | 143 | 19552 | 119.04 | 788 | 774 | 157.7 |
| A | 0 | 226 | 6955 | 39.18 | 788 | 774 | 157.7 |
| A | 12 | 194 | 6037 | 33.37 | 788 | 774 | 157.7 |
| B | 12 | 111 | 17095 | 110.44 | 786 | 767 | 147.8 |
| B | 11 | 111 | 14667 | 94.02 | 786 | 767 | 147.8 |
| B | 14 | 111 | 12788 | 81.31 | 786 | 767 | 147.8 |
| C | 3 | 233 | 174908 | 973.91 | 781 | 789 | 178.8 |
| C | 7 | 247 | 13179 | 69.3 | 781 | 789 | 178.8 |
| C | 13 | 61 | 5444 | 26.04 | 781 | 789 | 178.8 |
| D | 1 | 255 | 777599 | 4290.78 | 760 | 742 | 181.1 |
| D | 10 | 70 | 53208 | 289.78 | 760 | 742 | 181.1 |
| D | 2 | 234 | 23041 | 123.16 | 760 | 742 | 181.1 |
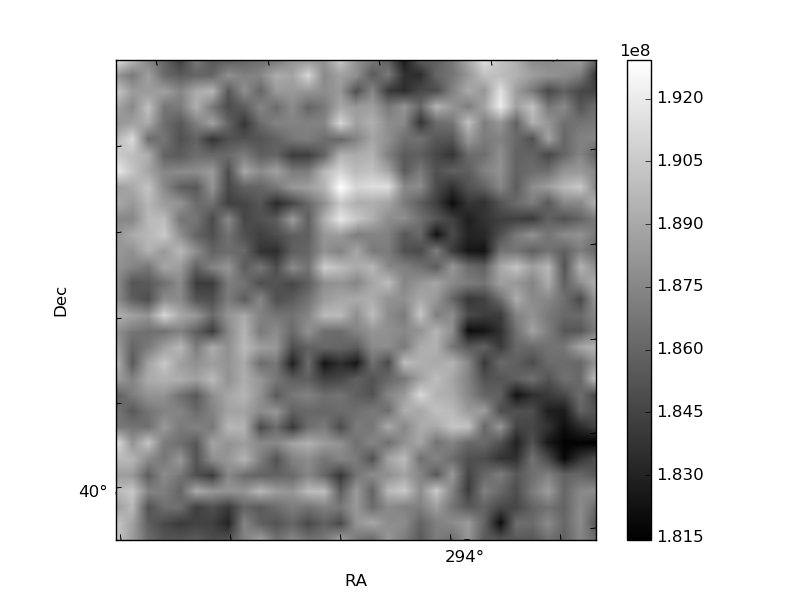
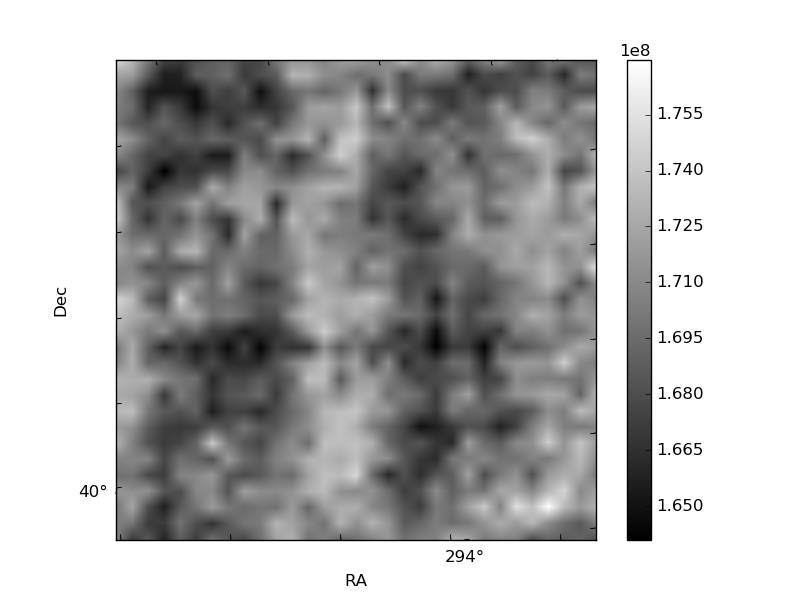
Histogram calculated using DETX and DETY for each event in the final _common_clean file
| Quadrant A |  |
 |
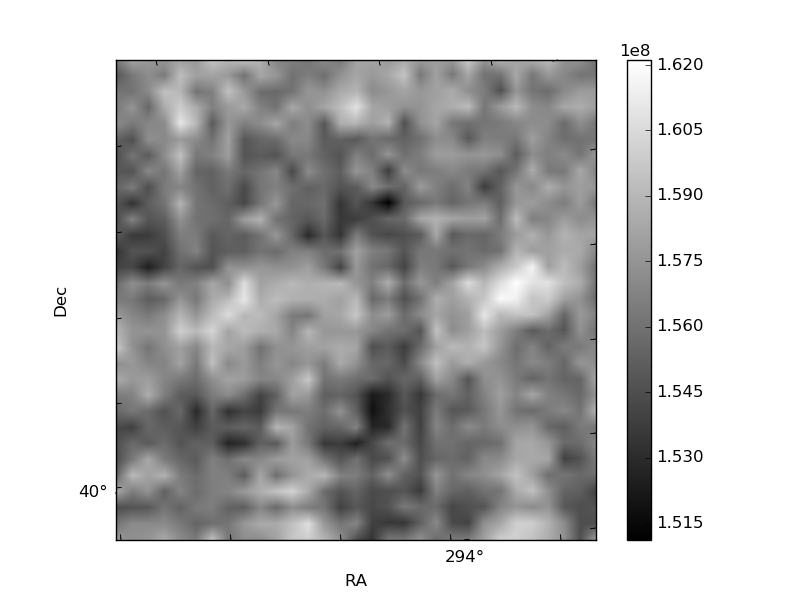
Quadrant B |
|---|---|---|---|
| Quadrant D | 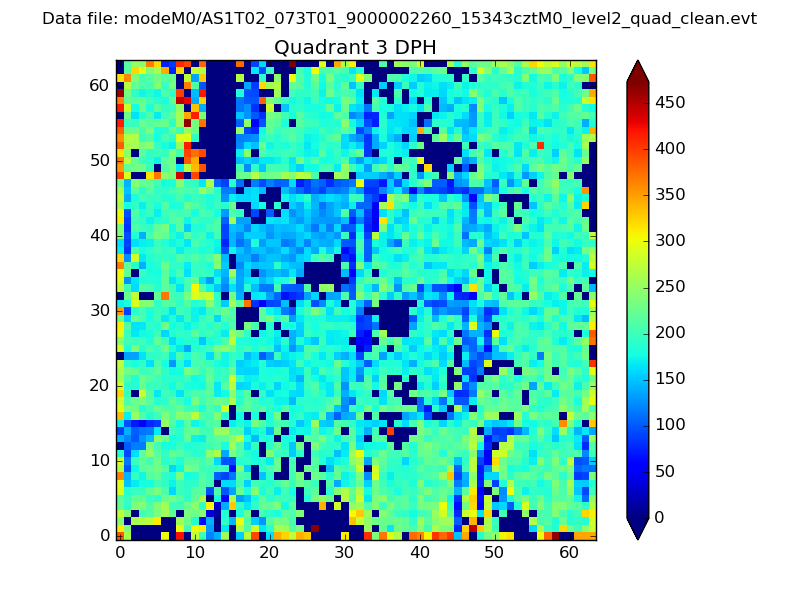 |
 |
Quadrant C |
| Plot type | Count rate plots | Images |
|---|---|---|
| Comparison with Poisson distribution Blue bars denote a histogram of data divided into 1 sec bins. Red curve is a Poisson curve with rate = median count rate of data. |
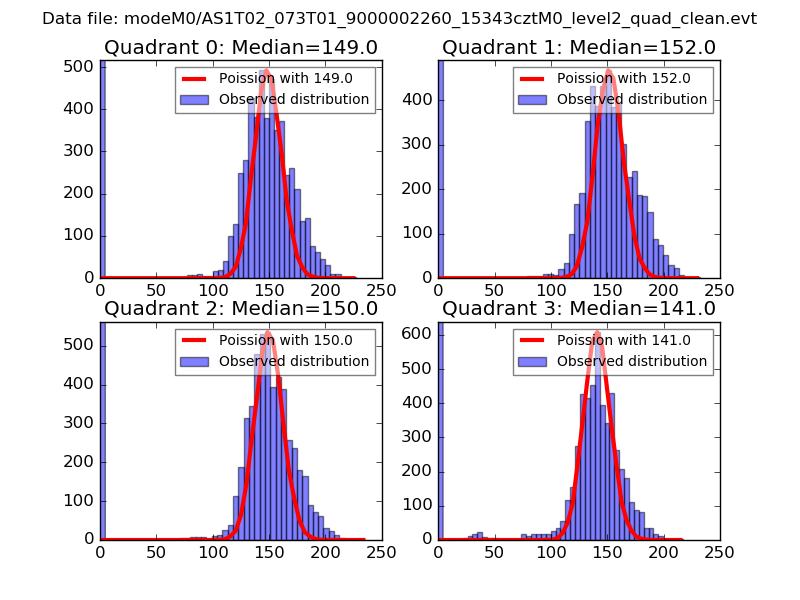 |
 |
| Quadrant-wise count rates Data is divided into 100 sec bins |
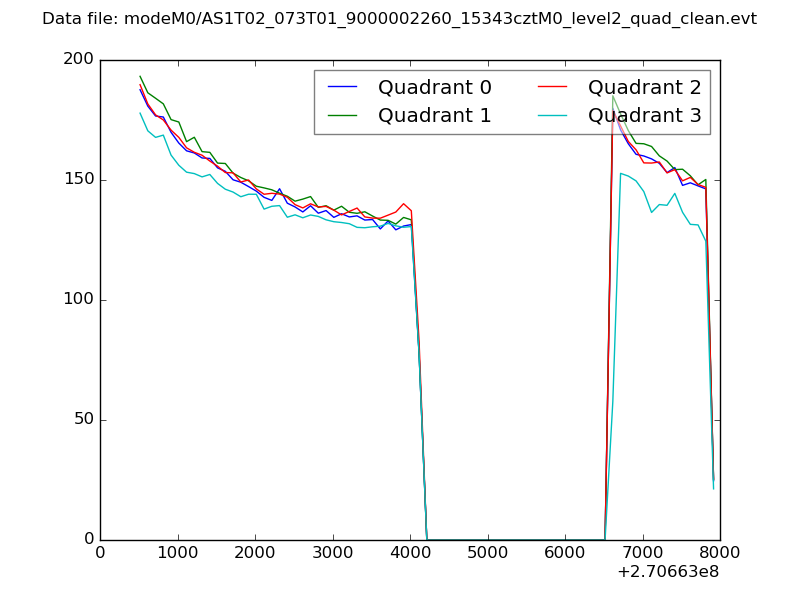 |
|
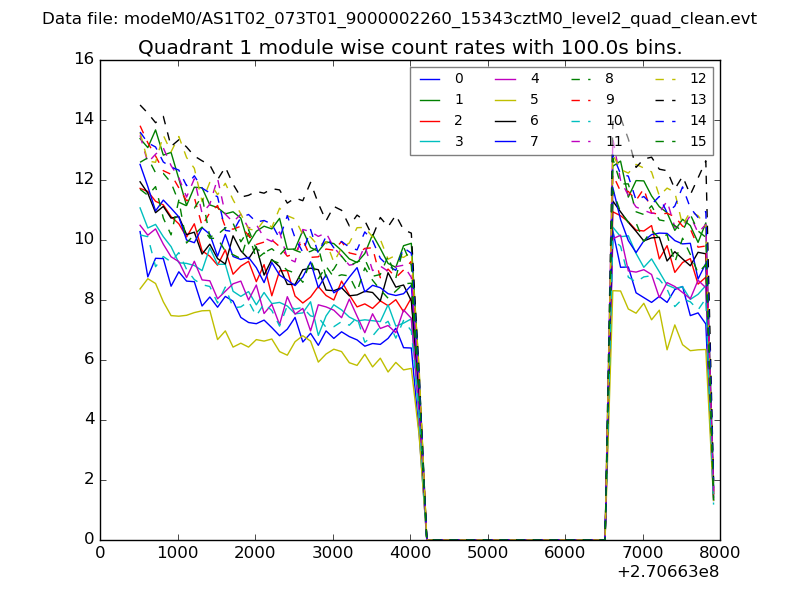
| Module-wise count rates for Quadrant A Data is divided into 100 sec bins |
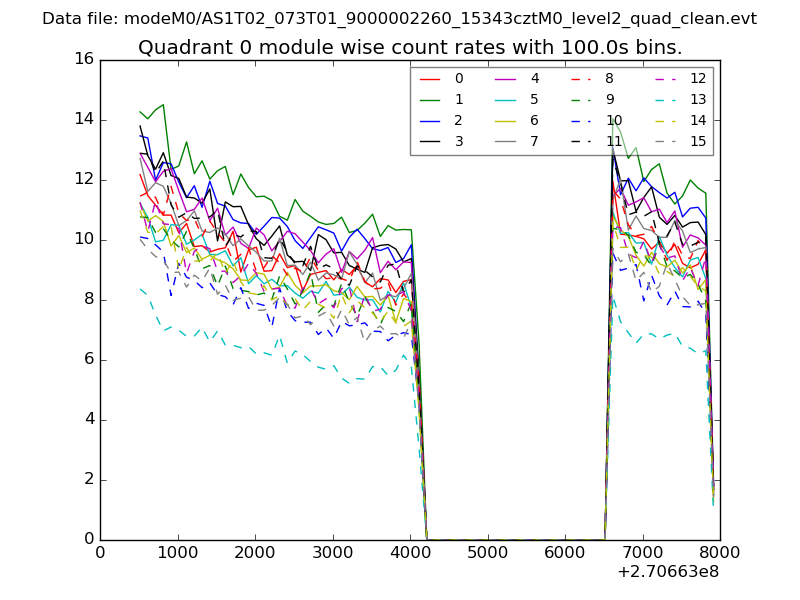 |
 |
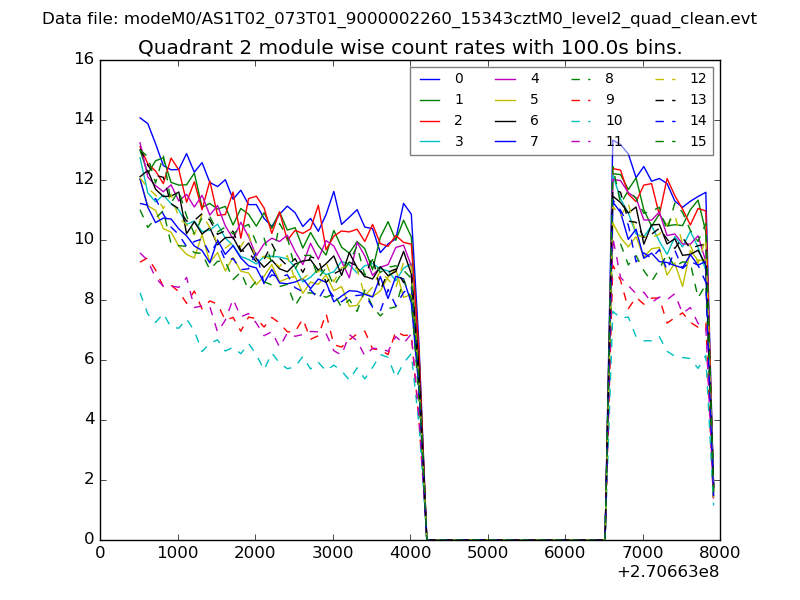
| Module-wise count rates for Quadrant B Data is divided into 100 sec bins |
 |
 |
| Module-wise count rates for Quadrant C Data is divided into 100 sec bins |
 |
 |
| Module-wise count rates for Quadrant D Data is divided into 100 sec bins |
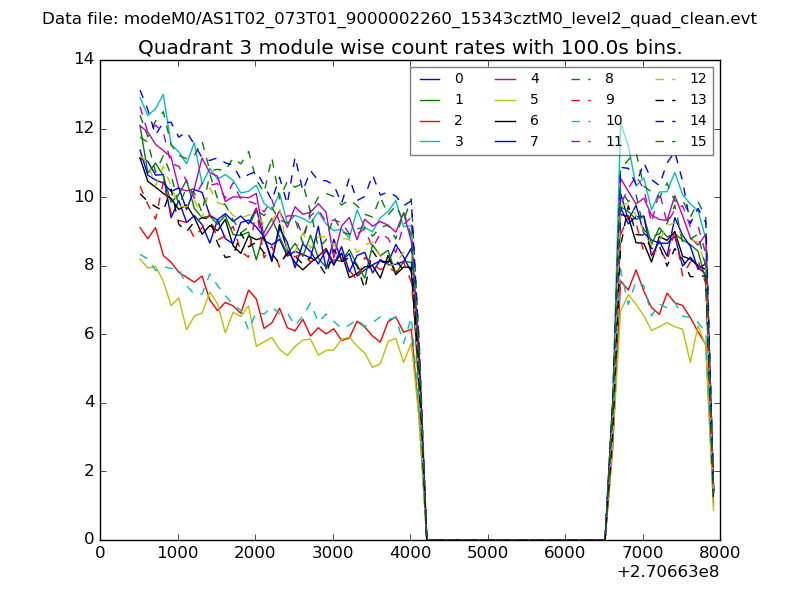 |
 |
| Parameter | Plot |
|---|---|
| CZT HV Monitor | 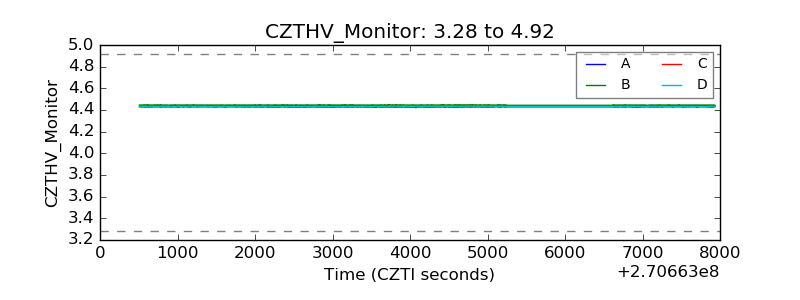 |
| D_VDD | 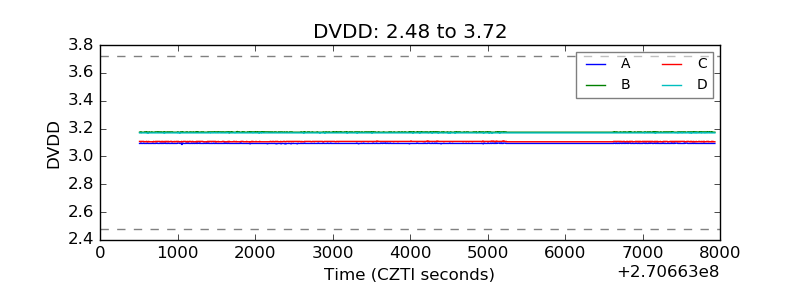 |
| Temperature 1 | 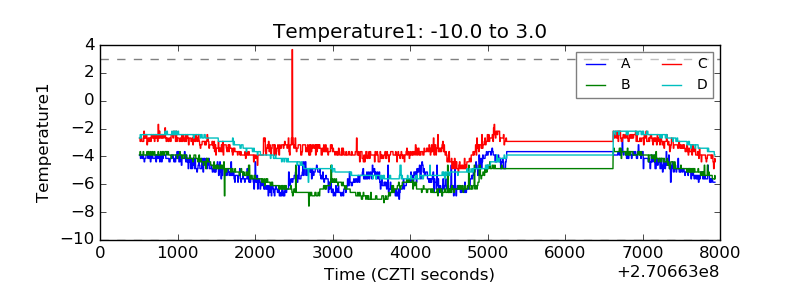 |
| Veto HV Monitor | 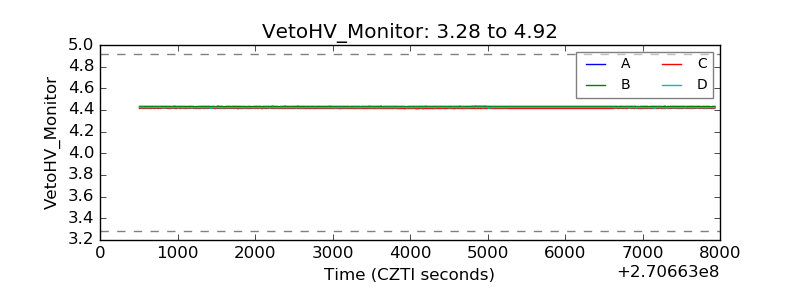 |
| Veto LLD | 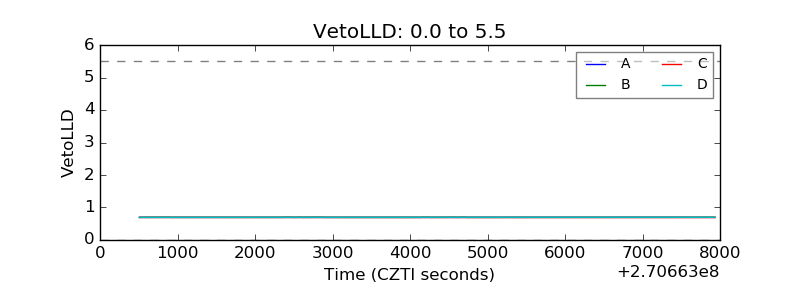 |
| Alpha Counter | 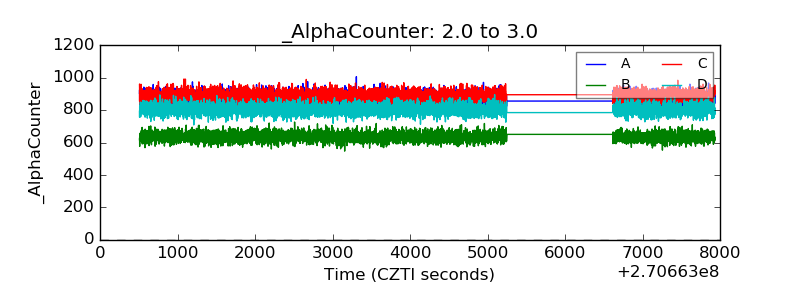 |
| _CPM_Rate | 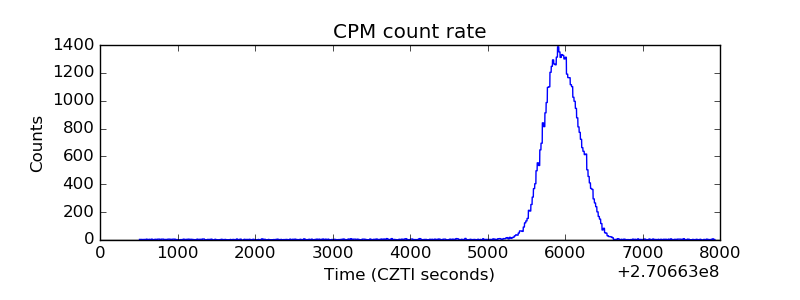 |
| CZT Counter |  |
| +2.5 Volts monitor |  |
| +5 Volts monitor |  |
| _ROLL_ROT | 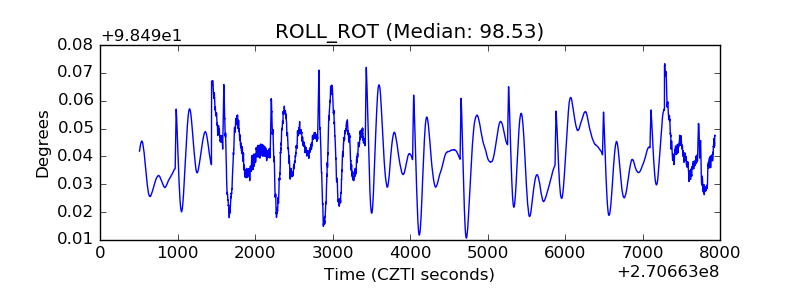 |
| _Roll_DEC | 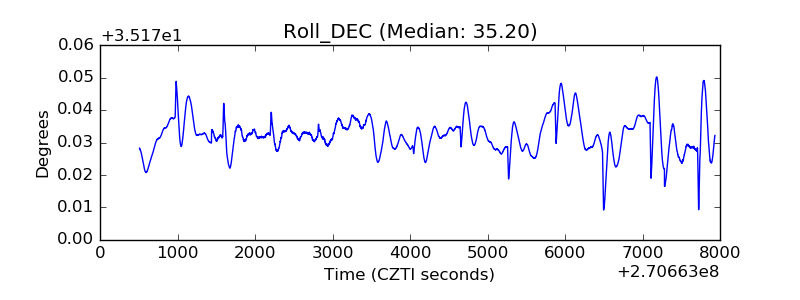 |
| _Roll_RA | 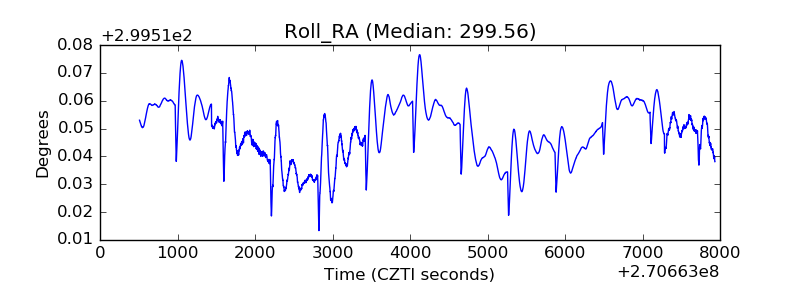 |
| Veto Counter | 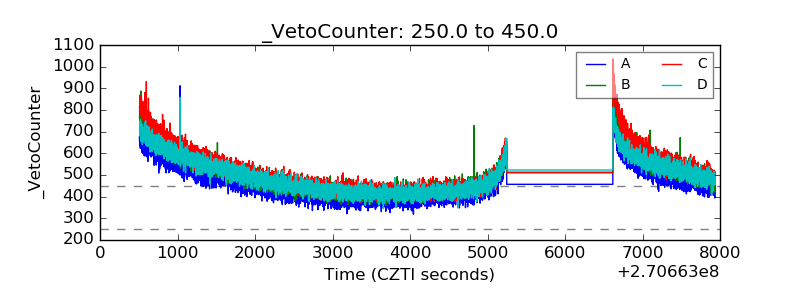 |