| Param | Original file | Final file |
|---|---|---|
| Filename | modeM0/AS1T02_073T01_9000002260_15344cztM0_level2.evt | modeM0/AS1T02_073T01_9000002260_15344cztM0_level2_quad_clean.evt |
| Size (bytes) | 549,034,560 | 92,537,280 |
| Size | 523.6 MB | 88.3 MB |
| Events in quadrant A | 2,879,119 | 616,465 |
| Events in quadrant B | 3,078,725 | 625,399 |
| Events in quadrant C | 3,121,957 | 622,910 |
| Events in quadrant D | 7,140,526 | 517,609 |
| Mode SS | |||
|---|---|---|---|
| Quadrant | BADHDUFLAG | Total packets | Discarded packets |
| A | 0 | 122 | 0 |
| B | 0 | 122 | 0 |
| C | 0 | 122 | 0 |
| D | 0 | 122 | 0 |
| Mode M0 | |||
|---|---|---|---|
| Quadrant | BADHDUFLAG | Total packets | Discarded packets |
| A | 0 | 12434 | 2 |
| B | 0 | 12941 | 1 |
| C | 0 | 12865 | 1 |
| D | 0 | 25439 | 1 |
| Mode M9 | |||
|---|---|---|---|
| Quadrant | BADHDUFLAG | Total packets | Discarded packets |
| A | 0 | 12 | 0 |
| B | 0 | 12 | 0 |
| C | 0 | 12 | 0 |
| D | 0 | 12 | 0 |
| Quadrant | Total seconds | Saturated seconds | Saturation percentage |
|---|---|---|---|
| A | 6007 | 63 | 1.048776% |
| B | 6007 | 99 | 1.648077% |
| C | 6007 | 75 | 1.248543% |
| D | 6007 | 1223 | 20.359580% |
Noise dominated data is calculated using 1-second bins in cleaned event files. If a bin has >2000 counts, and if more than 50% of those come from <1% of pixels, then it is considered to be noise-dominated and hence unusable.
| Quadrant | # 1 sec bins | Bins with >0 counts | Bins with >2000 counts | High rate bins dominated by noise | Noise dominated (total time) | Noise dominated (detector-on time) | Marked lightcurve |
|---|---|---|---|---|---|---|---|
| A | 7233 | 6009 | 0 | 0 | 0.00% | 0.00% | 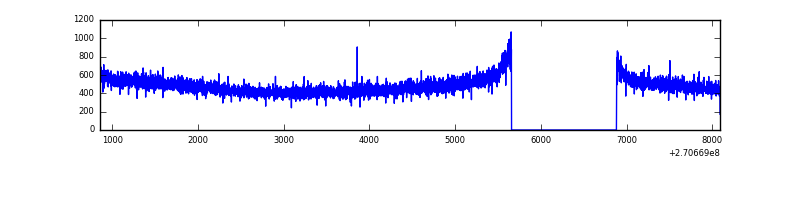 |
| B | 7233 | 6009 | 6 | 6 | 0.08% | 0.10% | 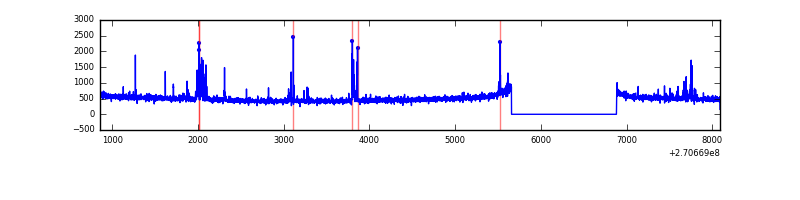 |
| C | 7233 | 6009 | 0 | 0 | 0.00% | 0.00% | 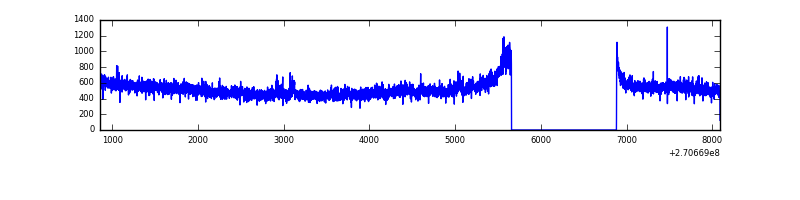 |
| D | 7233 | 6009 | 1260 | 1260 | 17.42% | 20.97% | 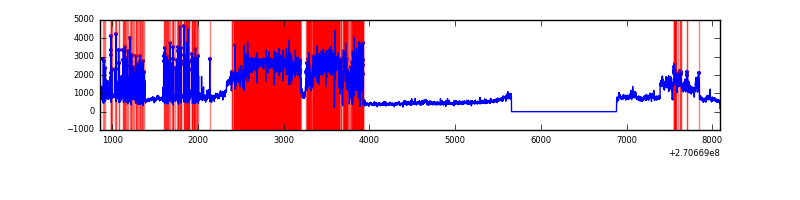 |
Top three noisy pixels from each quadrant. If the there are fewer than three noisy pixels in the level2.evt file, extra rows are filled as -1
| Pixel properties | Quadrant properties | ||||||
|---|---|---|---|---|---|---|---|
| Quadrant | DetID | PixID | Counts | Sigma | Mean | Median | Sigma |
| A | 0 | 226 | 6574 | 38.54 | 748 | 734 | 151.5 |
| A | 12 | 194 | 5532 | 31.66 | 748 | 734 | 151.5 |
| A | 3 | 137 | 5009 | 28.21 | 748 | 734 | 151.5 |
| B | 4 | 173 | 156316 | 1099.39 | 748 | 730 | 141.5 |
| B | 12 | 111 | 16671 | 112.64 | 748 | 730 | 141.5 |
| B | 11 | 111 | 14473 | 97.11 | 748 | 730 | 141.5 |
| C | 3 | 233 | 180225 | 1047.95 | 744 | 748 | 171.3 |
| C | 7 | 247 | 41687 | 239.04 | 744 | 748 | 171.3 |
| C | 13 | 61 | 5197 | 25.98 | 744 | 748 | 171.3 |
| D | 1 | 255 | 3803368 | 22660.4 | 696 | 678 | 167.8 |
| D | 7 | 223 | 658080 | 3917.49 | 696 | 678 | 167.8 |
| D | 2 | 33 | 28852 | 167.89 | 696 | 678 | 167.8 |
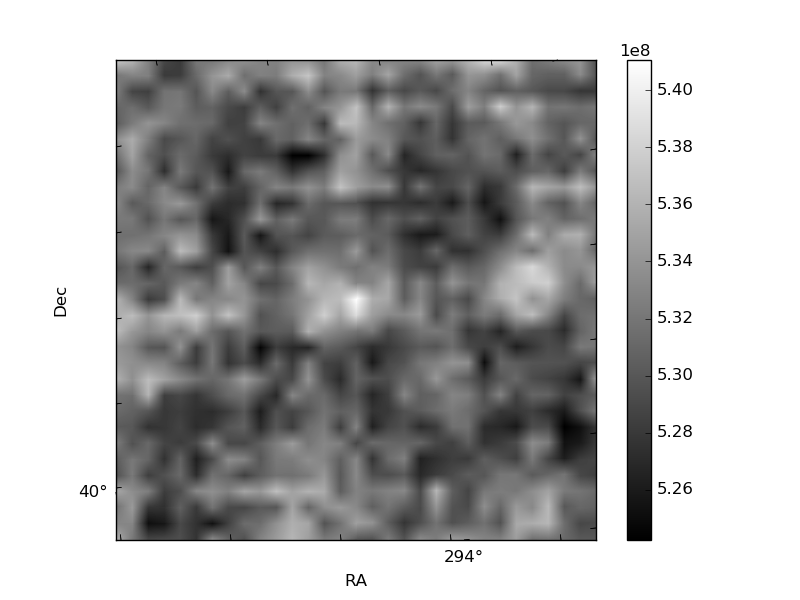
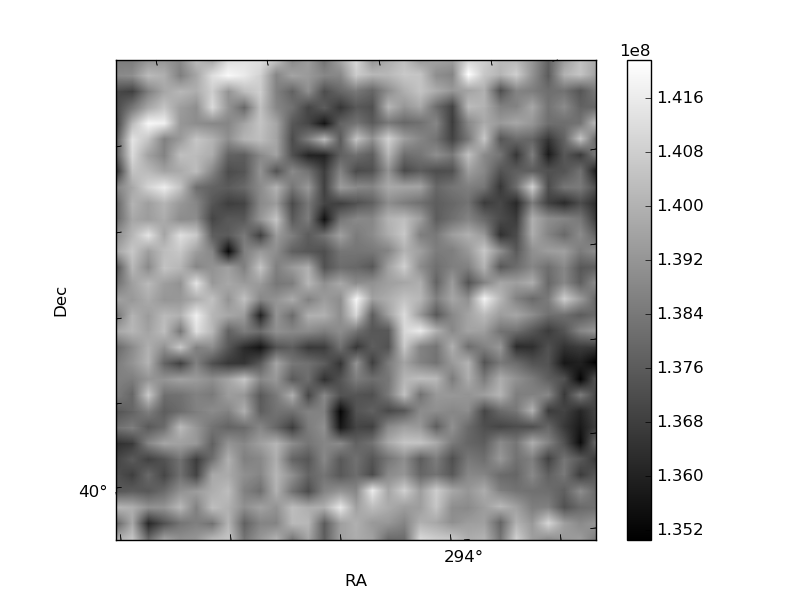
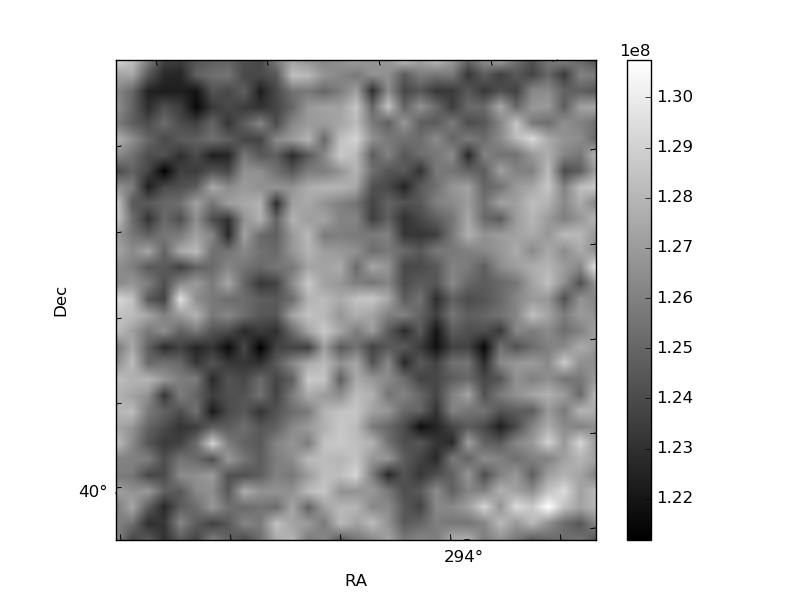
Histogram calculated using DETX and DETY for each event in the final _common_clean file
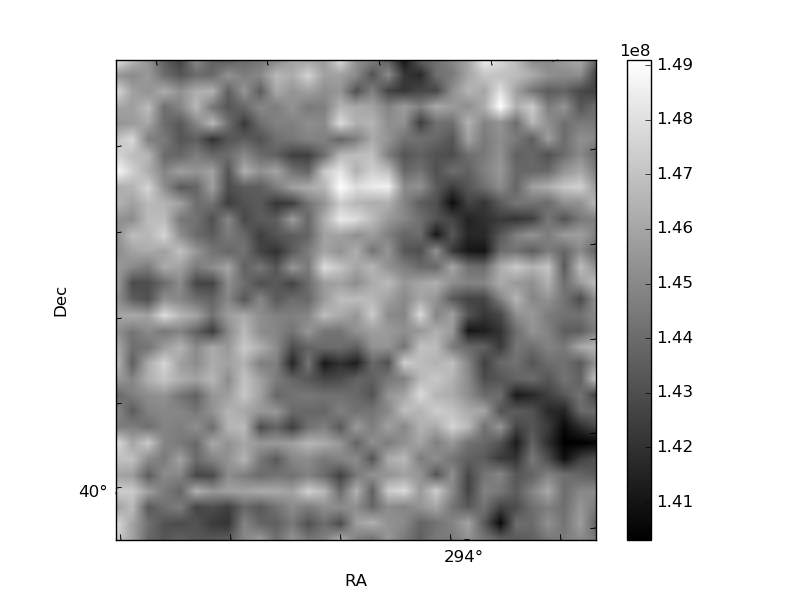
| Quadrant A | 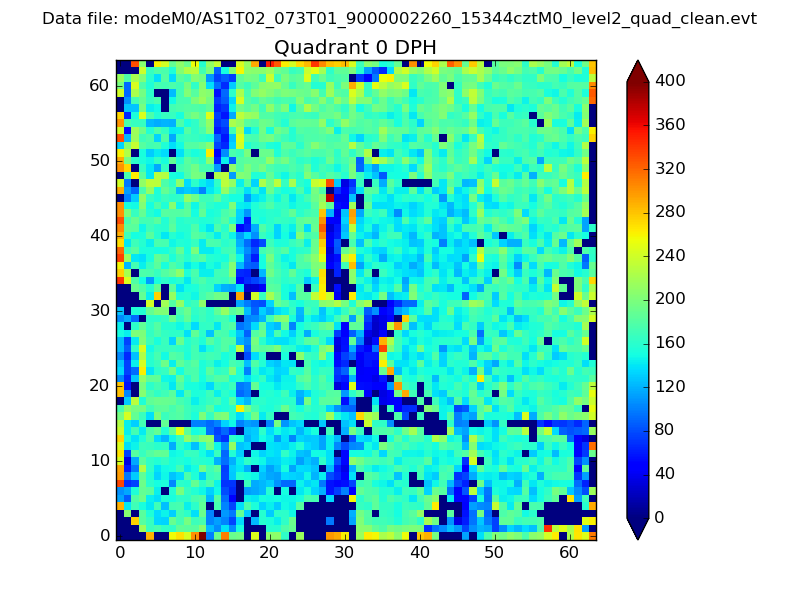 |
 |
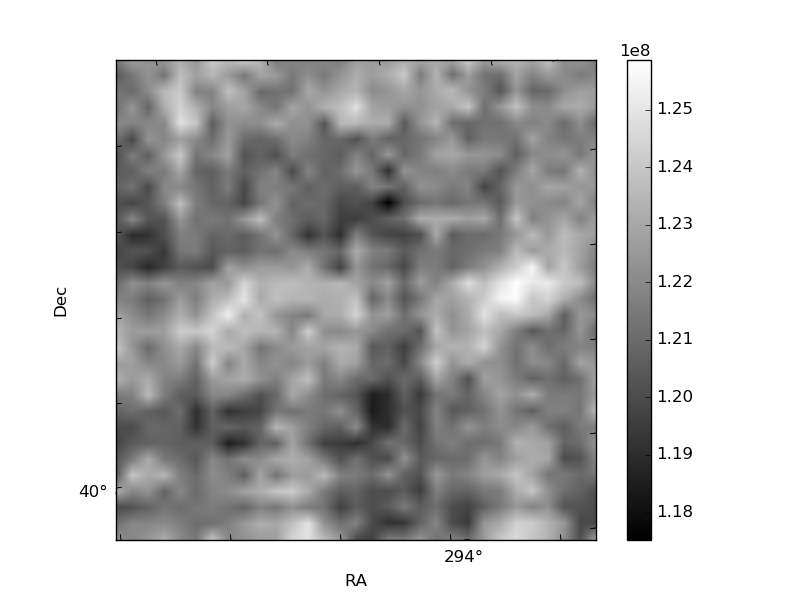
Quadrant B |
|---|---|---|---|
| Quadrant D | 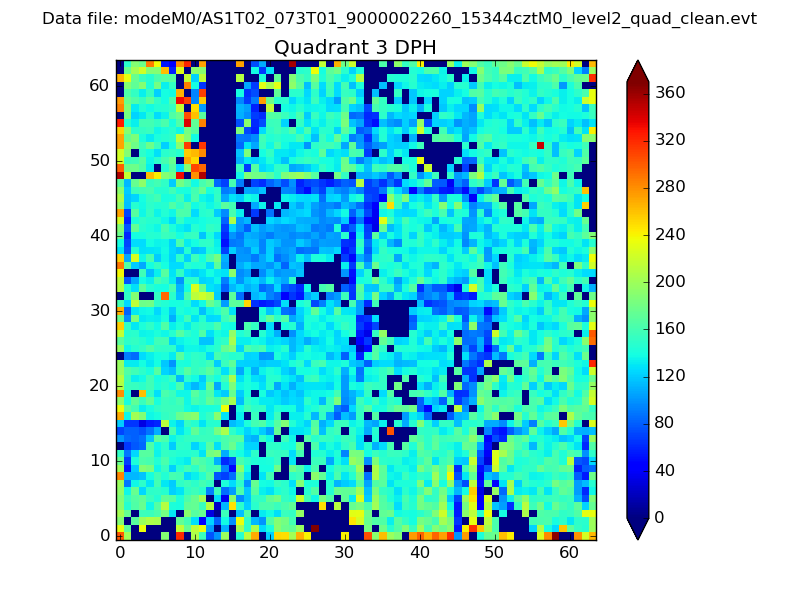 |
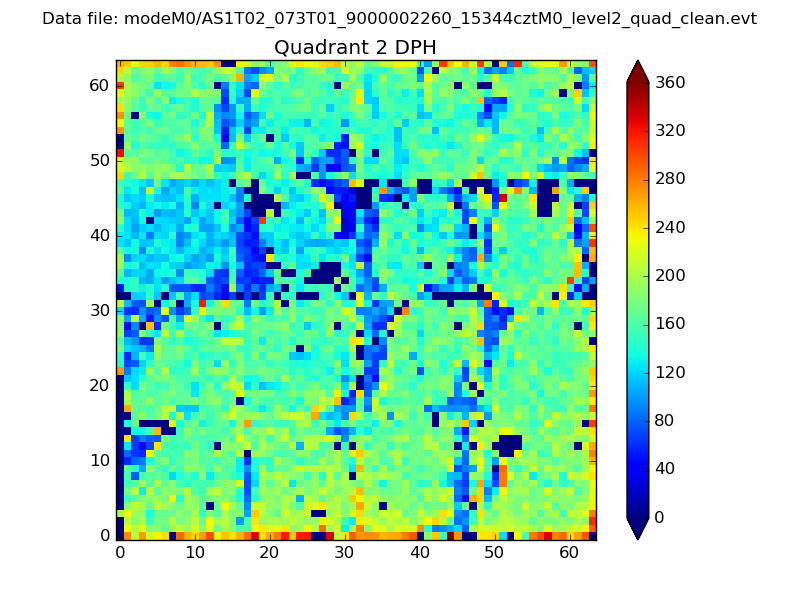 |
Quadrant C |
| Plot type | Count rate plots | Images |
|---|---|---|
| Comparison with Poisson distribution Blue bars denote a histogram of data divided into 1 sec bins. Red curve is a Poisson curve with rate = median count rate of data. |
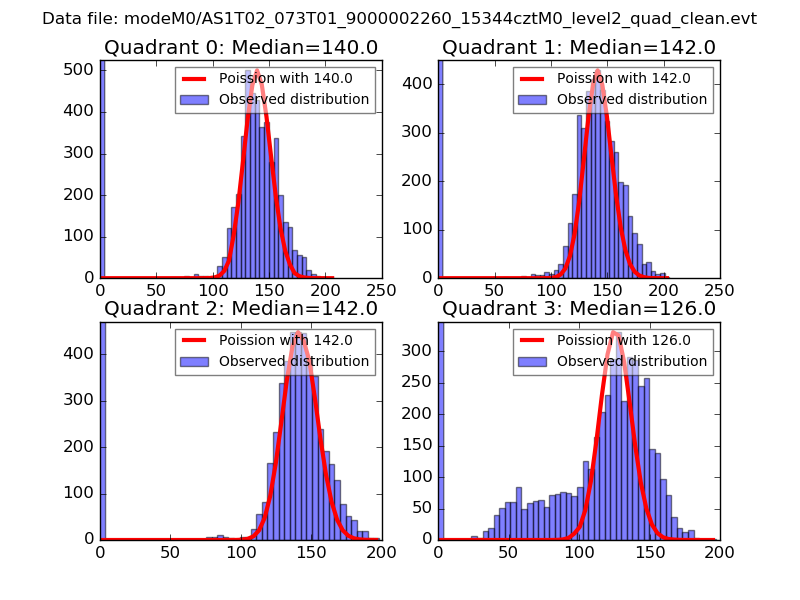 |
 |
| Quadrant-wise count rates Data is divided into 100 sec bins |
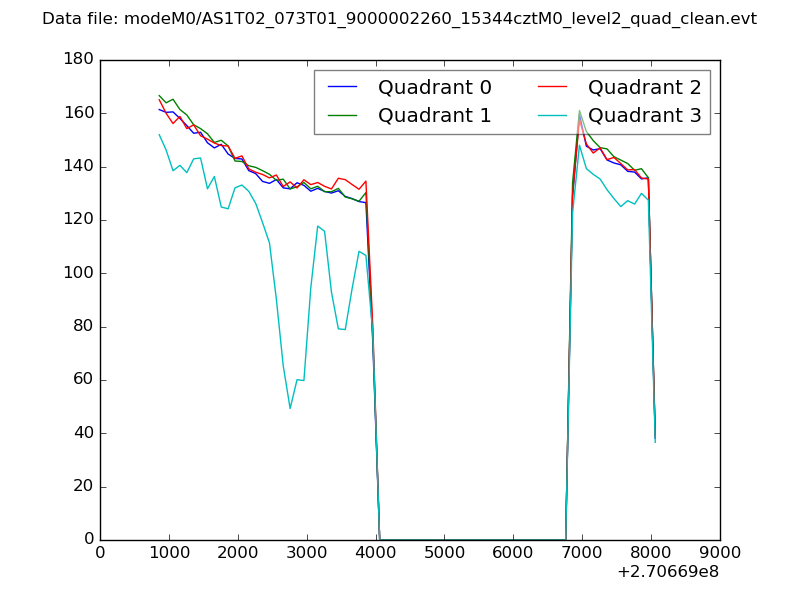 |
|
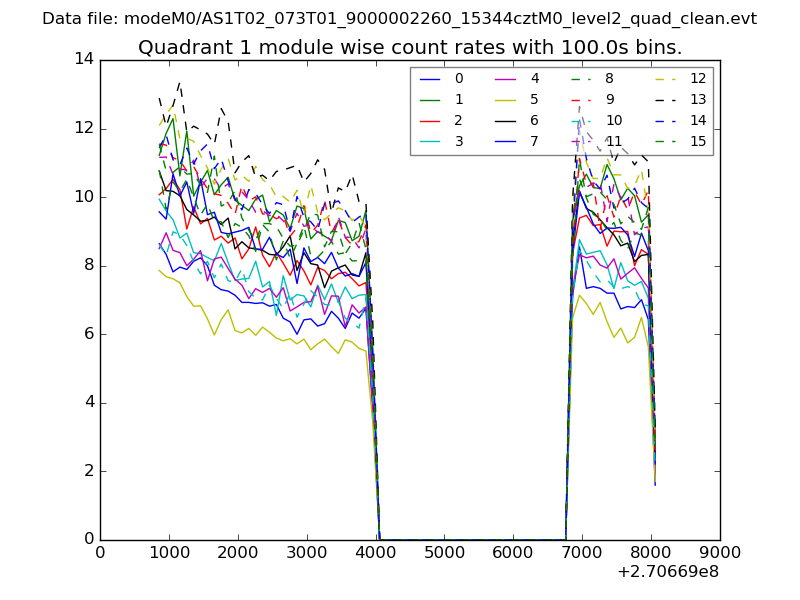
| Module-wise count rates for Quadrant A Data is divided into 100 sec bins |
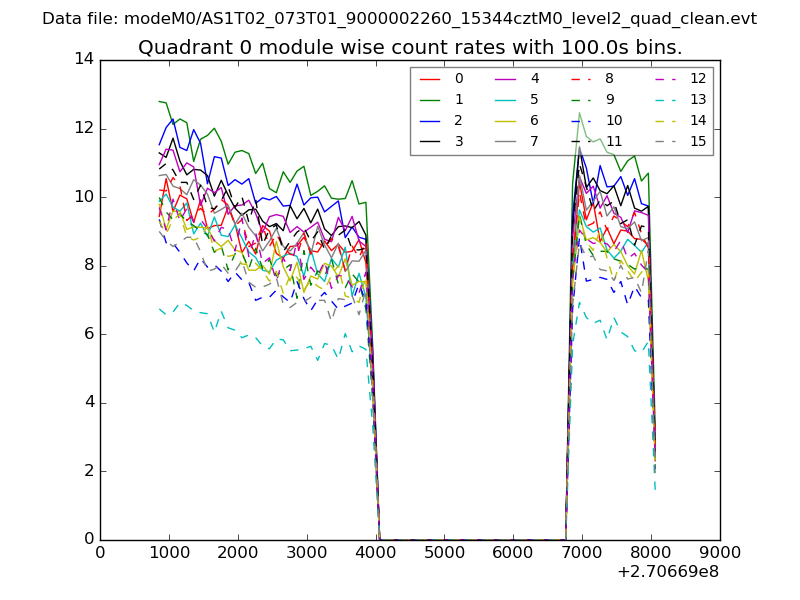 |
 |
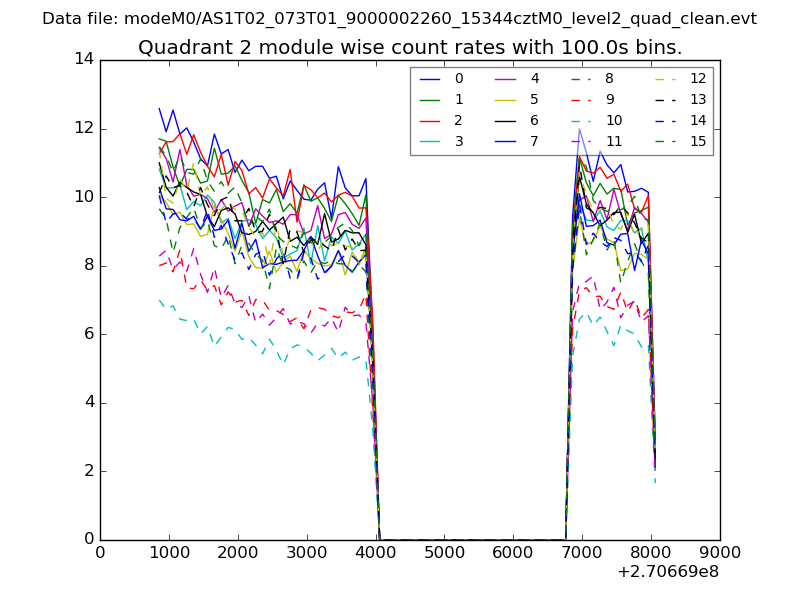
| Module-wise count rates for Quadrant B Data is divided into 100 sec bins |
 |
 |
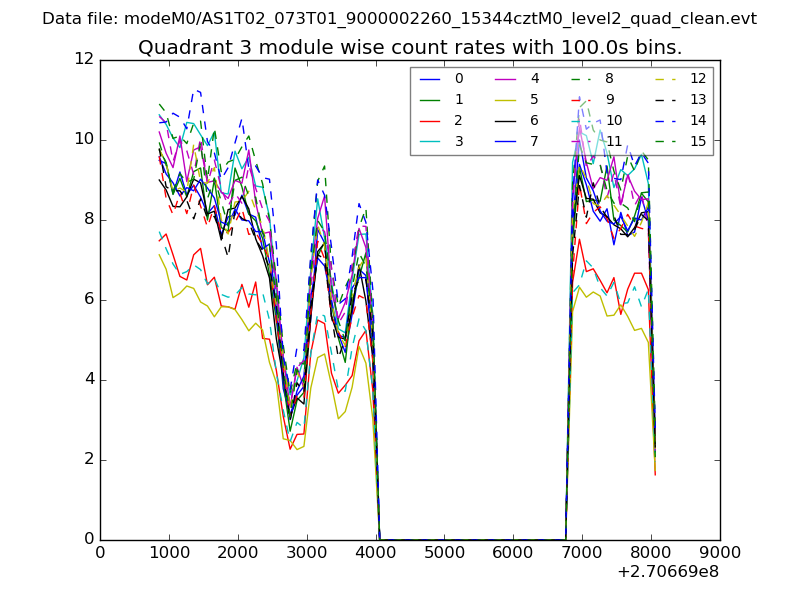
| Module-wise count rates for Quadrant C Data is divided into 100 sec bins |
 |
 |
| Module-wise count rates for Quadrant D Data is divided into 100 sec bins |
 |
 |
| Parameter | Plot |
|---|---|
| CZT HV Monitor | 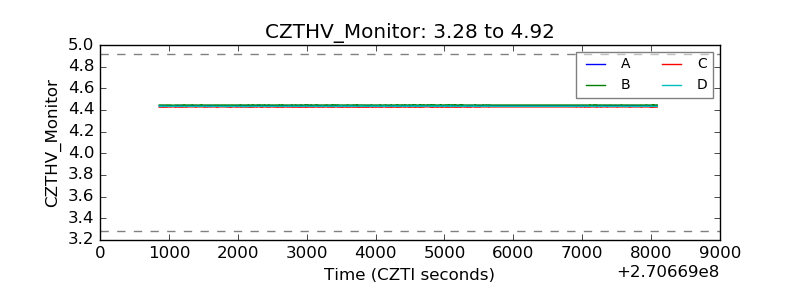 |
| D_VDD | 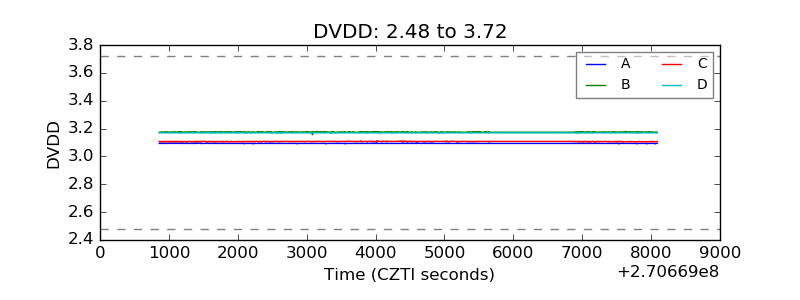 |
| Temperature 1 |  |
| Veto HV Monitor | 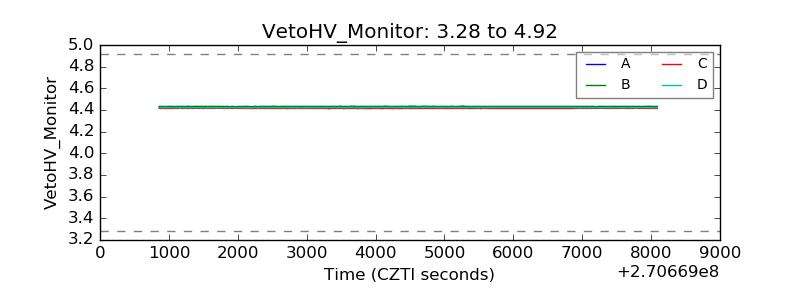 |
| Veto LLD | 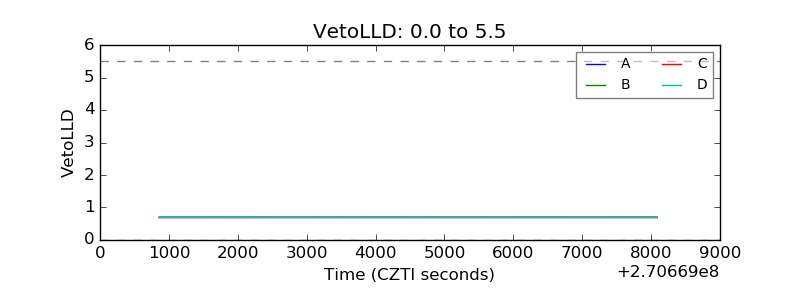 |
| Alpha Counter | 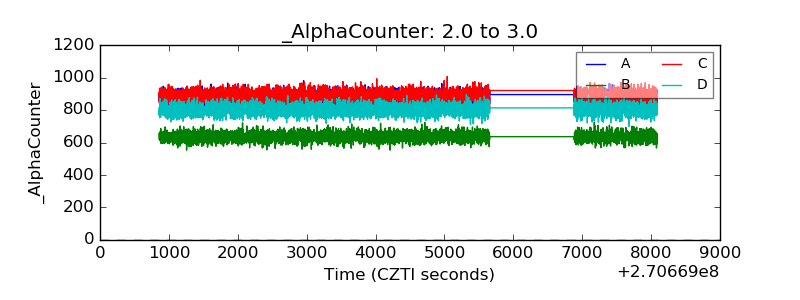 |
| _CPM_Rate | 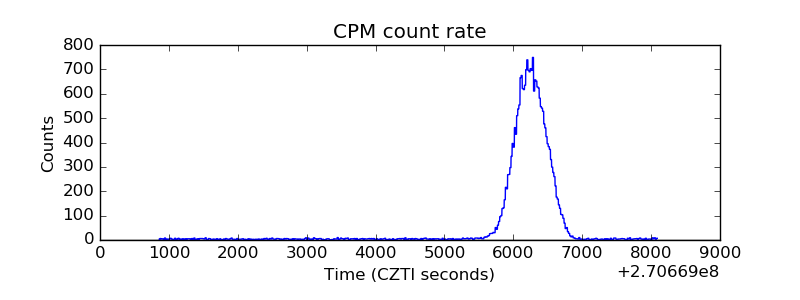 |
| CZT Counter | 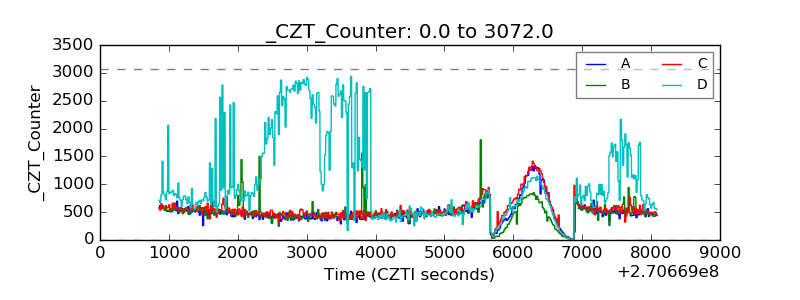 |
| +2.5 Volts monitor |  |
| +5 Volts monitor | 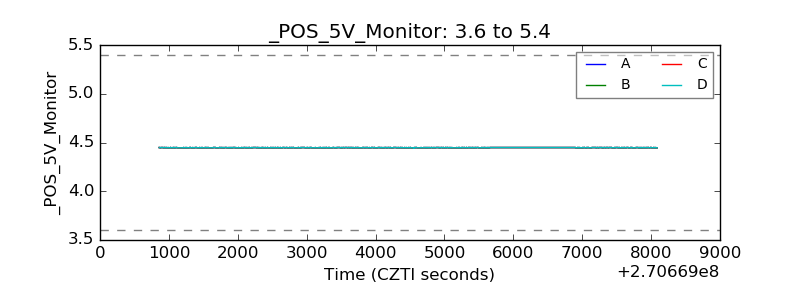 |
| _ROLL_ROT | 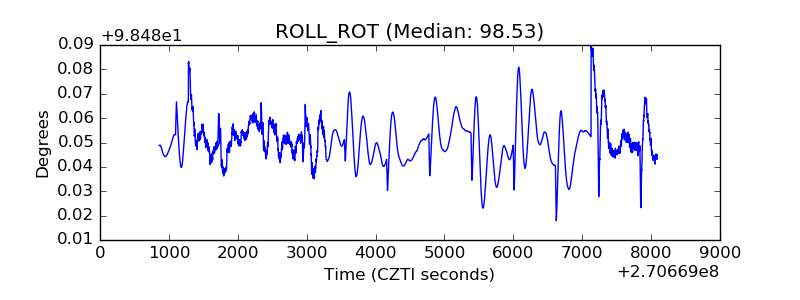 |
| _Roll_DEC | 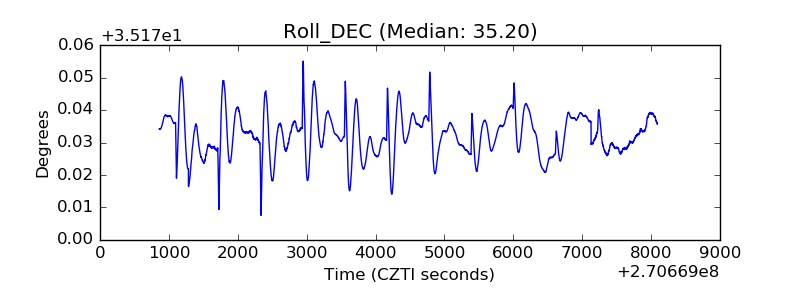 |
| _Roll_RA | 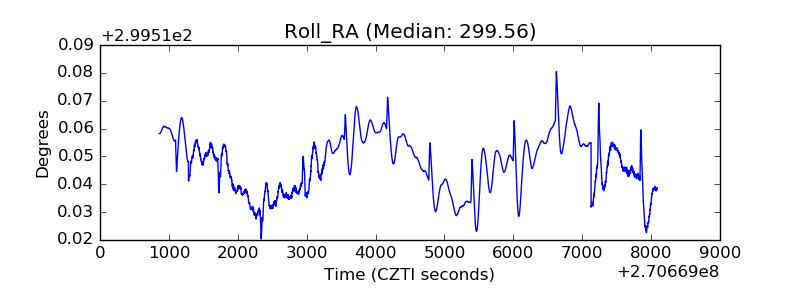 |
| Veto Counter | 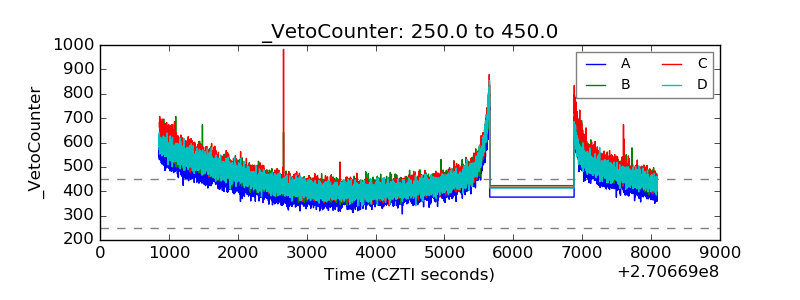 |