| Param | Original file | Final file |
|---|---|---|
| Filename | modeM0/AS1T02_073T01_9000002260_15345cztM0_level2.evt | modeM0/AS1T02_073T01_9000002260_15345cztM0_level2_quad_clean.evt |
| Size (bytes) | 503,213,760 | 91,897,920 |
| Size | 479.9 MB | 87.6 MB |
| Events in quadrant A | 3,180,752 | 583,037 |
| Events in quadrant B | 3,279,538 | 593,489 |
| Events in quadrant C | 4,035,323 | 583,313 |
| Events in quadrant D | 4,289,336 | 555,984 |
| Mode SS | |||
|---|---|---|---|
| Quadrant | BADHDUFLAG | Total packets | Discarded packets |
| A | 0 | 138 | 0 |
| B | 0 | 138 | 0 |
| C | 0 | 138 | 0 |
| D | 0 | 138 | 0 |
| Mode M0 | |||
|---|---|---|---|
| Quadrant | BADHDUFLAG | Total packets | Discarded packets |
| A | 0 | 13998 | 3 |
| B | 0 | 14136 | 2 |
| C | 0 | 16268 | 2 |
| D | 0 | 17379 | 2 |
| Mode M9 | |||
|---|---|---|---|
| Quadrant | BADHDUFLAG | Total packets | Discarded packets |
| A | 0 | 22 | 0 |
| B | 0 | 22 | 0 |
| C | 0 | 22 | 0 |
| D | 0 | 22 | 0 |
| Quadrant | Total seconds | Saturated seconds | Saturation percentage |
|---|---|---|---|
| A | 6702 | 101 | 1.507013% |
| B | 6702 | 134 | 1.999403% |
| C | 6702 | 111 | 1.656222% |
| D | 6702 | 132 | 1.969561% |
Noise dominated data is calculated using 1-second bins in cleaned event files. If a bin has >2000 counts, and if more than 50% of those come from <1% of pixels, then it is considered to be noise-dominated and hence unusable.
| Quadrant | # 1 sec bins | Bins with >0 counts | Bins with >2000 counts | High rate bins dominated by noise | Noise dominated (total time) | Noise dominated (detector-on time) | Marked lightcurve |
|---|---|---|---|---|---|---|---|
| A | 8893 | 6705 | 0 | 0 | 0.00% | 0.00% | 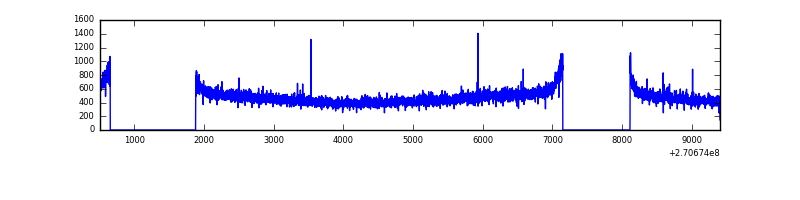 |
| B | 8893 | 6705 | 1 | 1 | 0.01% | 0.01% | 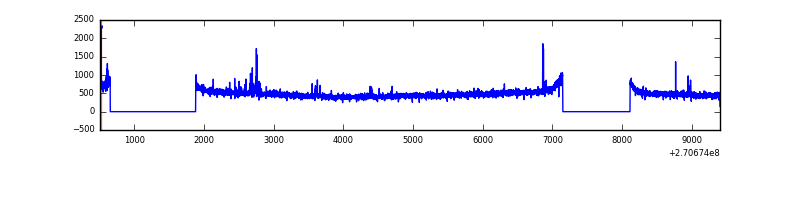 |
| C | 8893 | 6705 | 6 | 6 | 0.07% | 0.09% |  |
| D | 8893 | 6705 | 36 | 36 | 0.40% | 0.54% | 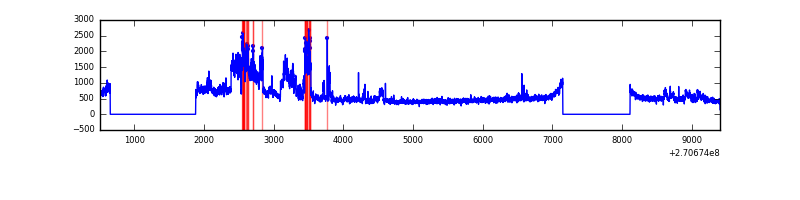 |
Top three noisy pixels from each quadrant. If the there are fewer than three noisy pixels in the level2.evt file, extra rows are filled as -1
| Pixel properties | Quadrant properties | ||||||
|---|---|---|---|---|---|---|---|
| Quadrant | DetID | PixID | Counts | Sigma | Mean | Median | Sigma |
| A | 0 | 226 | 7105 | 37.73 | 824 | 804 | 167.0 |
| A | 12 | 194 | 6041 | 31.36 | 824 | 804 | 167.0 |
| A | 3 | 137 | 5805 | 29.94 | 824 | 804 | 167.0 |
| B | 4 | 173 | 58841 | 365.87 | 823 | 802 | 158.6 |
| B | 12 | 111 | 19145 | 115.63 | 823 | 802 | 158.6 |
| B | 11 | 111 | 16365 | 98.11 | 823 | 802 | 158.6 |
| C | 3 | 233 | 447160 | 2373.24 | 812 | 817 | 188.1 |
| C | 7 | 247 | 422371 | 2241.44 | 812 | 817 | 188.1 |
| C | 13 | 61 | 5685 | 25.88 | 812 | 817 | 188.1 |
| D | 7 | 223 | 1206042 | 6124.01 | 809 | 788 | 196.8 |
| D | 2 | 234 | 26010 | 128.16 | 809 | 788 | 196.8 |
| D | 13 | 104 | 12024 | 57.09 | 809 | 788 | 196.8 |
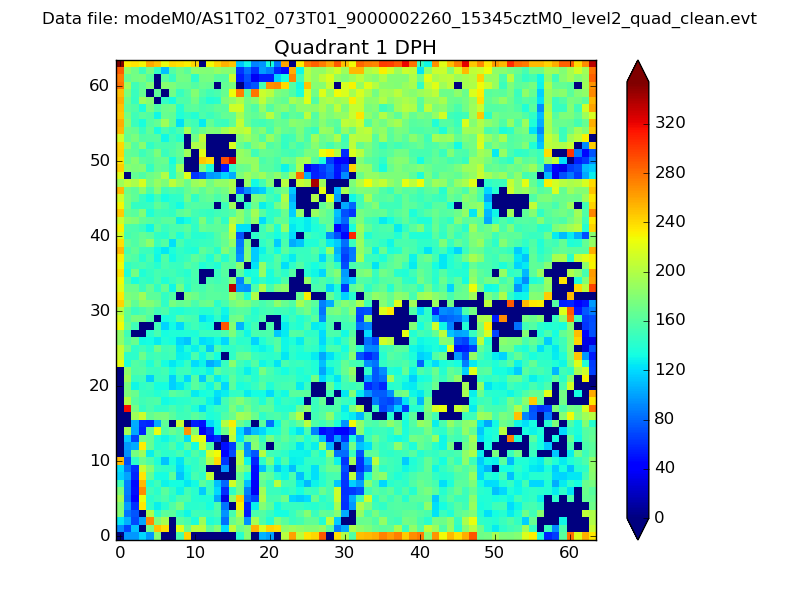
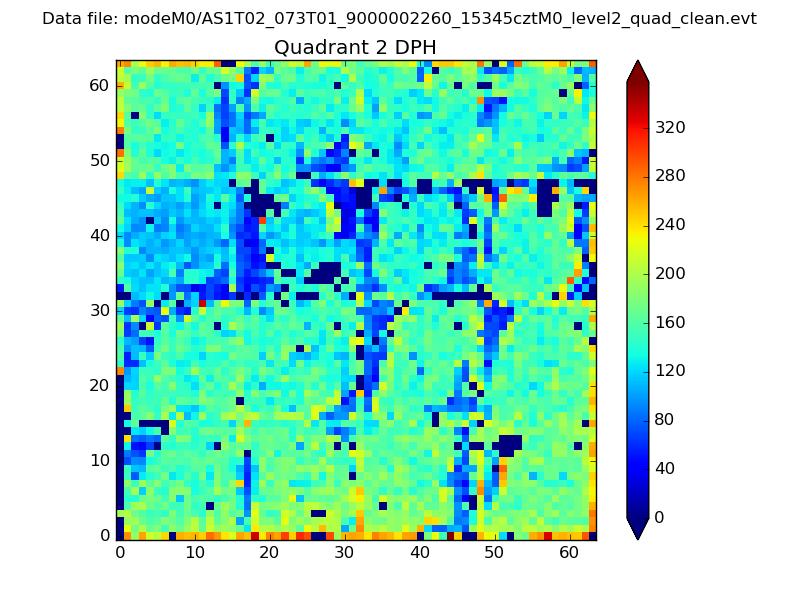
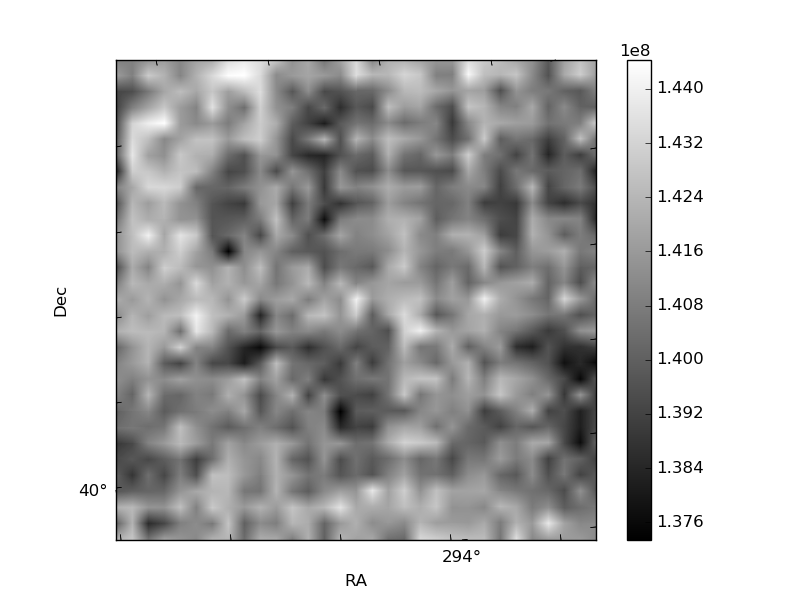
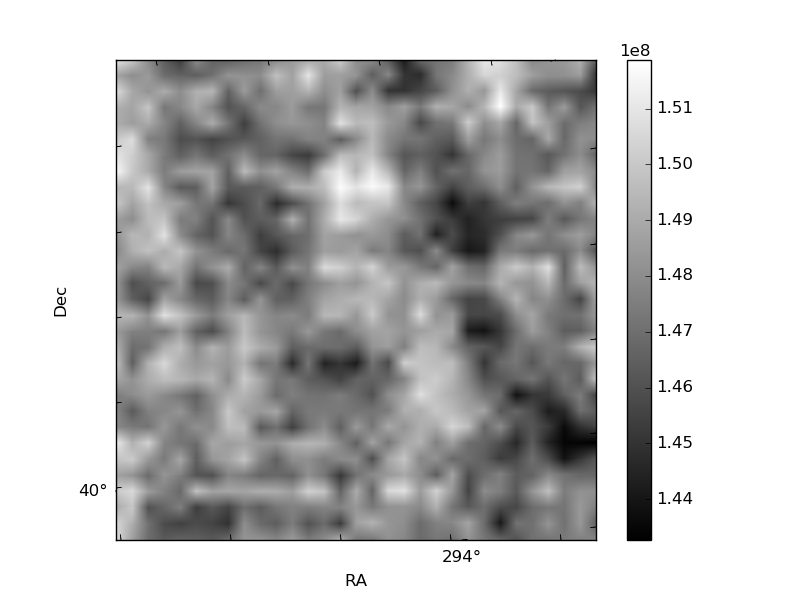
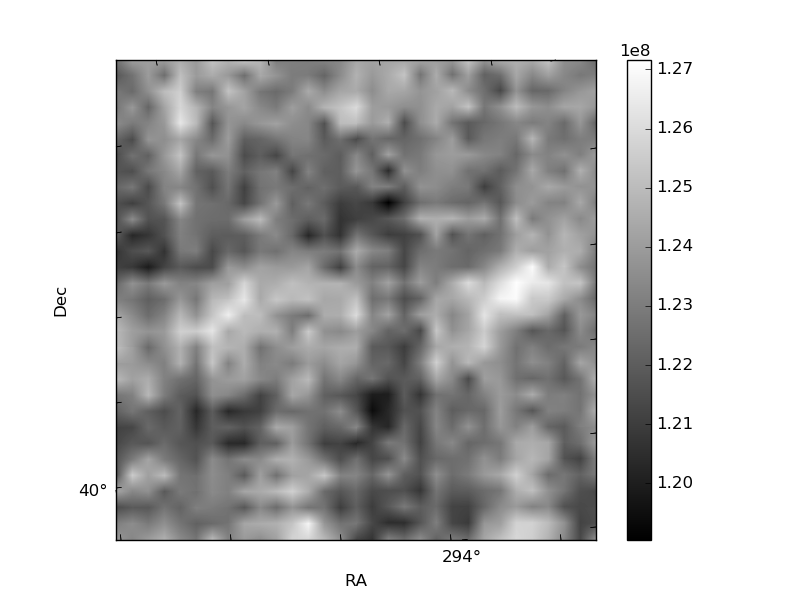
Histogram calculated using DETX and DETY for each event in the final _common_clean file
| Quadrant A | 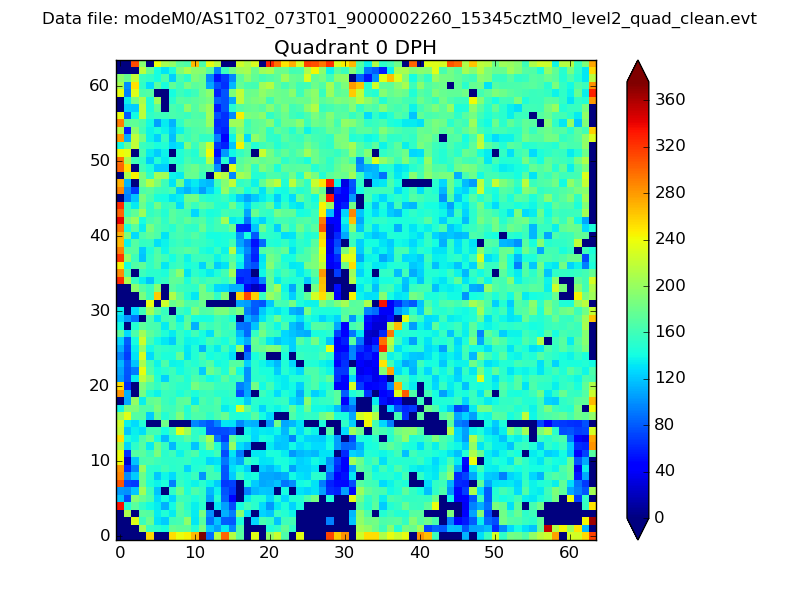 |
 |
Quadrant B |
|---|---|---|---|
| Quadrant D |  |
 |
Quadrant C |
| Plot type | Count rate plots | Images |
|---|---|---|
| Comparison with Poisson distribution Blue bars denote a histogram of data divided into 1 sec bins. Red curve is a Poisson curve with rate = median count rate of data. |
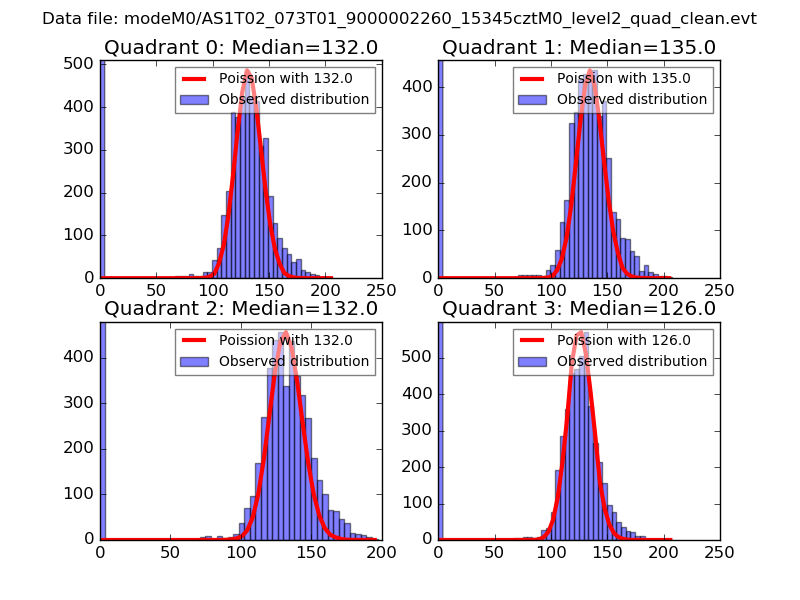 |
 |
| Quadrant-wise count rates Data is divided into 100 sec bins |
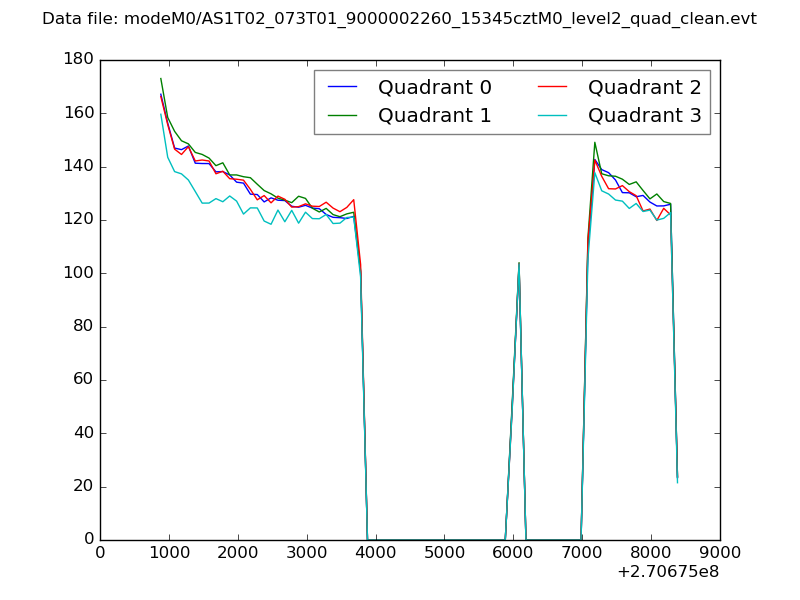 |
|
| Module-wise count rates for Quadrant A Data is divided into 100 sec bins |
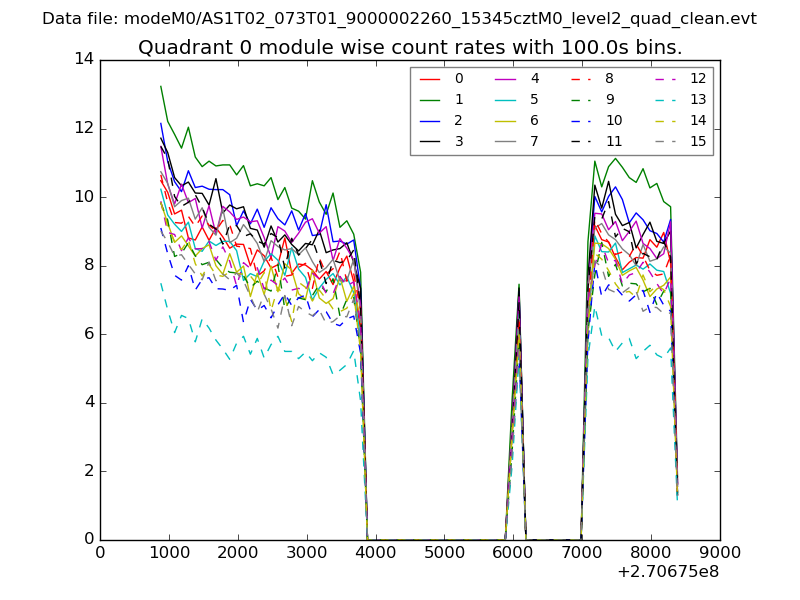 |
 |
| Module-wise count rates for Quadrant B Data is divided into 100 sec bins |
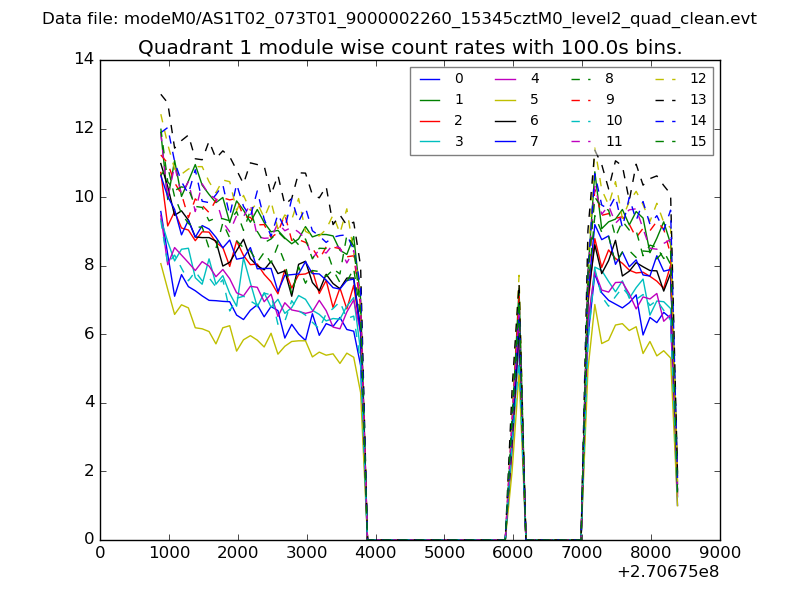 |
 |
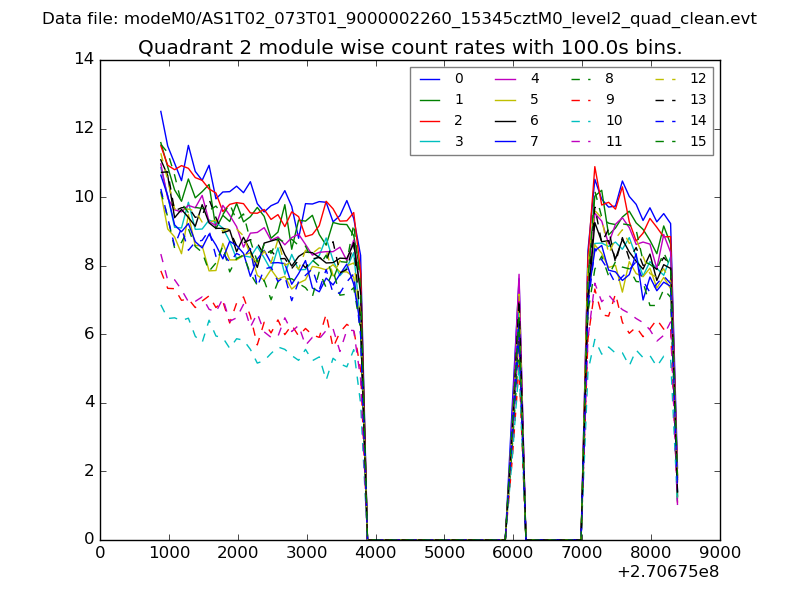
| Module-wise count rates for Quadrant C Data is divided into 100 sec bins |
 |
 |
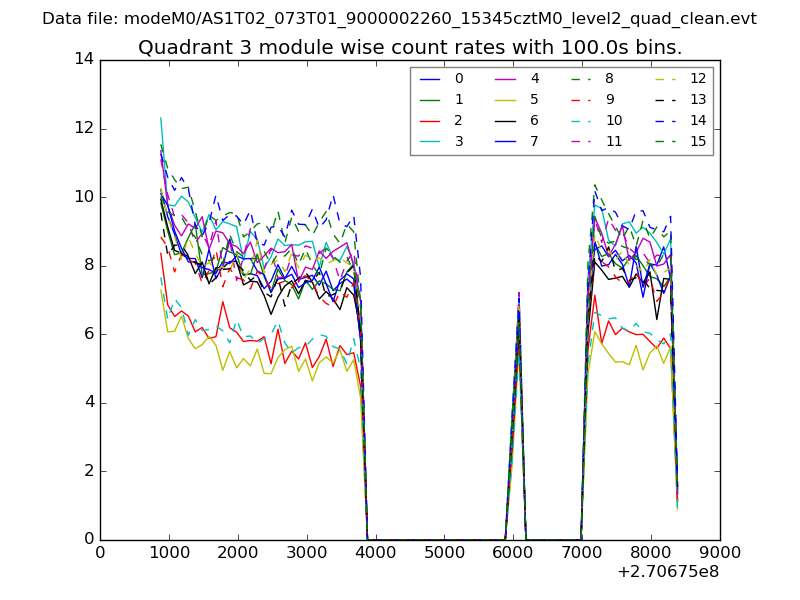
| Module-wise count rates for Quadrant D Data is divided into 100 sec bins |
 |
 |
| Parameter | Plot |
|---|---|
| CZT HV Monitor | 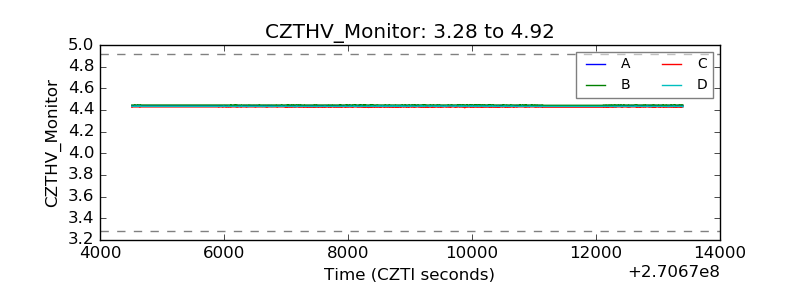 |
| D_VDD | 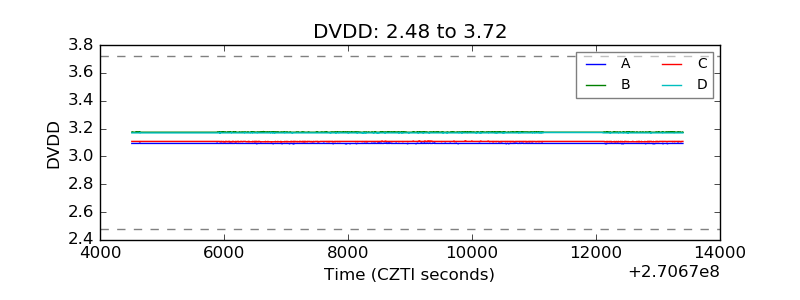 |
| Temperature 1 |  |
| Veto HV Monitor | 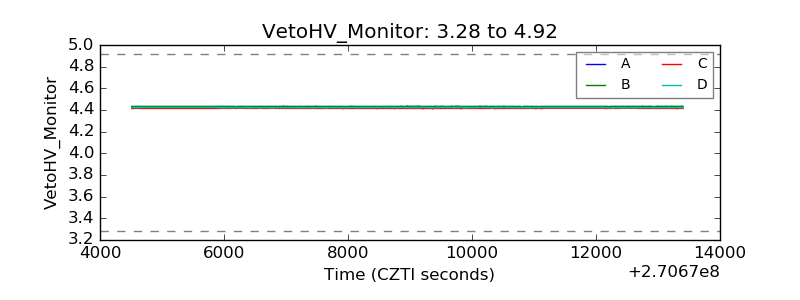 |
| Veto LLD | 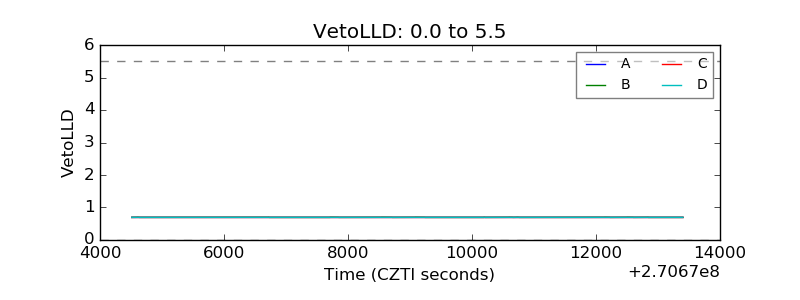 |
| Alpha Counter | 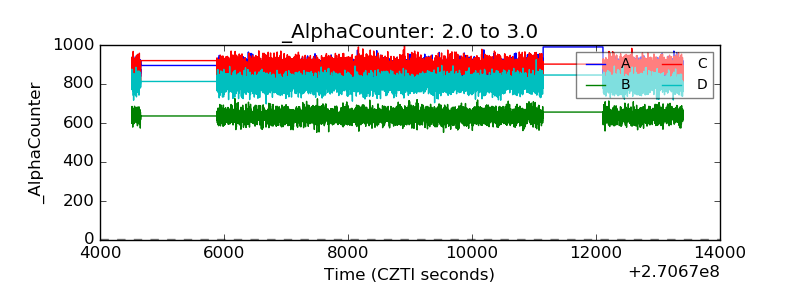 |
| _CPM_Rate | 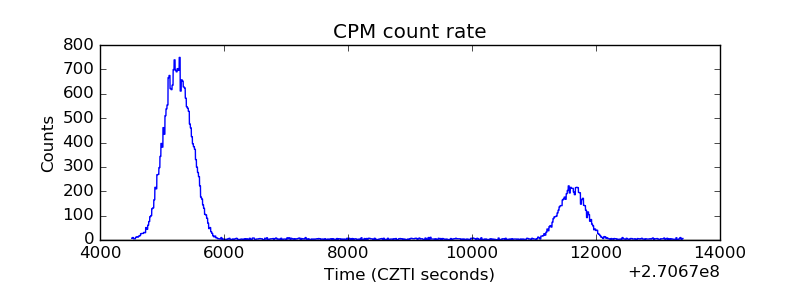 |
| CZT Counter | 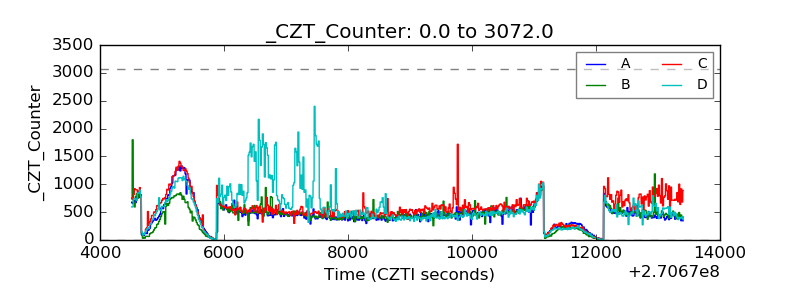 |
| +2.5 Volts monitor |  |
| +5 Volts monitor | 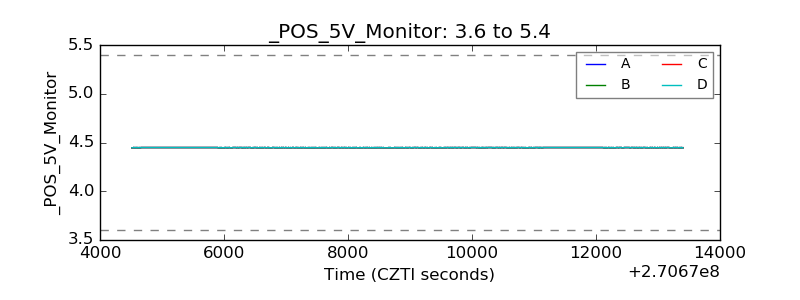 |
| _ROLL_ROT | 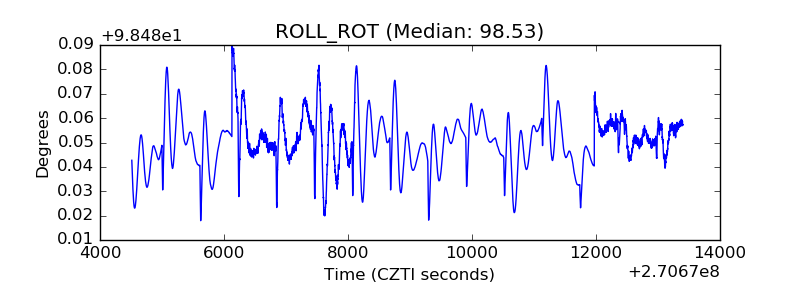 |
| _Roll_DEC | 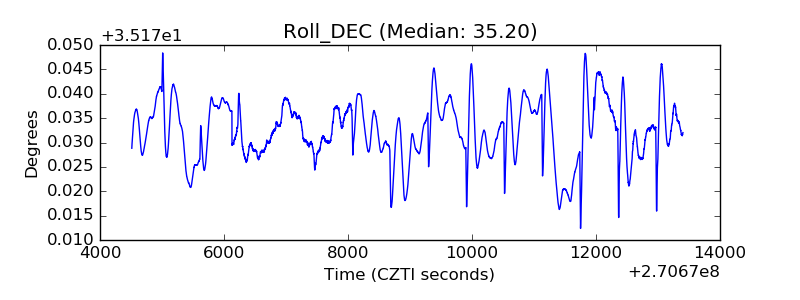 |
| _Roll_RA | 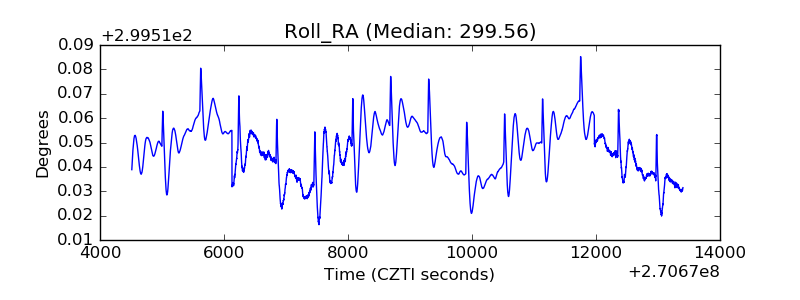 |
| Veto Counter | 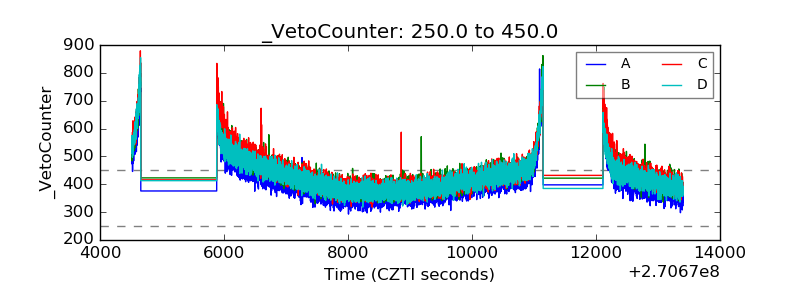 |