| Param | Original file | Final file |
|---|---|---|
| Filename | modeM0/AS1T02_073T01_9000002260_15348cztM0_level2.evt | modeM0/AS1T02_073T01_9000002260_15348cztM0_level2_quad_clean.evt |
| Size (bytes) | 45,319,680 | 12,706,560 |
| Size | 43.2 MB | 12.1 MB |
| Events in quadrant A | 329,431 | 83,802 |
| Events in quadrant B | 330,620 | 85,679 |
| Events in quadrant C | 345,506 | 82,957 |
| Events in quadrant D | 321,104 | 80,506 |
| Mode SS | |||
|---|---|---|---|
| Quadrant | BADHDUFLAG | Total packets | Discarded packets |
| A | 0 | 12 | 0 |
| B | 0 | 12 | 0 |
| C | 0 | 12 | 0 |
| D | 0 | 12 | 0 |
| Mode M0 | |||
|---|---|---|---|
| Quadrant | BADHDUFLAG | Total packets | Discarded packets |
| A | 0 | 1295 | 0 |
| B | 0 | 1302 | 0 |
| C | 0 | 1352 | 0 |
| D | 0 | 1280 | 0 |
| Quadrant | Total seconds | Saturated seconds | Saturation percentage |
|---|---|---|---|
| A | 625 | 3 | 0.480000% |
| B | 625 | 0 | 0.000000% |
| C | 625 | 0 | 0.000000% |
| D | 625 | 1 | 0.160000% |
Noise dominated data is calculated using 1-second bins in cleaned event files. If a bin has >2000 counts, and if more than 50% of those come from <1% of pixels, then it is considered to be noise-dominated and hence unusable.
| Quadrant | # 1 sec bins | Bins with >0 counts | Bins with >2000 counts | High rate bins dominated by noise | Noise dominated (total time) | Noise dominated (detector-on time) | Marked lightcurve |
|---|---|---|---|---|---|---|---|
| A | 626 | 626 | 1 | 1 | 0.16% | 0.16% | 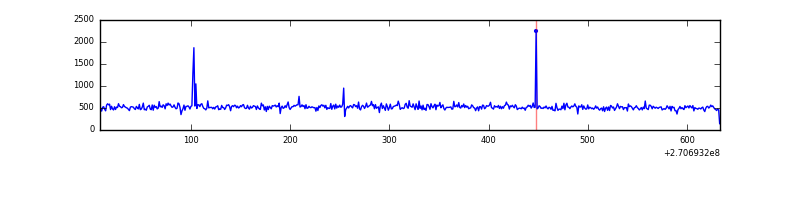 |
| B | 626 | 626 | 0 | 0 | 0.00% | 0.00% |  |
| C | 626 | 626 | 0 | 0 | 0.00% | 0.00% |  |
| D | 626 | 626 | 0 | 0 | 0.00% | 0.00% | 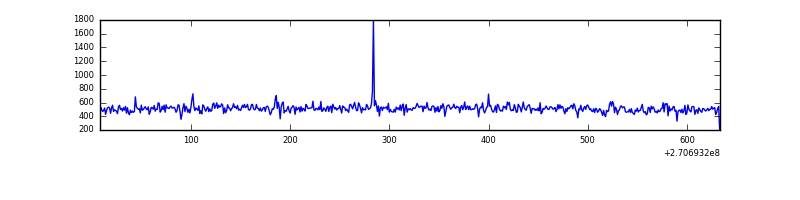 |
Top three noisy pixels from each quadrant. If the there are fewer than three noisy pixels in the level2.evt file, extra rows are filled as -1
| Pixel properties | Quadrant properties | ||||||
|---|---|---|---|---|---|---|---|
| Quadrant | DetID | PixID | Counts | Sigma | Mean | Median | Sigma |
| A | 4 | 2 | 3018 | 150.7 | 84 | 81 | 19.5 |
| A | 9 | 143 | 1793 | 87.84 | 84 | 81 | 19.5 |
| A | 0 | 226 | 719 | 32.74 | 84 | 81 | 19.5 |
| B | 12 | 111 | 1908 | 97.63 | 83 | 81 | 18.7 |
| B | 3 | 209 | 1759 | 89.67 | 83 | 81 | 18.7 |
| B | 11 | 111 | 1693 | 86.14 | 83 | 81 | 18.7 |
| C | 3 | 233 | 17282 | 802.49 | 83 | 84 | 21.4 |
| C | 7 | 247 | 1267 | 55.2 | 83 | 84 | 21.4 |
| C | 13 | 61 | 548 | 21.65 | 83 | 84 | 21.4 |
| D | 2 | 234 | 2784 | 121.36 | 84 | 80 | 22.3 |
| D | 7 | 38 | 1728 | 73.96 | 84 | 80 | 22.3 |
| D | 14 | 226 | 880 | 35.9 | 84 | 80 | 22.3 |
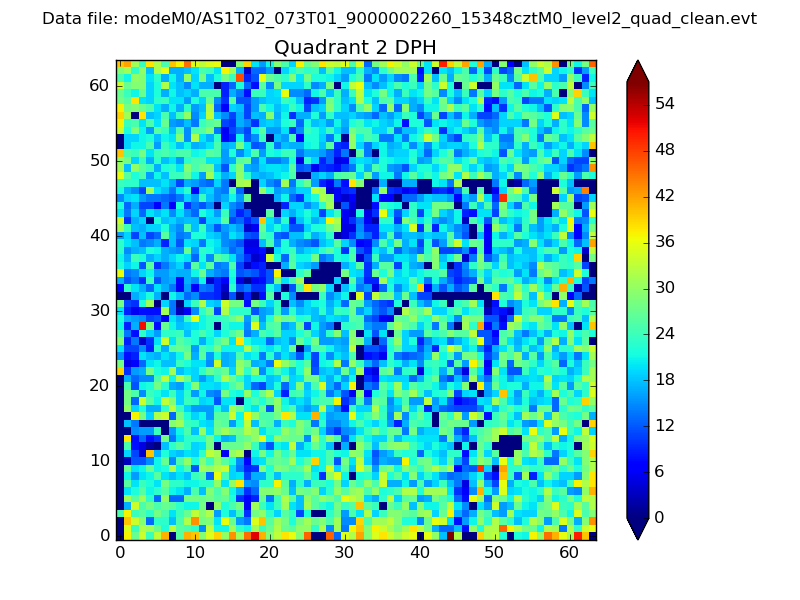
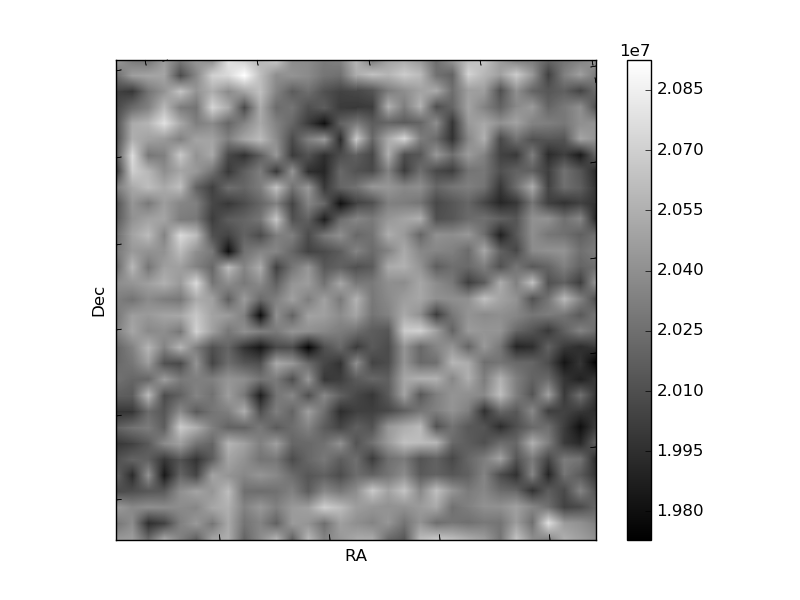
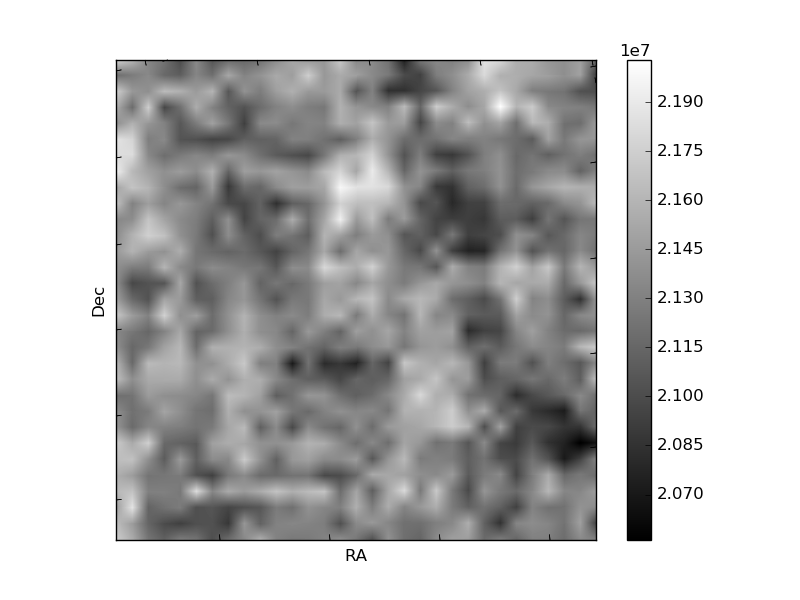
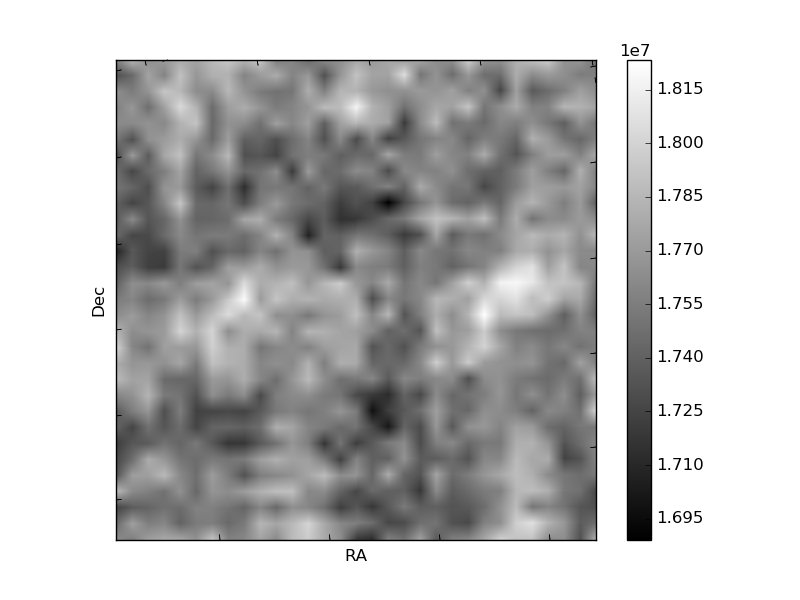
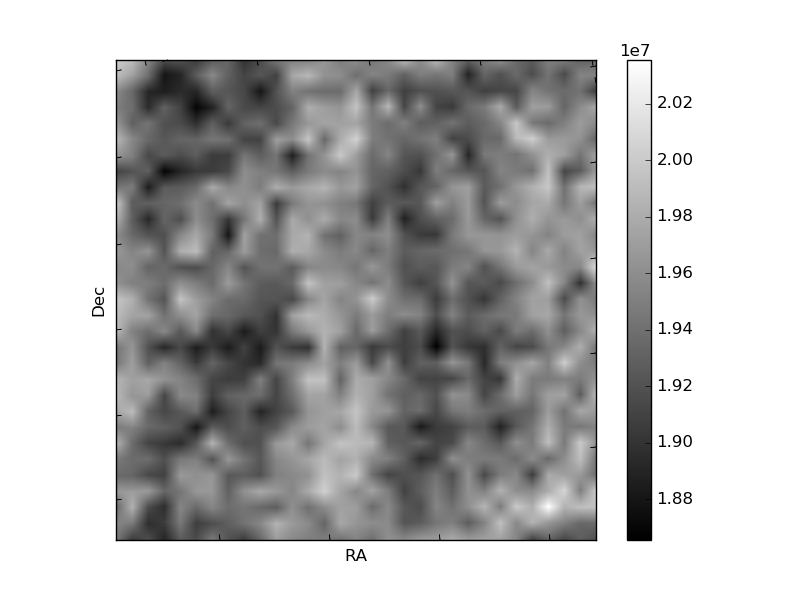
Histogram calculated using DETX and DETY for each event in the final _common_clean file
| Quadrant A | 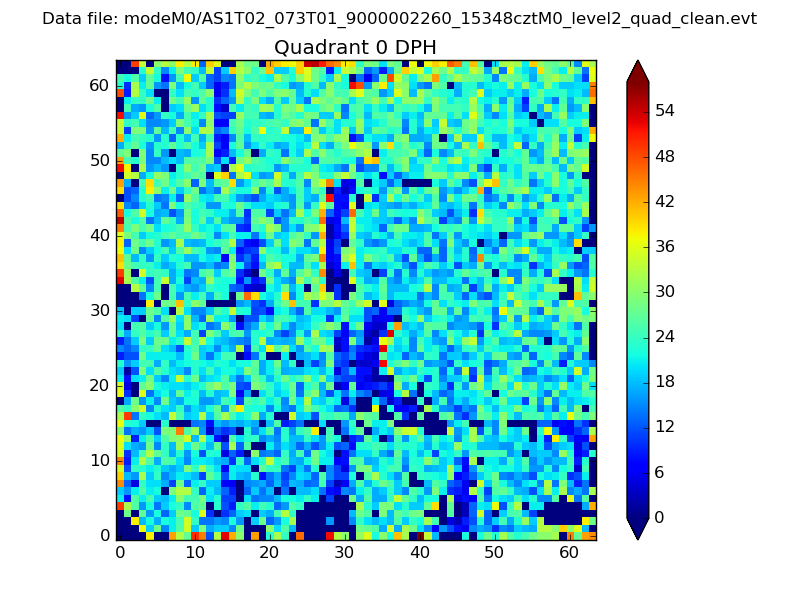 |
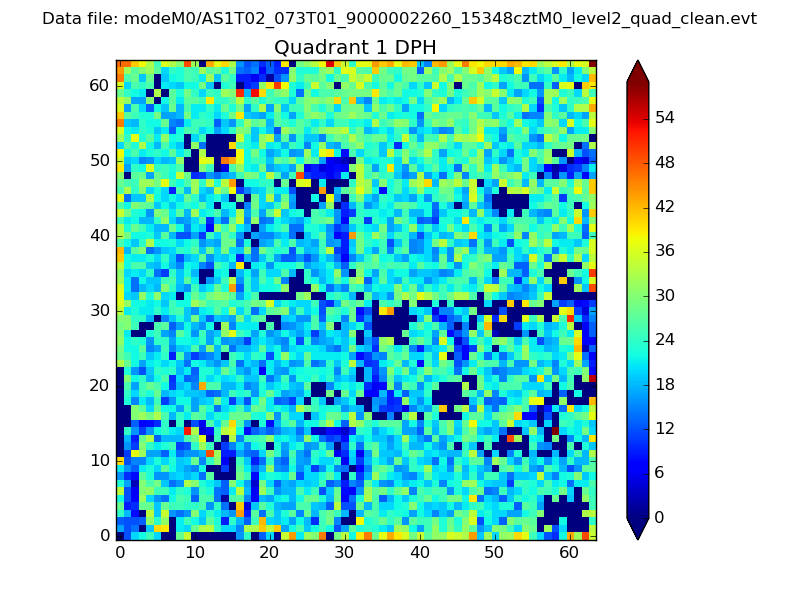 |
Quadrant B |
|---|---|---|---|
| Quadrant D | 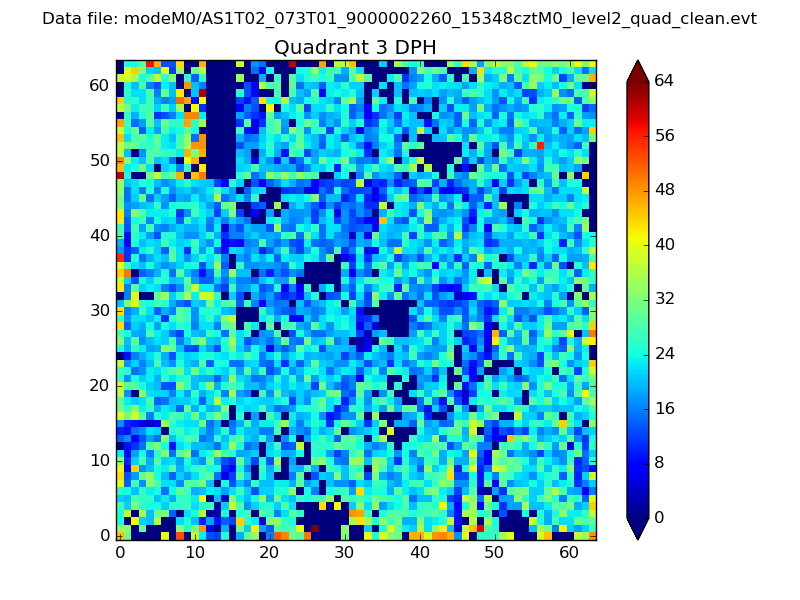 |
 |
Quadrant C |
| Plot type | Count rate plots | Images |
|---|---|---|
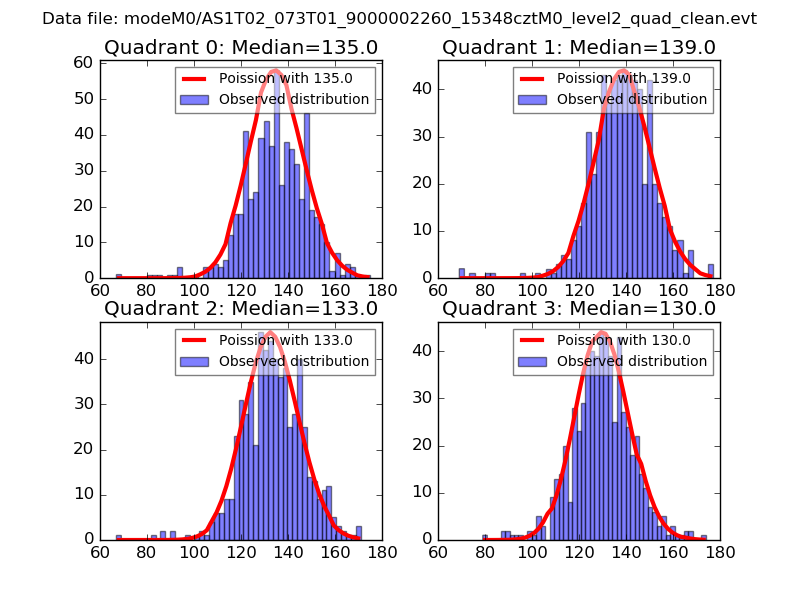
| Comparison with Poisson distribution Blue bars denote a histogram of data divided into 1 sec bins. Red curve is a Poisson curve with rate = median count rate of data. |
 |
 |
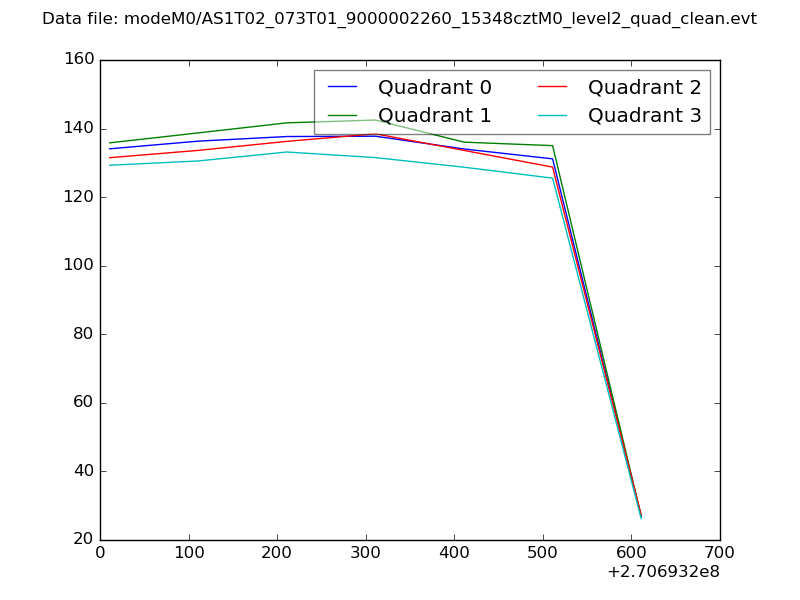
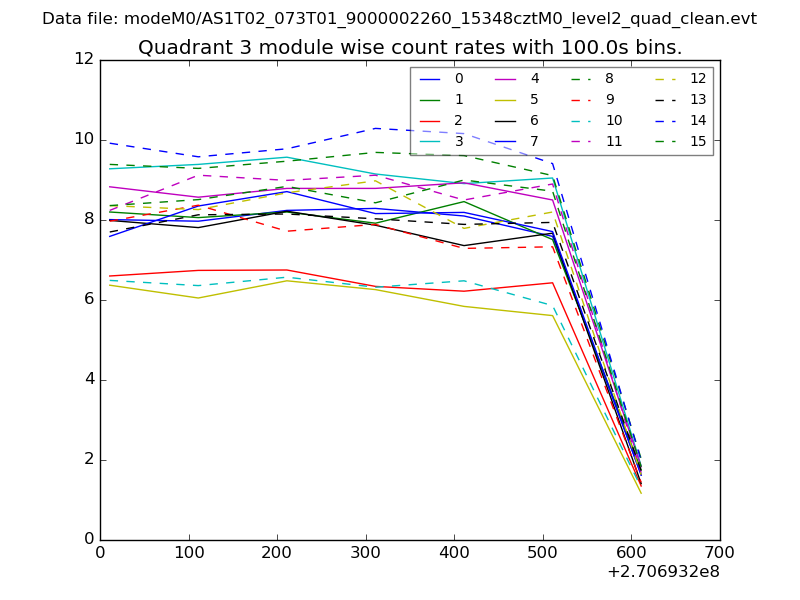
| Quadrant-wise count rates Data is divided into 100 sec bins |
 |
|
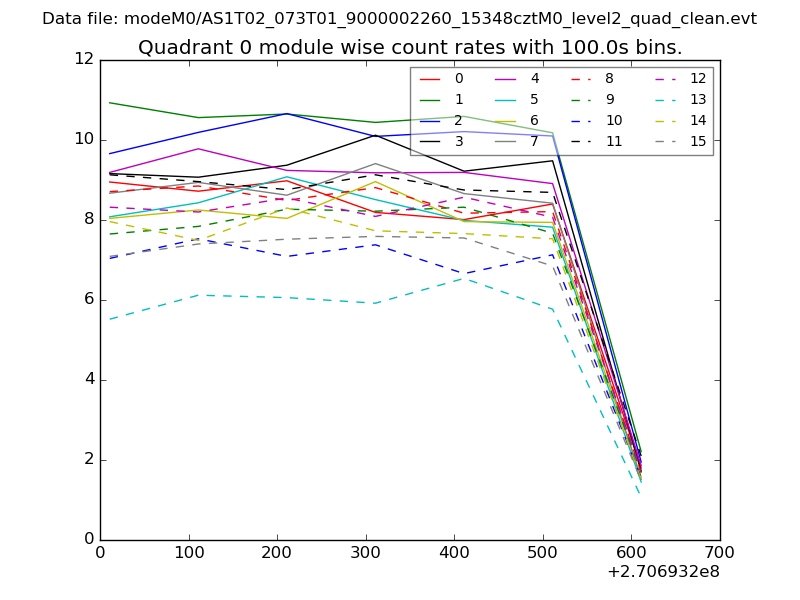
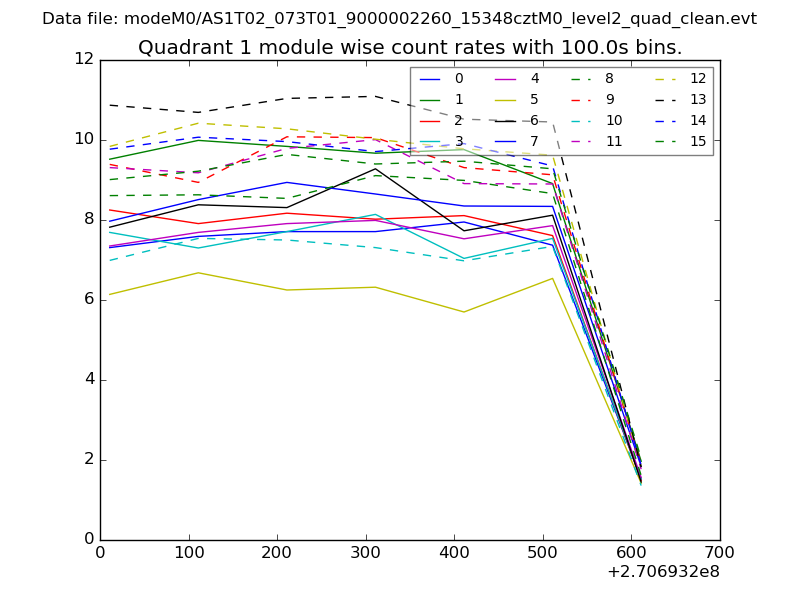
| Module-wise count rates for Quadrant A Data is divided into 100 sec bins |
 |
 |
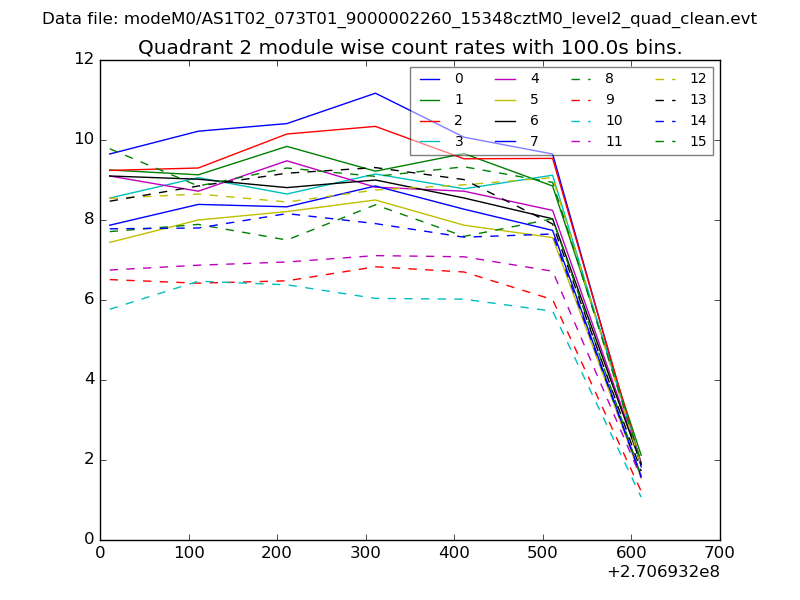
| Module-wise count rates for Quadrant B Data is divided into 100 sec bins |
 |
 |
| Module-wise count rates for Quadrant C Data is divided into 100 sec bins |
 |
 |
| Module-wise count rates for Quadrant D Data is divided into 100 sec bins |
 |
 |
| Parameter | Plot |
|---|---|
| CZT HV Monitor | 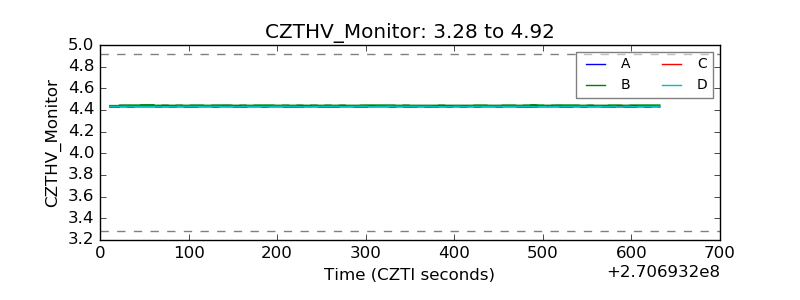 |
| D_VDD | 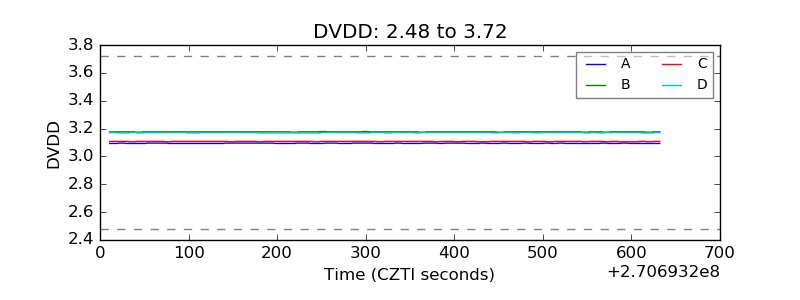 |
| Temperature 1 | 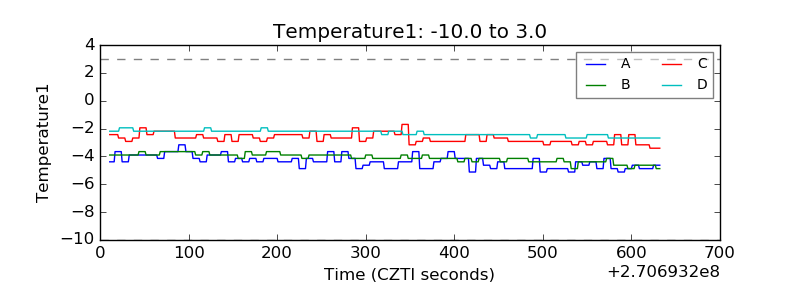 |
| Veto HV Monitor | 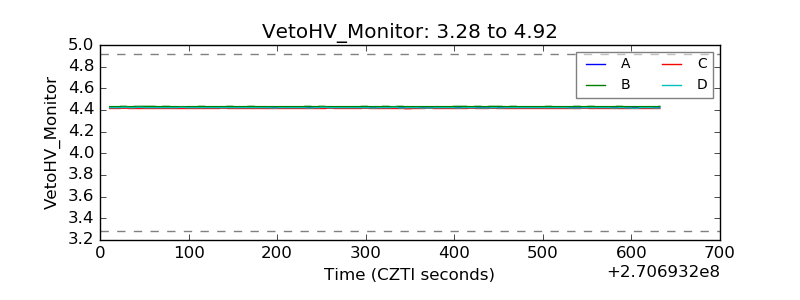 |
| Veto LLD | 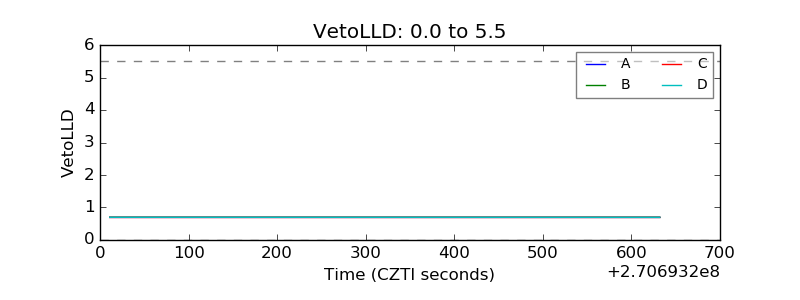 |
| Alpha Counter | 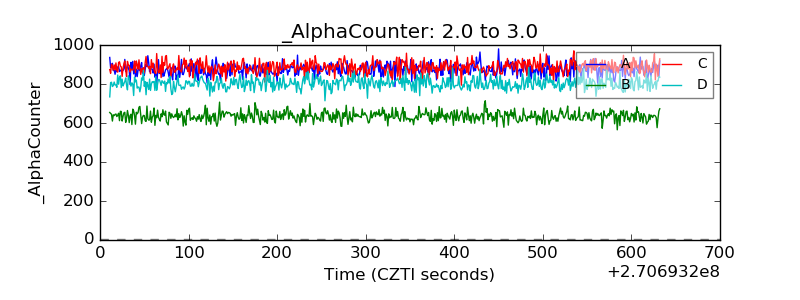 |
| _CPM_Rate |  |
| CZT Counter | 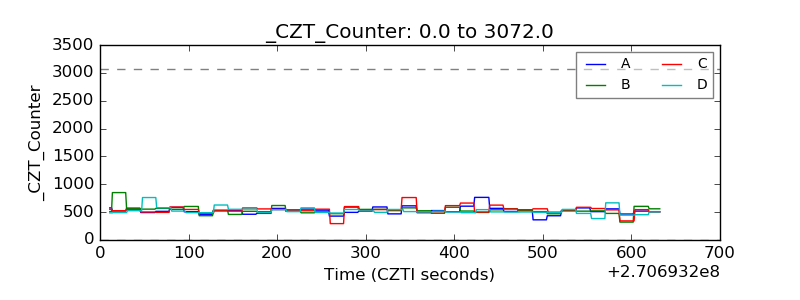 |
| +2.5 Volts monitor | 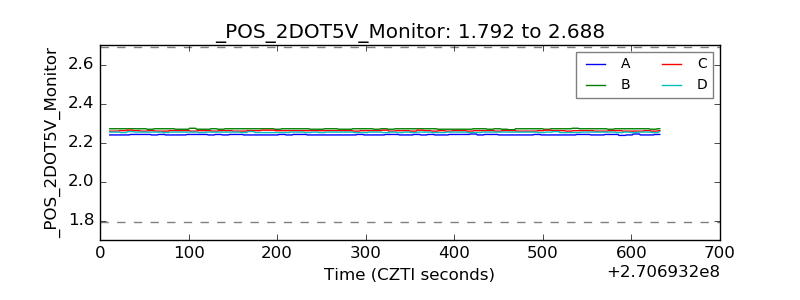 |
| +5 Volts monitor |  |
| _ROLL_ROT | 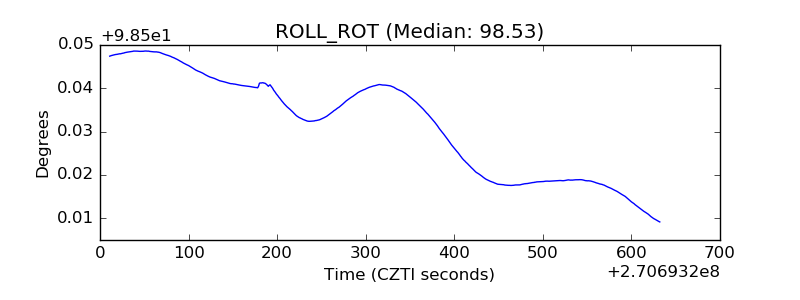 |
| _Roll_DEC | 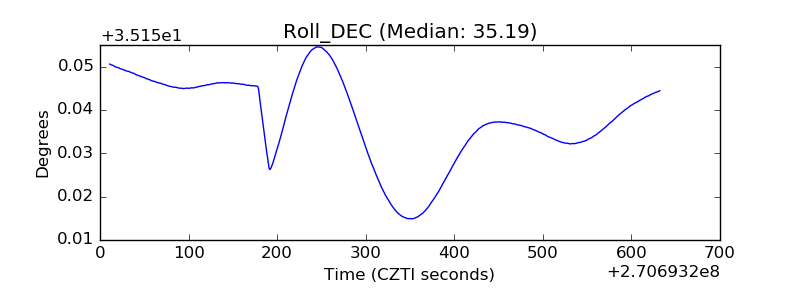 |
| _Roll_RA | 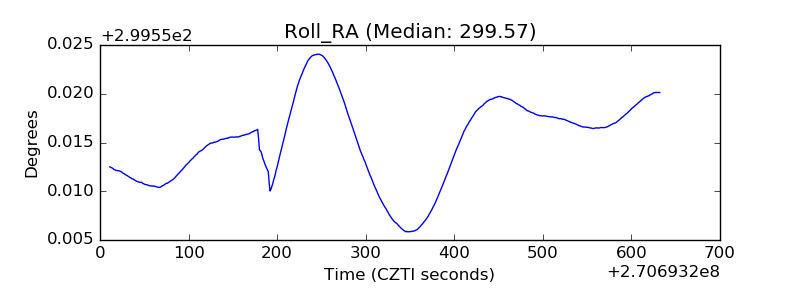 |
| Veto Counter | 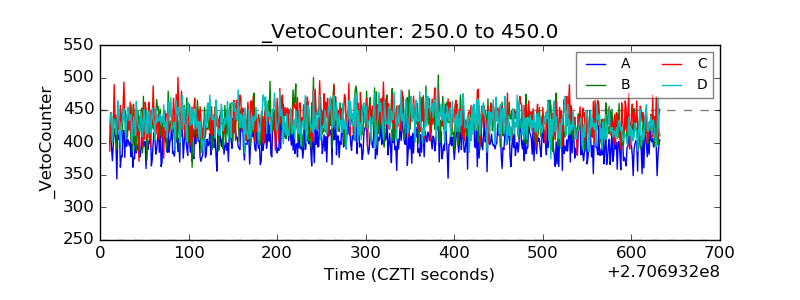 |