| Param | Original file | Final file |
|---|---|---|
| Filename | modeM0/AS1A04_126T01_9000002262cztM0_level2.fits | modeM0/AS1A04_126T01_9000002262cztM0_level2_quad_clean.evt |
| Size (bytes) | 859,726,080 | 891,708,480 |
| Size | 819.9 MB | 850.4 MB |
| Events in quadrant A | 5,248,782 | 5,425,689 |
| Events in quadrant B | 4,985,322 | 5,372,076 |
| Events in quadrant C | 5,115,306 | 5,209,465 |
| Events in quadrant D | 4,445,908 | 4,758,670 |
| Mode M9 | |||
|---|---|---|---|
| Quadrant | BADHDUFLAG | Total packets | Discarded packets |
| A | 0 | 134 | 0 |
| B | 0 | 134 | 0 |
| C | 0 | 134 | 0 |
| D | 0 | 134 | 0 |
| Mode M0 | |||
|---|---|---|---|
| Quadrant | BADHDUFLAG | Total packets | Discarded packets |
| A | 0 | 188077 | 0 |
| B | 0 | 205520 | 0 |
| C | 0 | 199092 | 0 |
| D | 0 | 209541 | 0 |
| Mode SS | |||
|---|---|---|---|
| Quadrant | BADHDUFLAG | Total packets | Discarded packets |
| A | 0 | 1852 | 0 |
| B | 0 | 1852 | 0 |
| C | 0 | 1852 | 0 |
| D | 0 | 1852 | 0 |
| Quadrant | Total seconds | Saturated seconds | Saturation percentage |
|---|---|---|---|
| A | 91047 | 760 | 0.834734% |
| B | 91047 | 1869 | 2.052786% |
| C | 91047 | 1123 | 1.233429% |
| D | 91047 | 2042 | 2.242798% |
Noise dominated data is calculated using 1-second bins in cleaned event files. If a bin has >2000 counts, and if more than 50% of those come from <1% of pixels, then it is considered to be noise-dominated and hence unusable.
| Quadrant | # 1 sec bins | Bins with >0 counts | Bins with >2000 counts | High rate bins dominated by noise | Noise dominated (total time) | Noise dominated (detector-on time) | Marked lightcurve |
|---|---|---|---|---|---|---|---|
| A | 104357 | 91039 | 0 | 0 | 0.00% | 0.00% |  |
| B | 104357 | 91027 | 0 | 0 | 0.00% | 0.00% |  |
| C | 104357 | 91035 | 0 | 0 | 0.00% | 0.00% |  |
| D | 104357 | 91033 | 0 | 0 | 0.00% | 0.00% |  |
Top three noisy pixels from each quadrant. If the there are fewer than three noisy pixels in the level2.evt file, extra rows are filled as -1
| Pixel properties | Quadrant properties | ||||||
|---|---|---|---|---|---|---|---|
| Quadrant | DetID | PixID | Counts | Sigma | Mean | Median | Sigma |
| A | 0 | 29 | 5066 | 11.2 | 1366 | 1279 | 338.2 |
| A | 7 | 110 | 4185 | 8.59 | 1366 | 1279 | 338.2 |
| A | 0 | 30 | 3989 | 8.01 | 1366 | 1279 | 338.2 |
| B | 2 | 9 | 4048 | 10.87 | 1319 | 1258 | 256.6 |
| B | 14 | 254 | 3449 | 8.54 | 1319 | 1258 | 256.6 |
| B | 2 | 8 | 3393 | 8.32 | 1319 | 1258 | 256.6 |
| C | 1 | 81 | 3858 | 7.46 | 1351 | 1256 | 348.6 |
| C | 1 | 80 | 3854 | 7.45 | 1351 | 1256 | 348.6 |
| C | 12 | 241 | 3602 | 6.73 | 1351 | 1256 | 348.6 |
| D | 3 | 14 | 3232 | 6.05 | 1270 | 1156 | 342.9 |
| D | 7 | 3 | 3171 | 5.88 | 1270 | 1156 | 342.9 |
| D | 15 | 46 | 3150 | 5.82 | 1270 | 1156 | 342.9 |
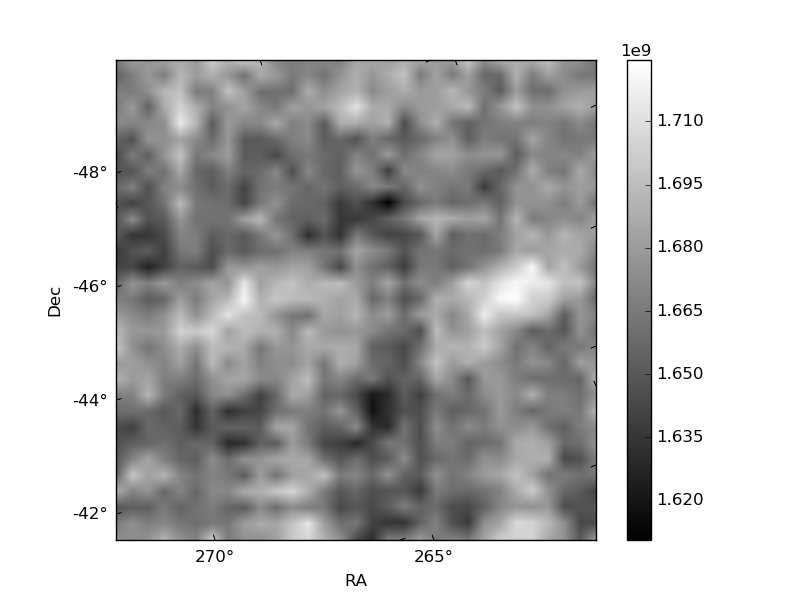
Histogram calculated using DETX and DETY for each event in the final _common_clean file
| Quadrant A | 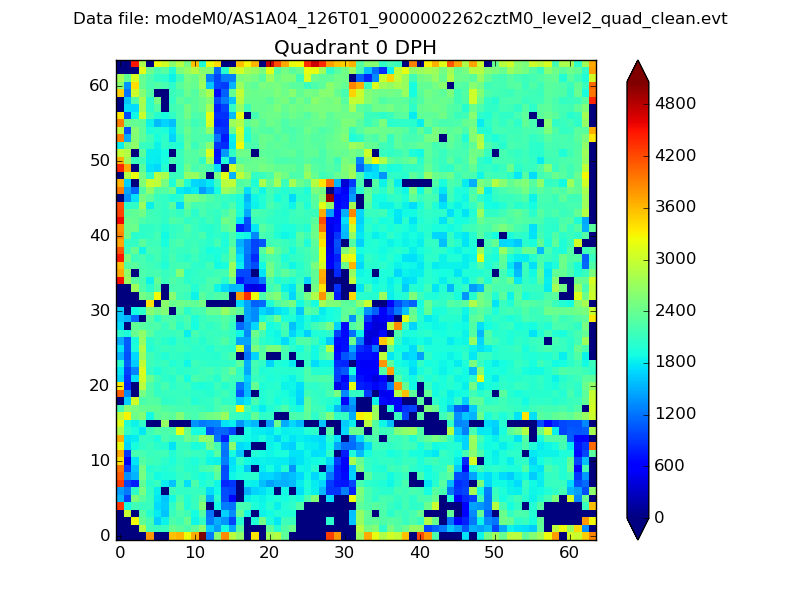 |
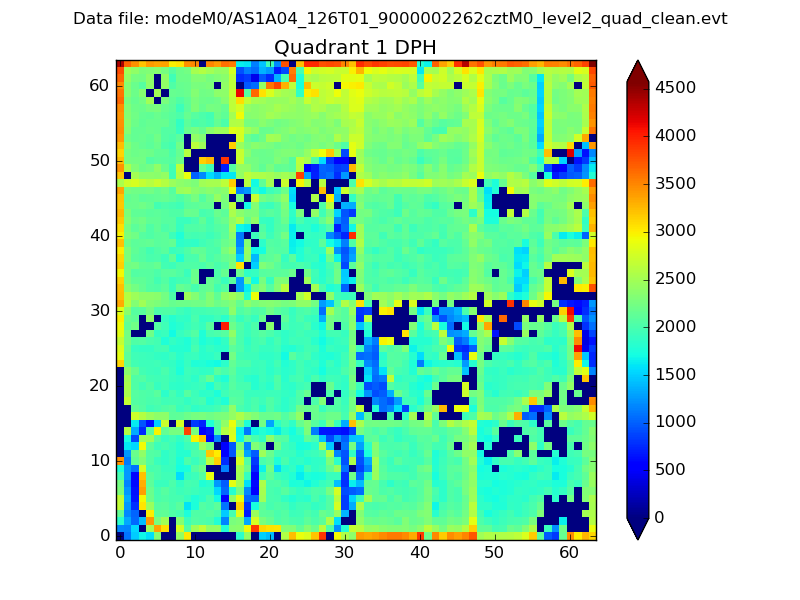 |
Quadrant B |
|---|---|---|---|
| Quadrant D |  |
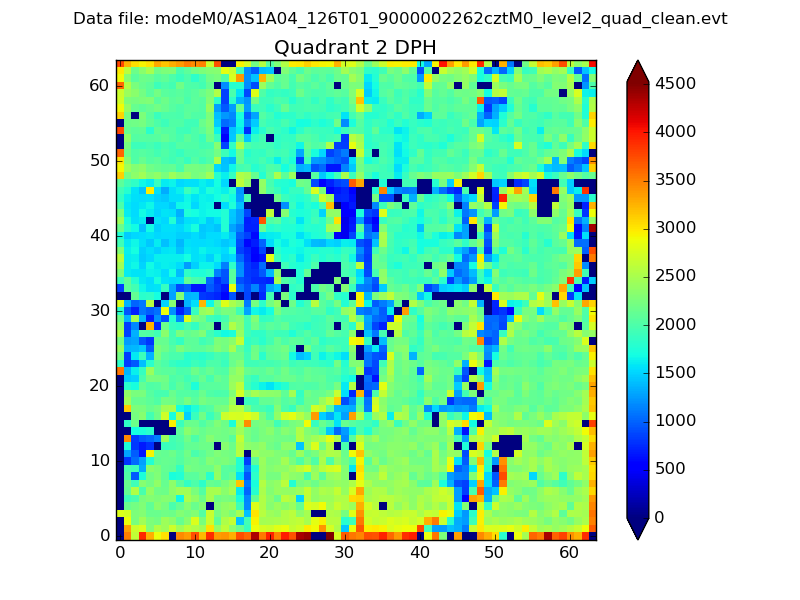 |
Quadrant C |
| Plot type | Count rate plots | Images |
|---|---|---|
| Comparison with Poisson distribution Blue bars denote a histogram of data divided into 1 sec bins. Red curve is a Poisson curve with rate = median count rate of data. |
 |
 |
| Quadrant-wise count rates Data is divided into 100 sec bins |
 |
|
| Module-wise count rates for Quadrant A Data is divided into 100 sec bins |
 |
 |
| Module-wise count rates for Quadrant B Data is divided into 100 sec bins |
 |
 |
| Module-wise count rates for Quadrant C Data is divided into 100 sec bins |
 |
 |
| Module-wise count rates for Quadrant D Data is divided into 100 sec bins |
 |
 |
| Parameter | Plot |
|---|---|
| CZT HV Monitor |  |
| D_VDD |  |
| Temperature 1 |  |
| Veto HV Monitor |  |
| Veto LLD |  |
| Alpha Counter |  |
| _CPM_Rate |  |
| CZT Counter |  |
| +2.5 Volts monitor |  |
| +5 Volts monitor |  |
| _ROLL_ROT |  |
| _Roll_DEC |  |
| _Roll_RA |  |
| Veto Counter | 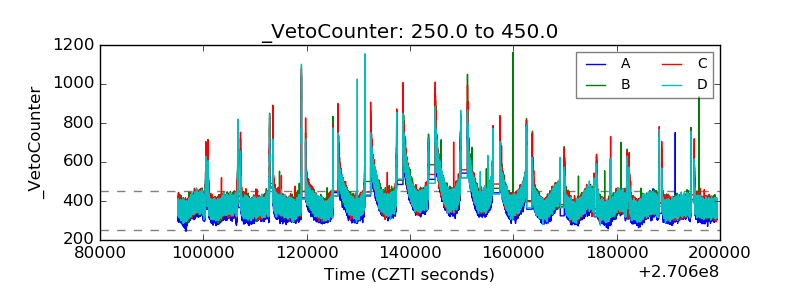 |