| Param | Original file | Final file |
|---|---|---|
| Filename | modeM0/AS1A04_126T01_9000002262_15347cztM0_level2.evt | modeM0/AS1A04_126T01_9000002262_15347cztM0_level2_quad_clean.evt |
| Size (bytes) | 61,729,920 | 16,162,560 |
| Size | 58.9 MB | 15.4 MB |
| Events in quadrant A | 425,942 | 102,338 |
| Events in quadrant B | 451,132 | 104,760 |
| Events in quadrant C | 507,960 | 102,363 |
| Events in quadrant D | 410,024 | 99,406 |
| Mode M0 | |||
|---|---|---|---|
| Quadrant | BADHDUFLAG | Total packets | Discarded packets |
| A | 0 | 2089 | 1 |
| B | 0 | 2091 | 0 |
| C | 0 | 2136 | 0 |
| D | 0 | 2096 | 0 |
| Mode SS | |||
|---|---|---|---|
| Quadrant | BADHDUFLAG | Total packets | Discarded packets |
| A | 0 | 22 | 0 |
| B | 0 | 22 | 0 |
| C | 0 | 22 | 0 |
| D | 0 | 22 | 0 |
| Quadrant | Total seconds | Saturated seconds | Saturation percentage |
|---|---|---|---|
| A | 1039 | 0 | 0.000000% |
| B | 1039 | 1 | 0.096246% |
| C | 1039 | 0 | 0.000000% |
| D | 1039 | 1 | 0.096246% |
Noise dominated data is calculated using 1-second bins in cleaned event files. If a bin has >2000 counts, and if more than 50% of those come from <1% of pixels, then it is considered to be noise-dominated and hence unusable.
| Quadrant | # 1 sec bins | Bins with >0 counts | Bins with >2000 counts | High rate bins dominated by noise | Noise dominated (total time) | Noise dominated (detector-on time) | Marked lightcurve |
|---|---|---|---|---|---|---|---|
| A | 1040 | 1040 | 0 | 0 | 0.00% | 0.00% | 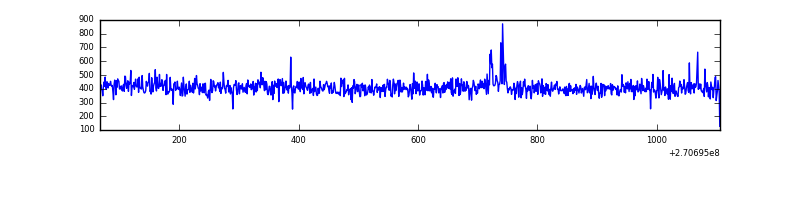 |
| B | 1040 | 1040 | 0 | 0 | 0.00% | 0.00% | 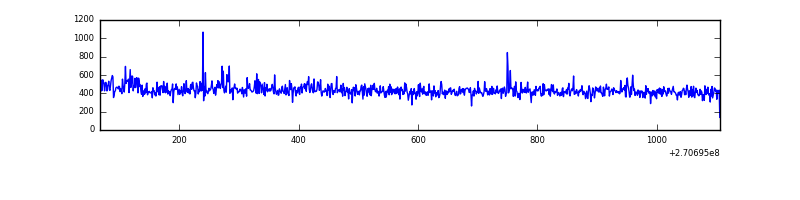 |
| C | 1040 | 1040 | 0 | 0 | 0.00% | 0.00% | 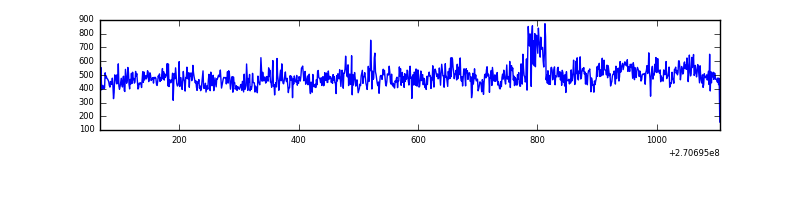 |
| D | 1040 | 1040 | 0 | 0 | 0.00% | 0.00% | 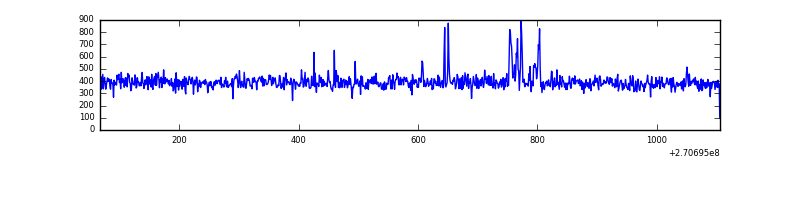 |
Top three noisy pixels from each quadrant. If the there are fewer than three noisy pixels in the level2.evt file, extra rows are filled as -1
| Pixel properties | Quadrant properties | ||||||
|---|---|---|---|---|---|---|---|
| Quadrant | DetID | PixID | Counts | Sigma | Mean | Median | Sigma |
| A | 9 | 143 | 5274 | 208.13 | 109 | 106 | 24.8 |
| A | 0 | 226 | 879 | 31.13 | 109 | 106 | 24.8 |
| A | 3 | 137 | 835 | 29.36 | 109 | 106 | 24.8 |
| B | 0 | 205 | 12208 | 511.57 | 112 | 109 | 23.7 |
| B | 12 | 111 | 2630 | 106.59 | 112 | 109 | 23.7 |
| B | 11 | 111 | 2221 | 89.3 | 112 | 109 | 23.7 |
| C | 3 | 233 | 55589 | 2058.36 | 108 | 108 | 27.0 |
| C | 7 | 247 | 29277 | 1082.18 | 108 | 108 | 27.0 |
| C | 13 | 61 | 806 | 25.9 | 108 | 108 | 27.0 |
| D | 12 | 110 | 6934 | 246.73 | 105 | 102 | 27.7 |
| D | 2 | 234 | 3812 | 133.98 | 105 | 102 | 27.7 |
| D | 13 | 238 | 3256 | 113.9 | 105 | 102 | 27.7 |
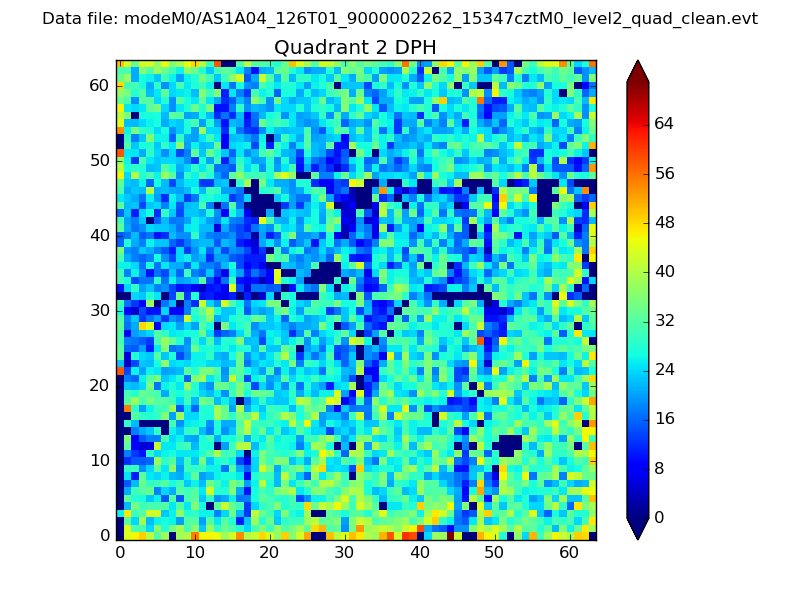
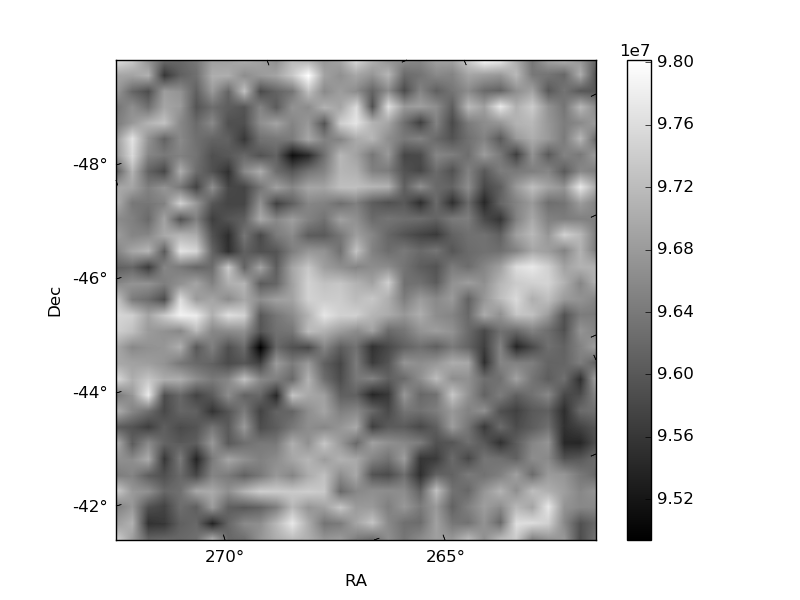
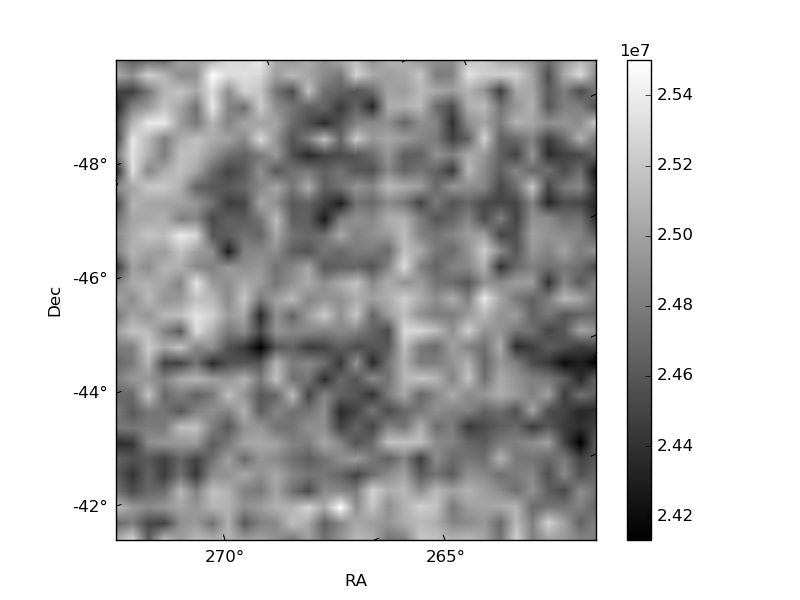
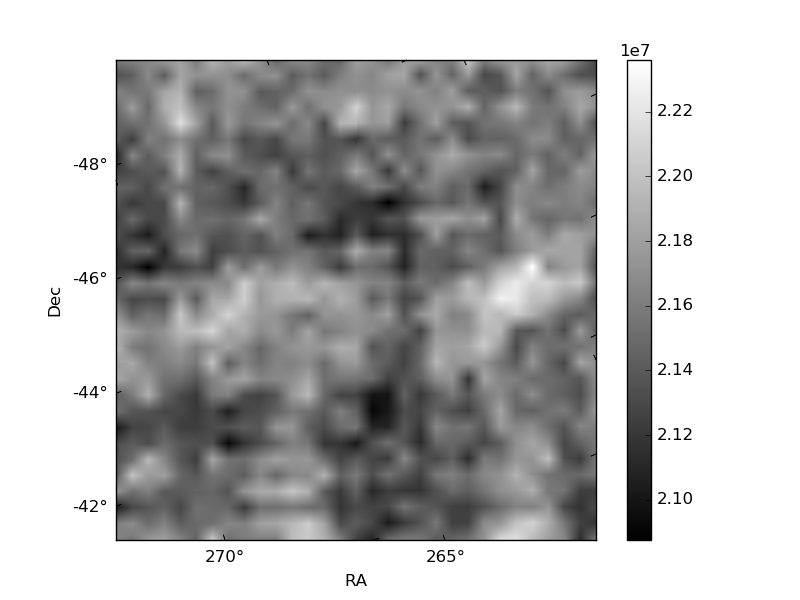
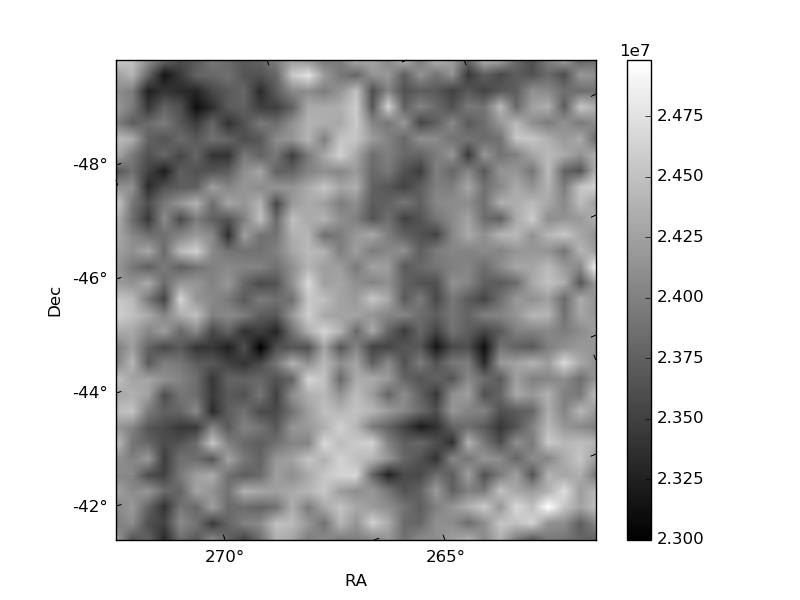
Histogram calculated using DETX and DETY for each event in the final _common_clean file
| Quadrant A | 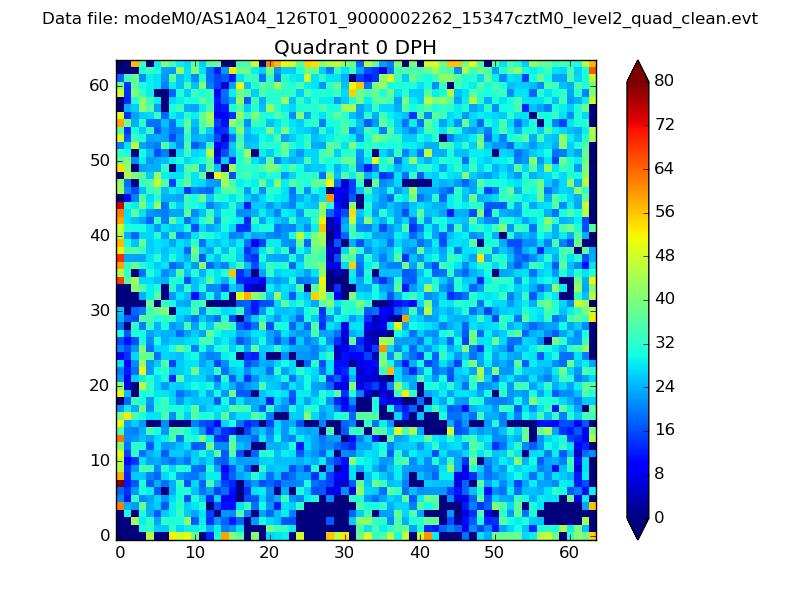 |
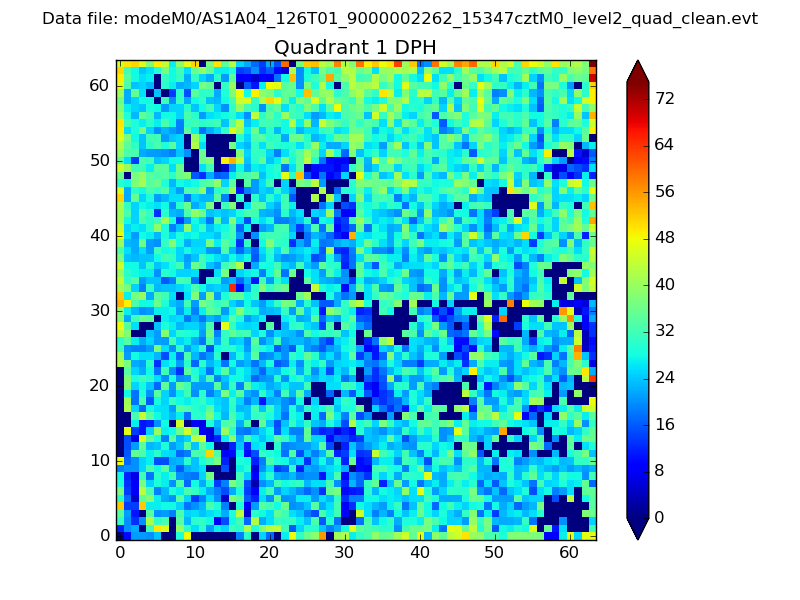 |
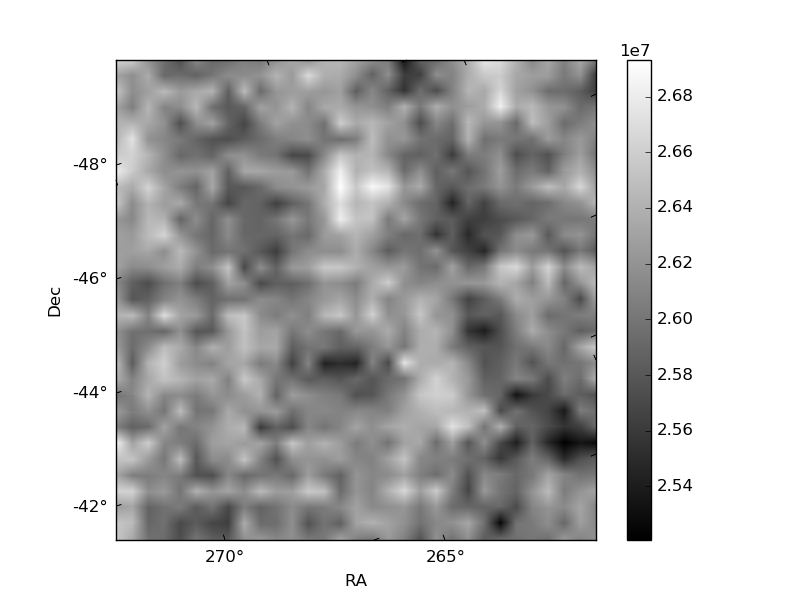
Quadrant B |
|---|---|---|---|
| Quadrant D | 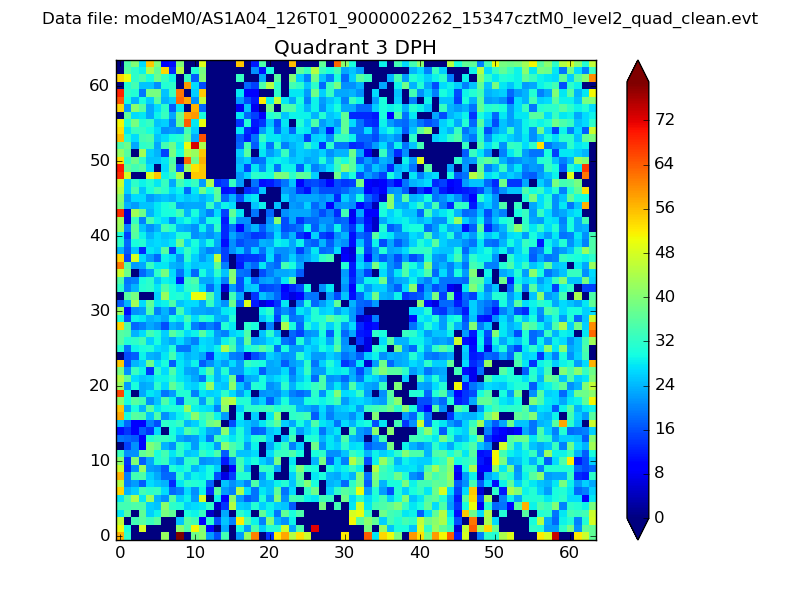 |
 |
Quadrant C |
| Plot type | Count rate plots | Images |
|---|---|---|
| Comparison with Poisson distribution Blue bars denote a histogram of data divided into 1 sec bins. Red curve is a Poisson curve with rate = median count rate of data. |
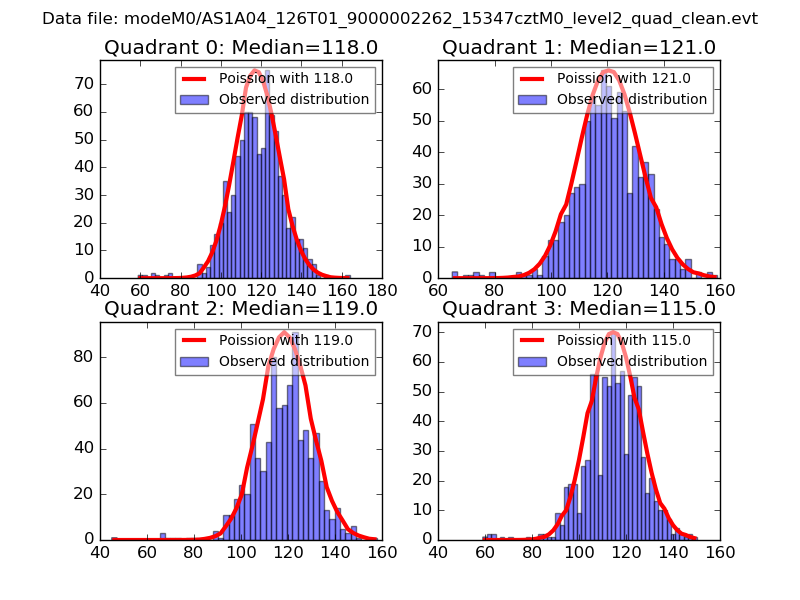 |
 |
| Quadrant-wise count rates Data is divided into 100 sec bins |
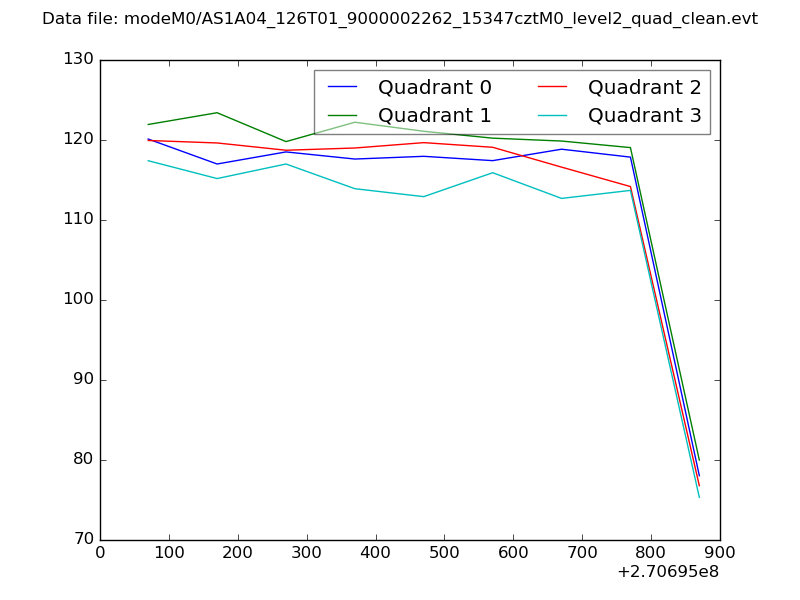 |
|
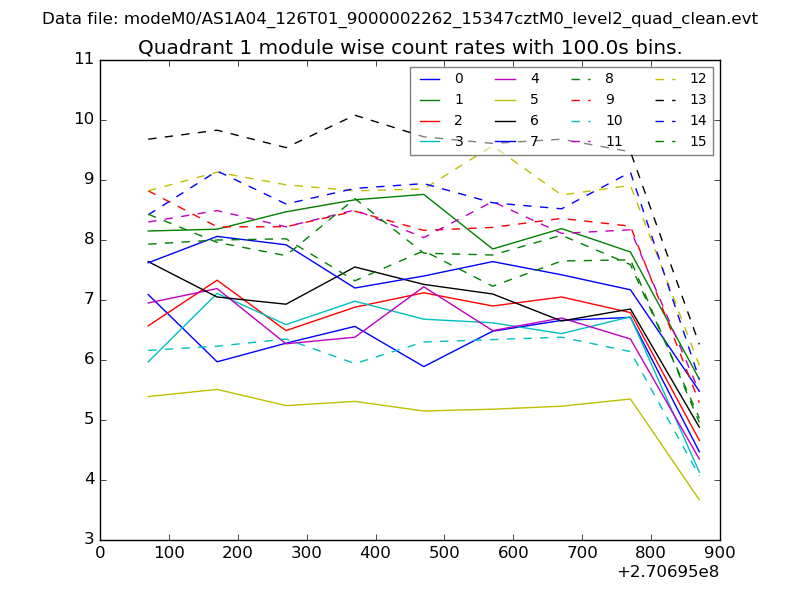
| Module-wise count rates for Quadrant A Data is divided into 100 sec bins |
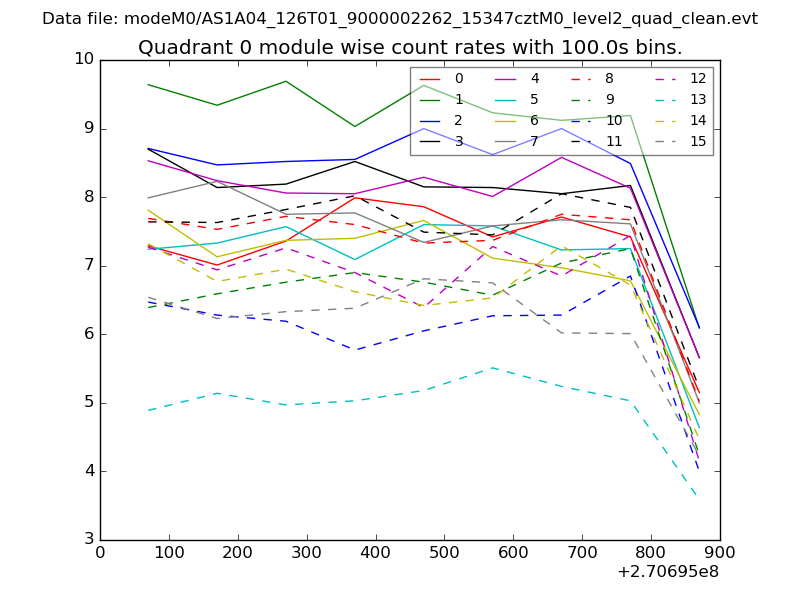 |
 |
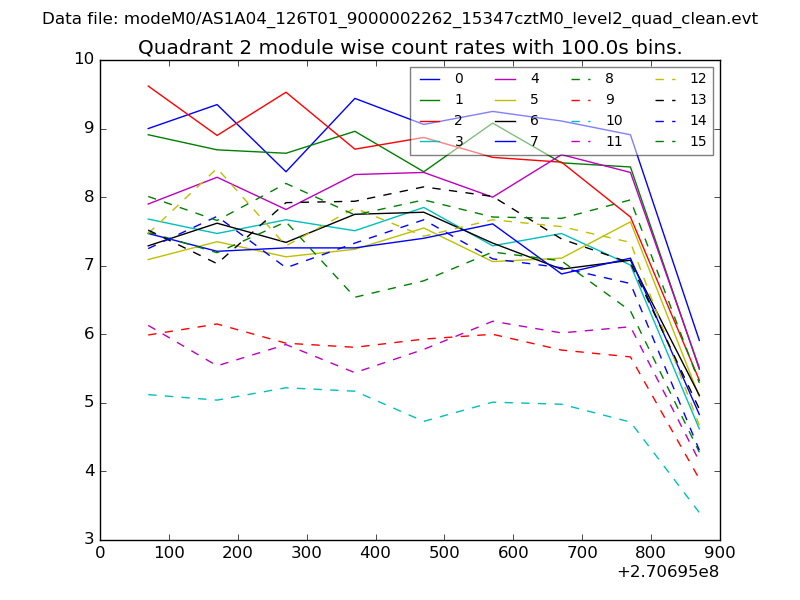
| Module-wise count rates for Quadrant B Data is divided into 100 sec bins |
 |
 |
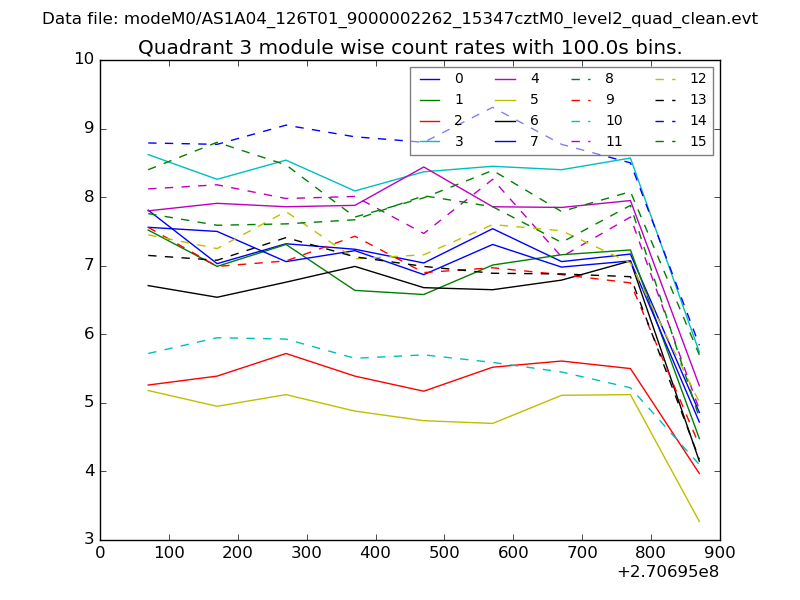
| Module-wise count rates for Quadrant C Data is divided into 100 sec bins |
 |
 |
| Module-wise count rates for Quadrant D Data is divided into 100 sec bins |
 |
 |
| Parameter | Plot |
|---|---|
| CZT HV Monitor | 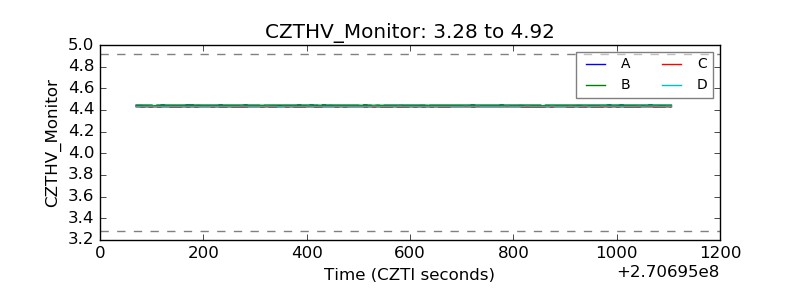 |
| D_VDD | 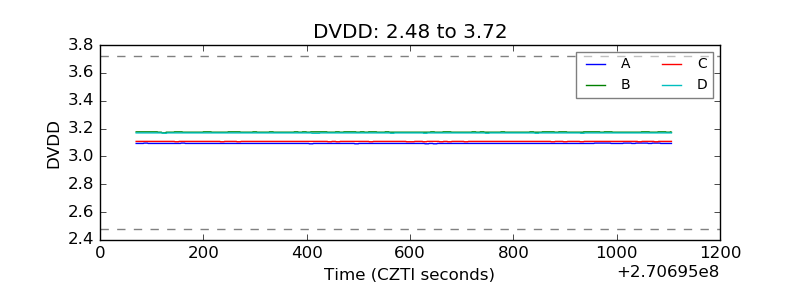 |
| Temperature 1 | 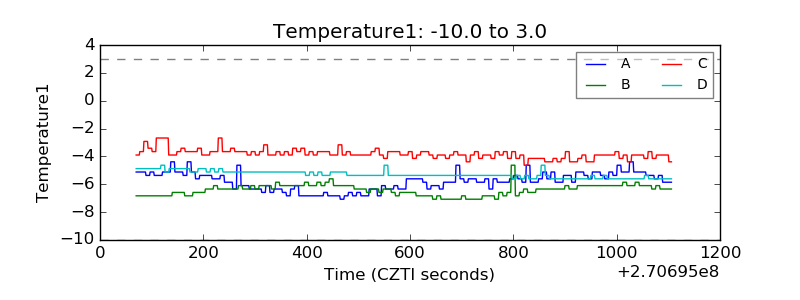 |
| Veto HV Monitor | 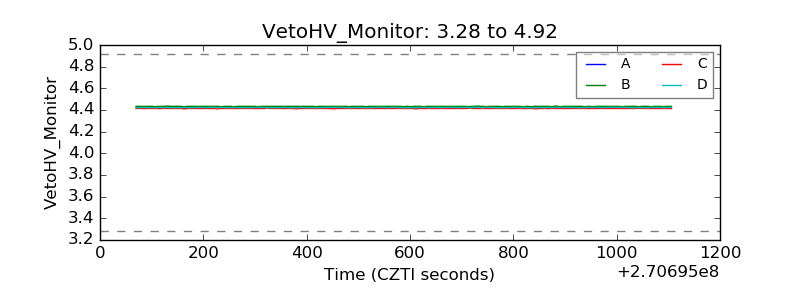 |
| Veto LLD | 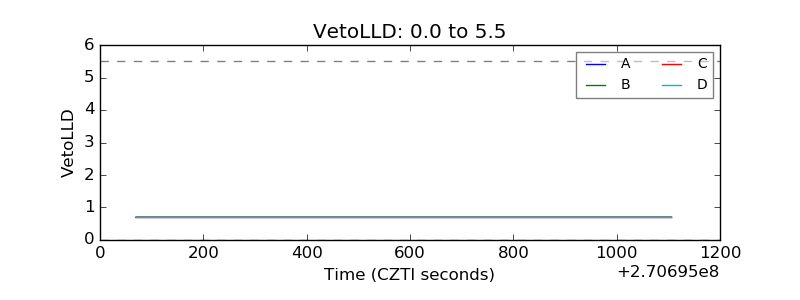 |
| Alpha Counter | 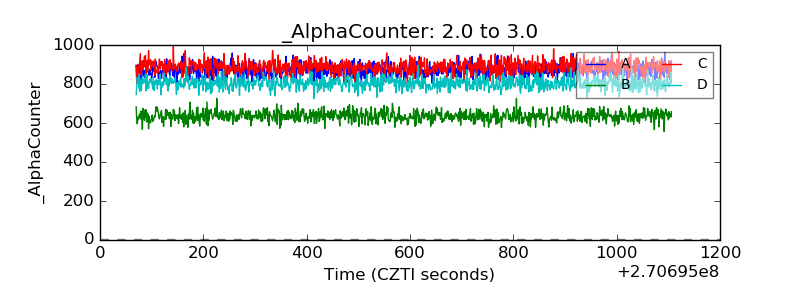 |
| _CPM_Rate | 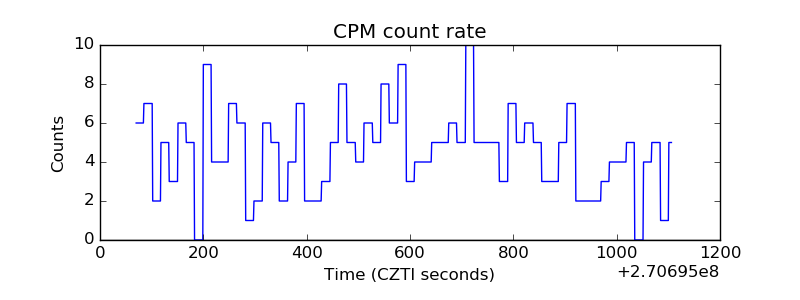 |
| CZT Counter | 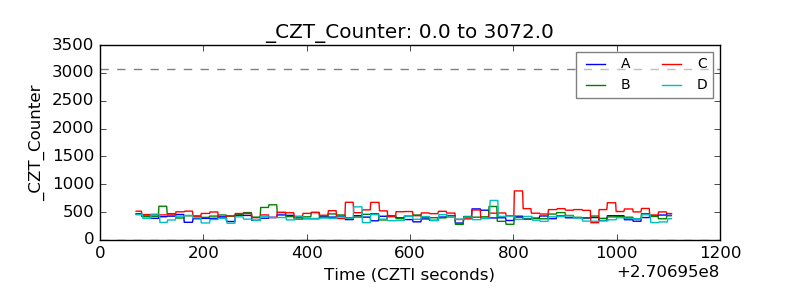 |
| +2.5 Volts monitor |  |
| +5 Volts monitor |  |
| _ROLL_ROT | 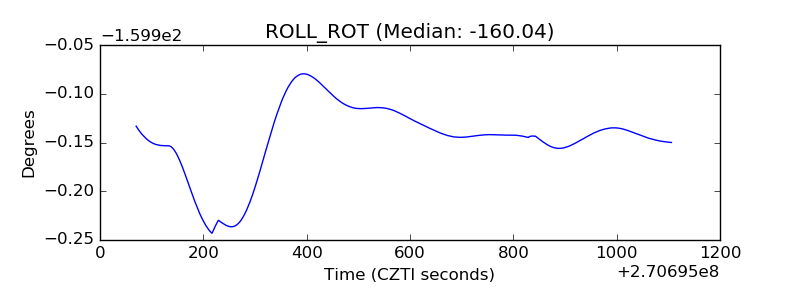 |
| _Roll_DEC |  |
| _Roll_RA | 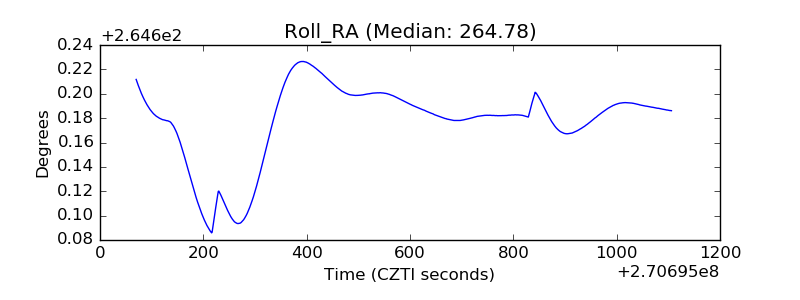 |
| Veto Counter | 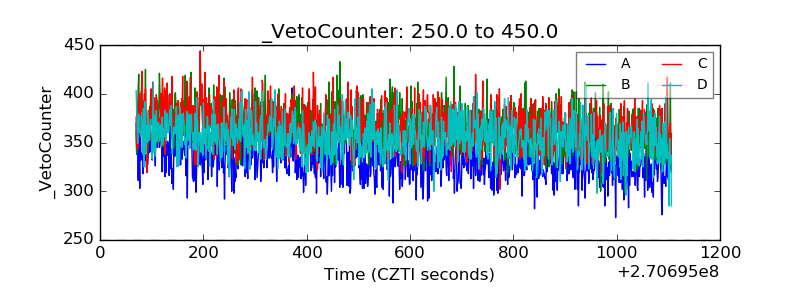 |