| Param | Original file | Final file |
|---|---|---|
| Filename | modeM0/AS1A04_126T01_9000002262_15356cztM0_level2.evt | modeM0/AS1A04_126T01_9000002262_15356cztM0_level2_quad_clean.evt |
| Size (bytes) | 482,042,880 | 120,942,720 |
| Size | 459.7 MB | 115.3 MB |
| Events in quadrant A | 3,316,708 | 821,853 |
| Events in quadrant B | 3,552,957 | 823,227 |
| Events in quadrant C | 3,274,469 | 807,752 |
| Events in quadrant D | 4,022,437 | 766,002 |
| Mode M9 | |||
|---|---|---|---|
| Quadrant | BADHDUFLAG | Total packets | Discarded packets |
| A | 0 | 13 | 0 |
| B | 0 | 13 | 0 |
| C | 0 | 13 | 0 |
| D | 0 | 13 | 0 |
| Mode M0 | |||
|---|---|---|---|
| Quadrant | BADHDUFLAG | Total packets | Discarded packets |
| A | 0 | 14019 | 2 |
| B | 0 | 14649 | 1 |
| C | 0 | 13816 | 1 |
| D | 0 | 16175 | 1 |
| Mode SS | |||
|---|---|---|---|
| Quadrant | BADHDUFLAG | Total packets | Discarded packets |
| A | 0 | 128 | 0 |
| B | 0 | 128 | 0 |
| C | 0 | 128 | 0 |
| D | 0 | 128 | 0 |
| Quadrant | Total seconds | Saturated seconds | Saturation percentage |
|---|---|---|---|
| A | 6371 | 62 | 0.973160% |
| B | 6371 | 122 | 1.914927% |
| C | 6371 | 43 | 0.674933% |
| D | 6371 | 271 | 4.253649% |
Noise dominated data is calculated using 1-second bins in cleaned event files. If a bin has >2000 counts, and if more than 50% of those come from <1% of pixels, then it is considered to be noise-dominated and hence unusable.
| Quadrant | # 1 sec bins | Bins with >0 counts | Bins with >2000 counts | High rate bins dominated by noise | Noise dominated (total time) | Noise dominated (detector-on time) | Marked lightcurve |
|---|---|---|---|---|---|---|---|
| A | 7667 | 6372 | 10 | 10 | 0.13% | 0.16% | 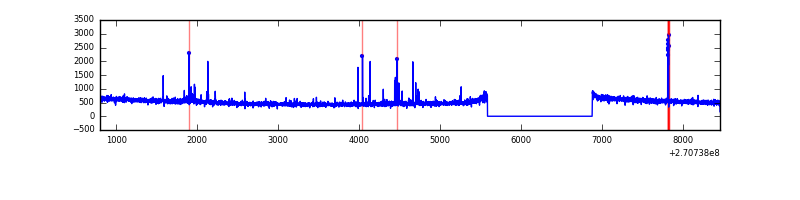 |
| B | 7667 | 6373 | 28 | 28 | 0.37% | 0.44% | 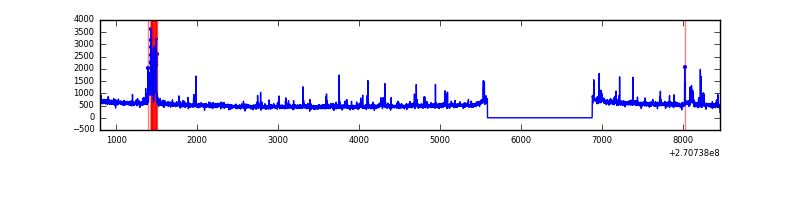 |
| C | 7667 | 6373 | 0 | 0 | 0.00% | 0.00% | 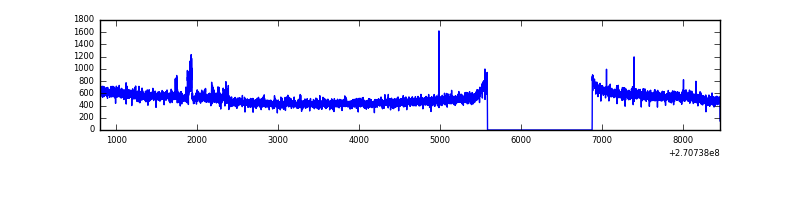 |
| D | 7667 | 6372 | 222 | 222 | 2.90% | 3.48% | 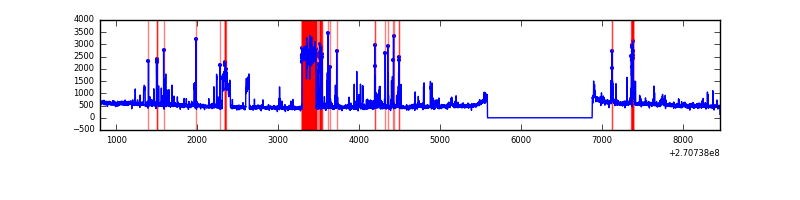 |
Top three noisy pixels from each quadrant. If the there are fewer than three noisy pixels in the level2.evt file, extra rows are filled as -1
| Pixel properties | Quadrant properties | ||||||
|---|---|---|---|---|---|---|---|
| Quadrant | DetID | PixID | Counts | Sigma | Mean | Median | Sigma |
| A | 9 | 143 | 63521 | 374.37 | 838 | 824 | 167.5 |
| A | 4 | 2 | 26524 | 153.46 | 838 | 824 | 167.5 |
| A | 0 | 226 | 7636 | 40.68 | 838 | 824 | 167.5 |
| B | 10 | 16 | 197714 | 1250.73 | 828 | 810 | 157.4 |
| B | 0 | 219 | 25651 | 157.79 | 828 | 810 | 157.4 |
| B | 0 | 189 | 21943 | 134.24 | 828 | 810 | 157.4 |
| C | 3 | 233 | 178591 | 985.52 | 793 | 798 | 180.4 |
| C | 13 | 61 | 5629 | 26.78 | 793 | 798 | 180.4 |
| C | 7 | 247 | 4333 | 19.59 | 793 | 798 | 180.4 |
| D | 1 | 255 | 393622 | 2044.48 | 798 | 776 | 192.1 |
| D | 2 | 33 | 197265 | 1022.58 | 798 | 776 | 192.1 |
| D | 1 | 20 | 175112 | 907.29 | 798 | 776 | 192.1 |
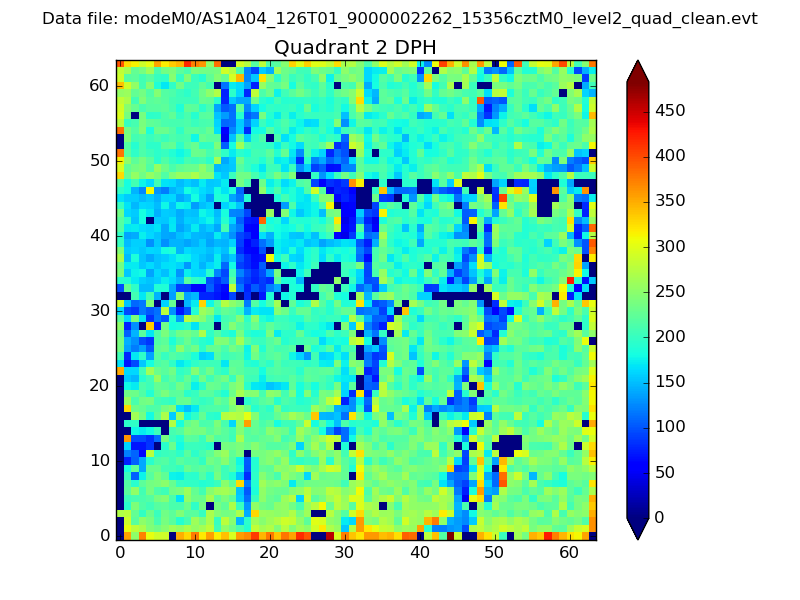
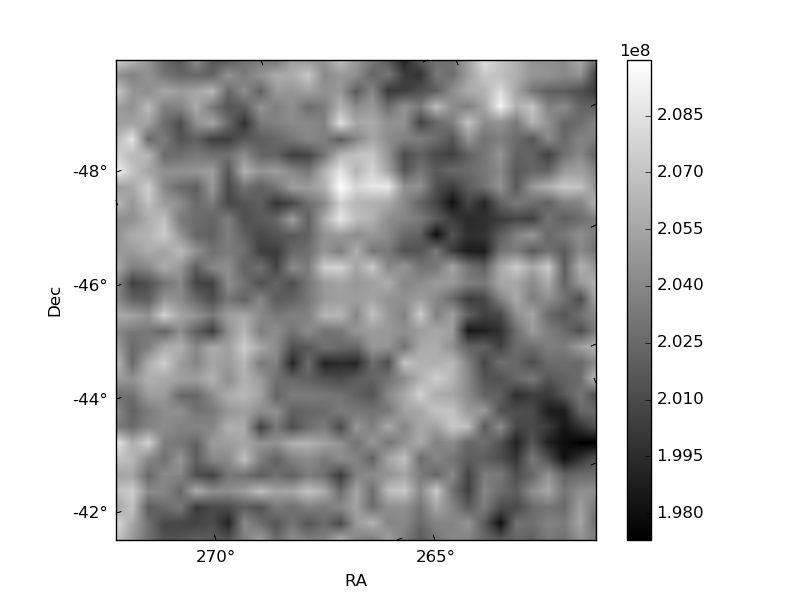
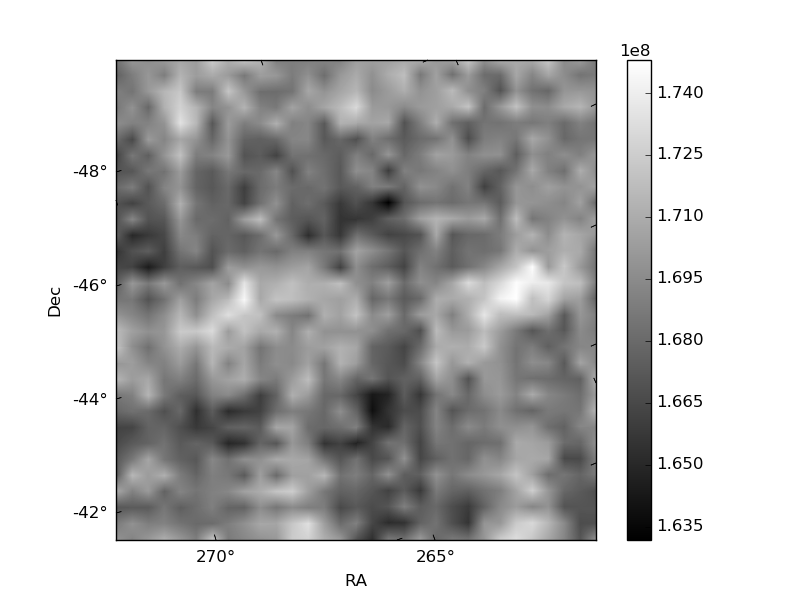
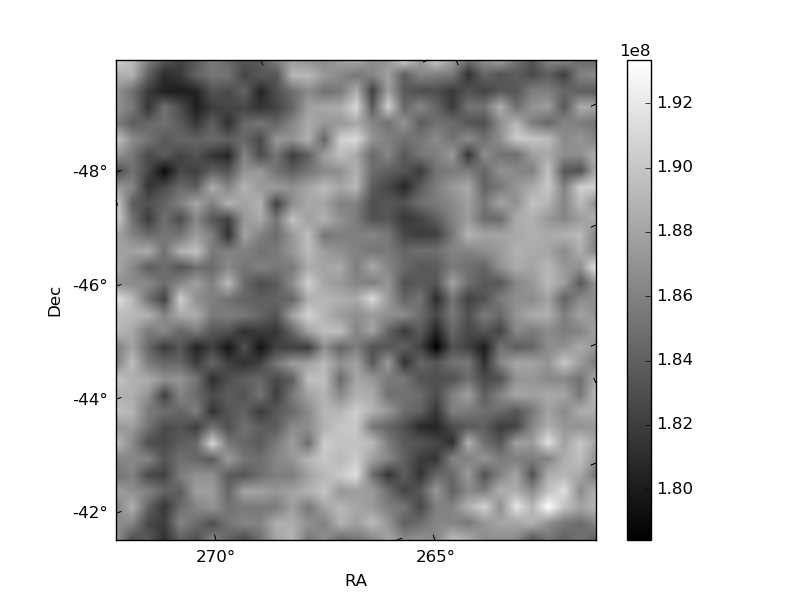
Histogram calculated using DETX and DETY for each event in the final _common_clean file
| Quadrant A | 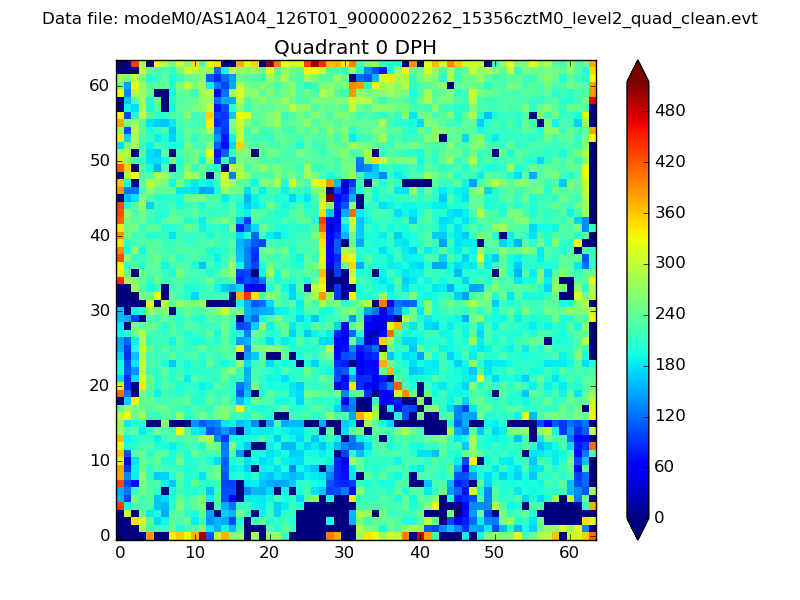 |
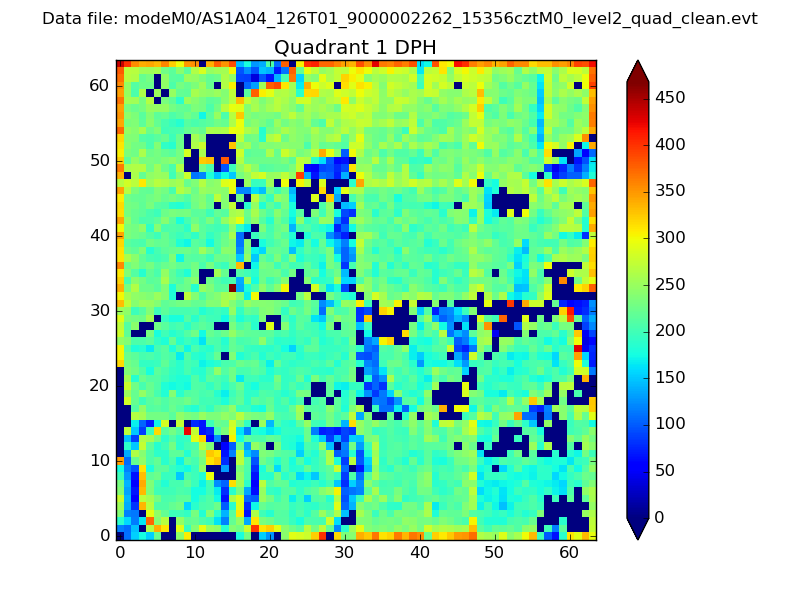 |
Quadrant B |
|---|---|---|---|
| Quadrant D | 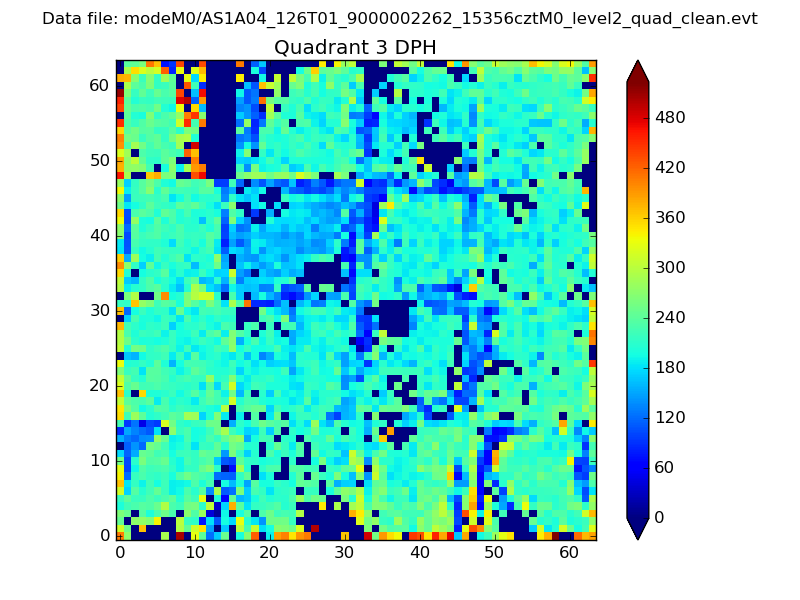 |
 |
Quadrant C |
| Plot type | Count rate plots | Images |
|---|---|---|
| Comparison with Poisson distribution Blue bars denote a histogram of data divided into 1 sec bins. Red curve is a Poisson curve with rate = median count rate of data. |
 |
 |
| Quadrant-wise count rates Data is divided into 100 sec bins |
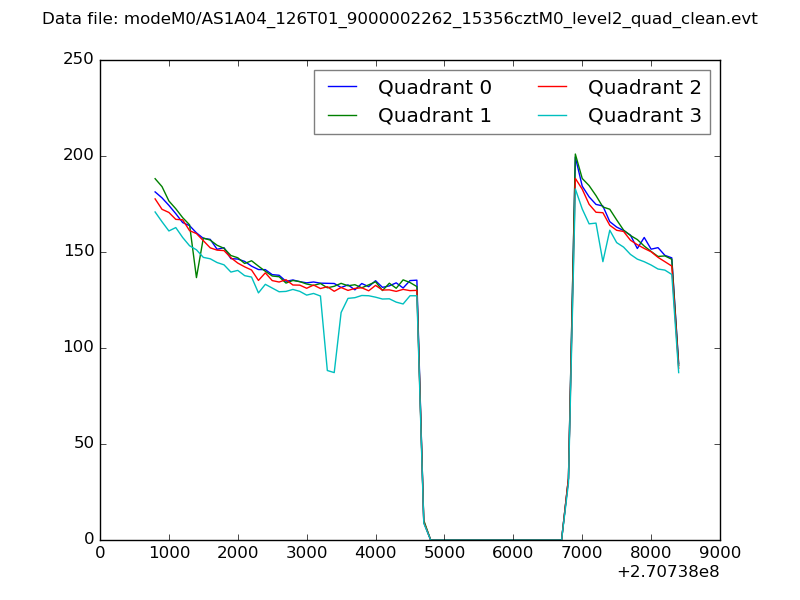 |
|
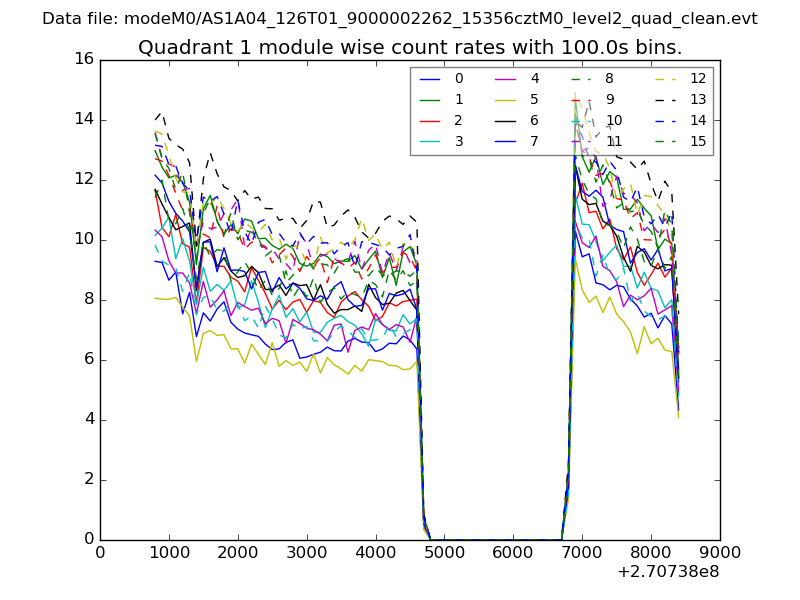
| Module-wise count rates for Quadrant A Data is divided into 100 sec bins |
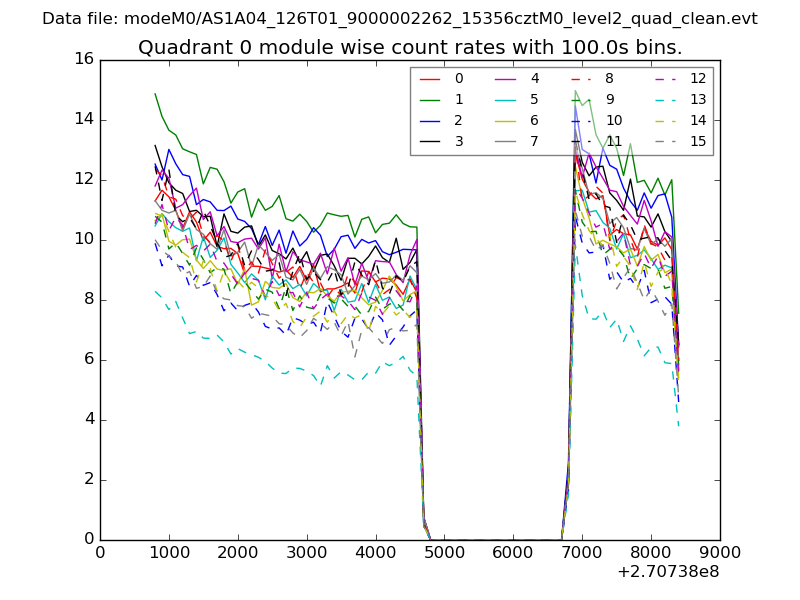 |
 |
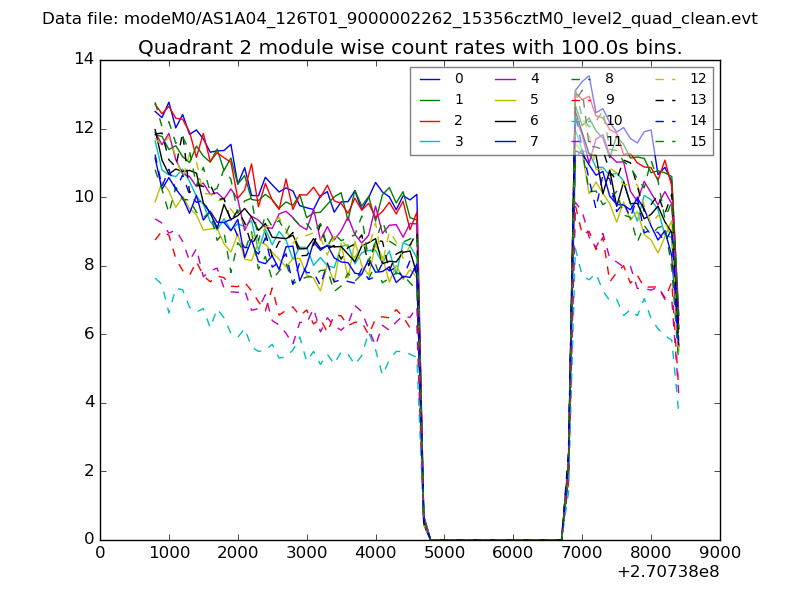
| Module-wise count rates for Quadrant B Data is divided into 100 sec bins |
 |
 |
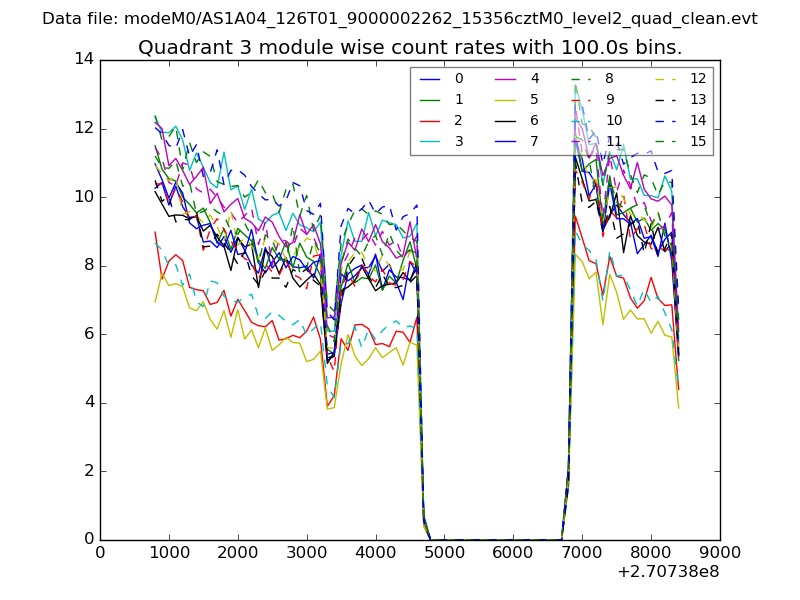
| Module-wise count rates for Quadrant C Data is divided into 100 sec bins |
 |
 |
| Module-wise count rates for Quadrant D Data is divided into 100 sec bins |
 |
 |
| Parameter | Plot |
|---|---|
| CZT HV Monitor | 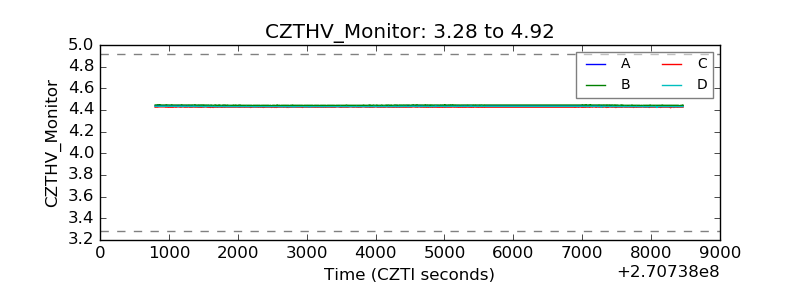 |
| D_VDD | 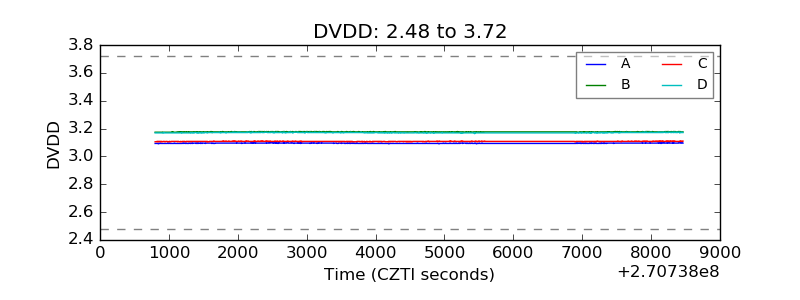 |
| Temperature 1 | 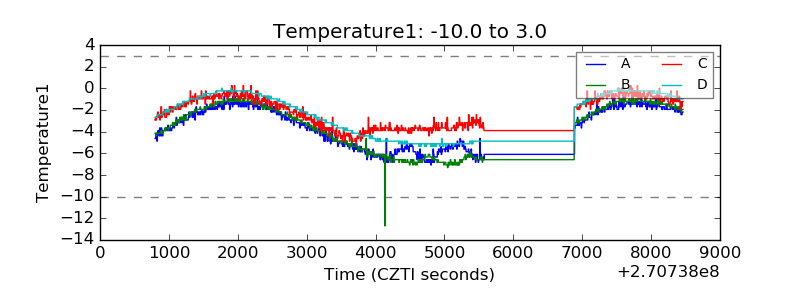 |
| Veto HV Monitor | 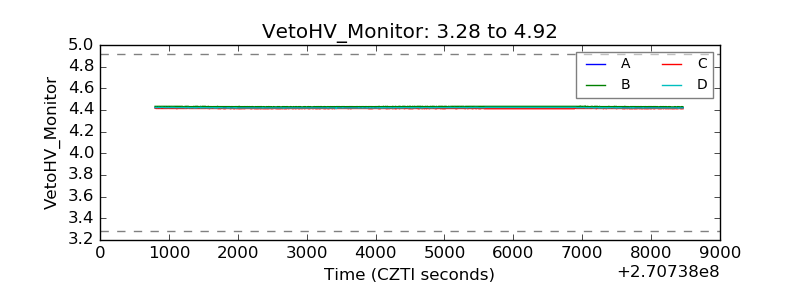 |
| Veto LLD | 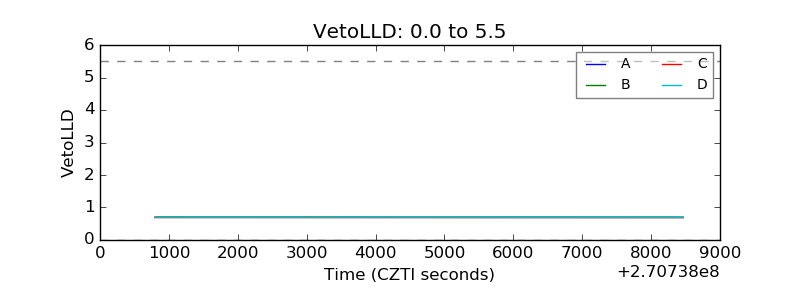 |
| Alpha Counter | 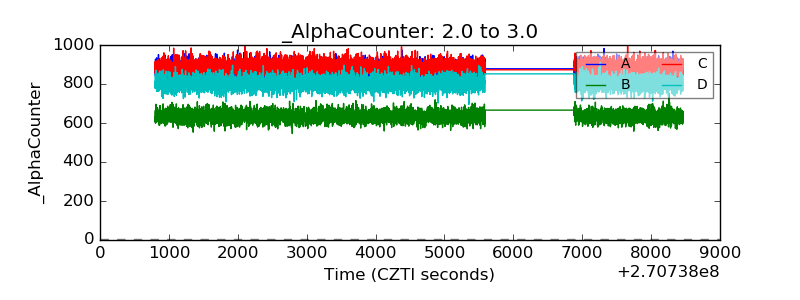 |
| _CPM_Rate | 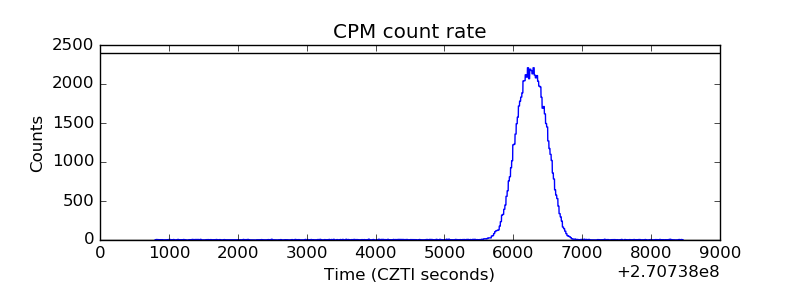 |
| CZT Counter | 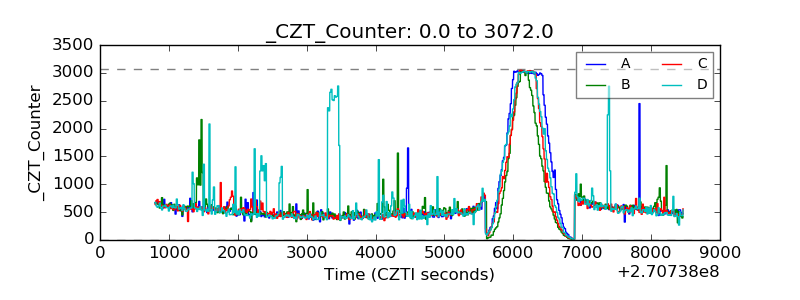 |
| +2.5 Volts monitor |  |
| +5 Volts monitor | 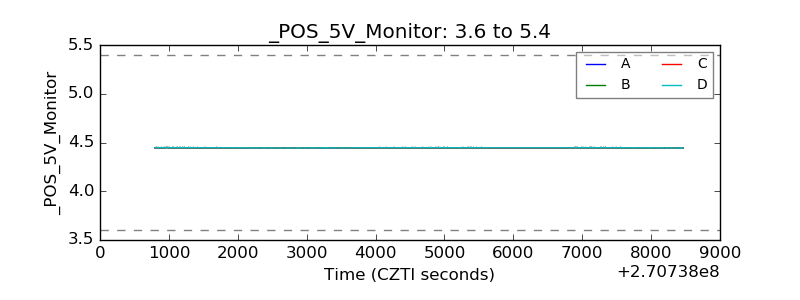 |
| _ROLL_ROT | 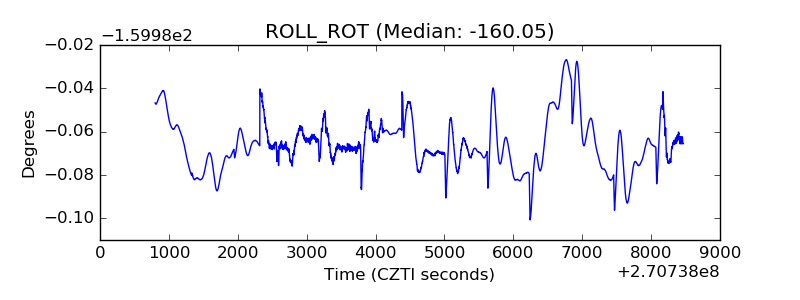 |
| _Roll_DEC | 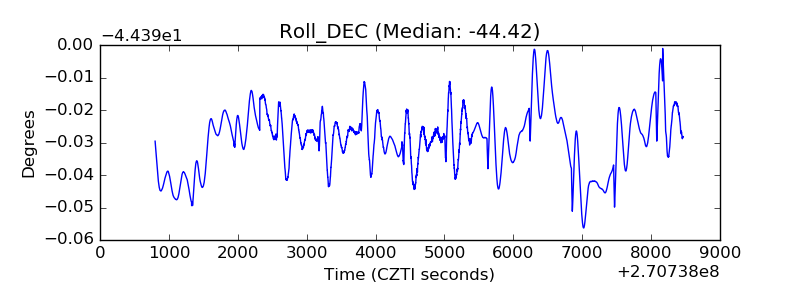 |
| _Roll_RA | 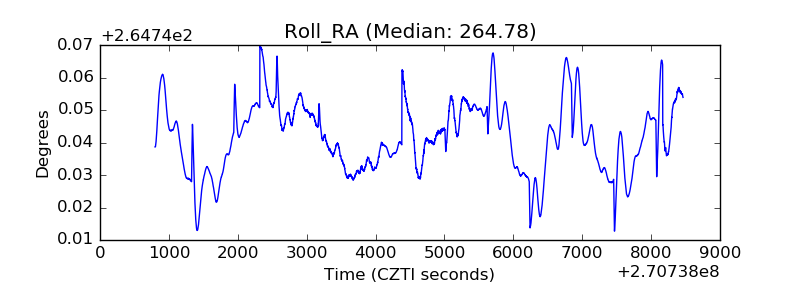 |
| Veto Counter | 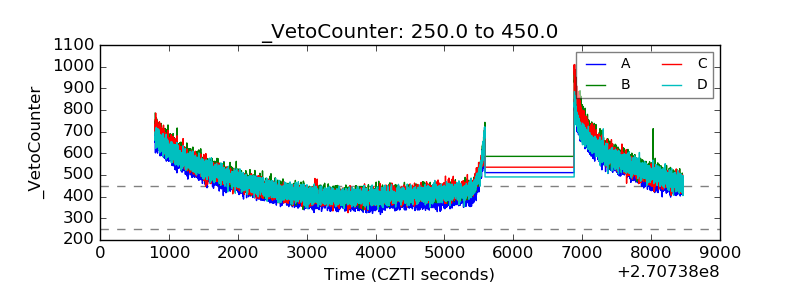 |