| Param | Original file | Final file |
|---|---|---|
| Filename | modeM0/AS1A04_126T01_9000002262_15358cztM0_level2.evt | modeM0/AS1A04_126T01_9000002262_15358cztM0_level2_quad_clean.evt |
| Size (bytes) | 454,029,120 | 95,734,080 |
| Size | 433.0 MB | 91.3 MB |
| Events in quadrant A | 2,993,209 | 632,176 |
| Events in quadrant B | 3,839,725 | 627,930 |
| Events in quadrant C | 2,982,547 | 619,139 |
| Events in quadrant D | 3,515,134 | 588,860 |
| Mode M9 | |||
|---|---|---|---|
| Quadrant | BADHDUFLAG | Total packets | Discarded packets |
| A | 0 | 13 | 0 |
| B | 0 | 13 | 0 |
| C | 0 | 13 | 0 |
| D | 0 | 13 | 0 |
| Mode M0 | |||
|---|---|---|---|
| Quadrant | BADHDUFLAG | Total packets | Discarded packets |
| A | 0 | 12891 | 2 |
| B | 0 | 15331 | 1 |
| C | 0 | 12799 | 1 |
| D | 0 | 14670 | 1 |
| Mode SS | |||
|---|---|---|---|
| Quadrant | BADHDUFLAG | Total packets | Discarded packets |
| A | 0 | 126 | 0 |
| B | 0 | 126 | 0 |
| C | 0 | 126 | 0 |
| D | 0 | 126 | 0 |
| Quadrant | Total seconds | Saturated seconds | Saturation percentage |
|---|---|---|---|
| A | 6174 | 50 | 0.809848% |
| B | 6174 | 168 | 2.721088% |
| C | 6174 | 21 | 0.340136% |
| D | 6174 | 156 | 2.526725% |
Noise dominated data is calculated using 1-second bins in cleaned event files. If a bin has >2000 counts, and if more than 50% of those come from <1% of pixels, then it is considered to be noise-dominated and hence unusable.
| Quadrant | # 1 sec bins | Bins with >0 counts | Bins with >2000 counts | High rate bins dominated by noise | Noise dominated (total time) | Noise dominated (detector-on time) | Marked lightcurve |
|---|---|---|---|---|---|---|---|
| A | 7475 | 6176 | 2 | 2 | 0.03% | 0.03% | 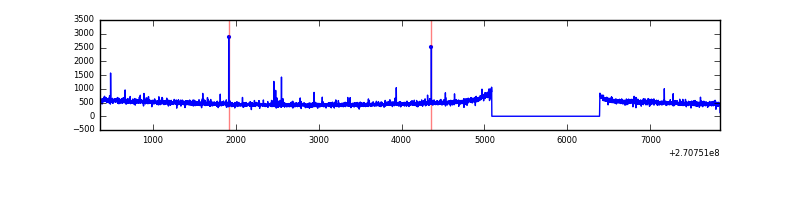 |
| B | 7475 | 6176 | 111 | 111 | 1.48% | 1.80% | 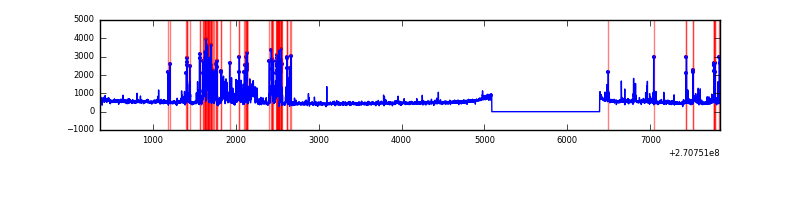 |
| C | 7475 | 6176 | 0 | 0 | 0.00% | 0.00% | 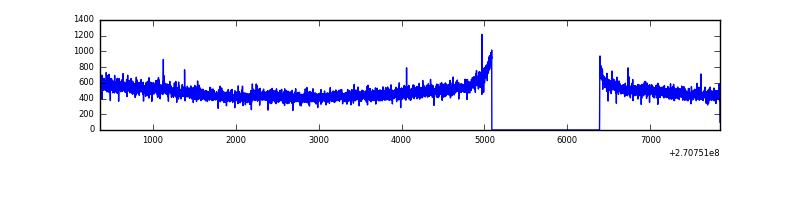 |
| D | 7475 | 6176 | 112 | 112 | 1.50% | 1.81% | 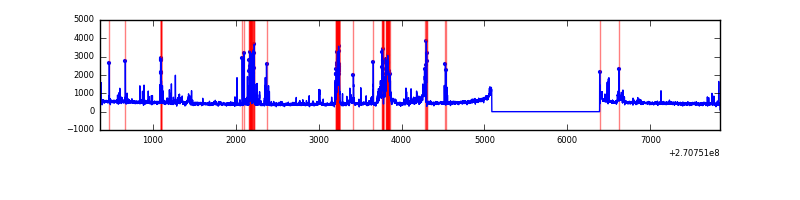 |
Top three noisy pixels from each quadrant. If the there are fewer than three noisy pixels in the level2.evt file, extra rows are filled as -1
| Pixel properties | Quadrant properties | ||||||
|---|---|---|---|---|---|---|---|
| Quadrant | DetID | PixID | Counts | Sigma | Mean | Median | Sigma |
| A | 9 | 143 | 24963 | 155.68 | 770 | 756 | 155.5 |
| A | 0 | 226 | 6948 | 39.82 | 770 | 756 | 155.5 |
| A | 15 | 239 | 6295 | 35.62 | 770 | 756 | 155.5 |
| B | 10 | 16 | 677067 | 4714.33 | 762 | 745 | 143.5 |
| B | 0 | 190 | 40508 | 277.17 | 762 | 745 | 143.5 |
| B | 0 | 189 | 34108 | 232.56 | 762 | 745 | 143.5 |
| C | 3 | 233 | 122547 | 731.28 | 732 | 736 | 166.6 |
| C | 13 | 61 | 5426 | 28.16 | 732 | 736 | 166.6 |
| C | 4 | 238 | 5183 | 26.7 | 732 | 736 | 166.6 |
| D | 2 | 33 | 275336 | 1548.53 | 731 | 711 | 177.3 |
| D | 7 | 38 | 142404 | 798.96 | 731 | 711 | 177.3 |
| D | 5 | 222 | 115510 | 647.32 | 731 | 711 | 177.3 |
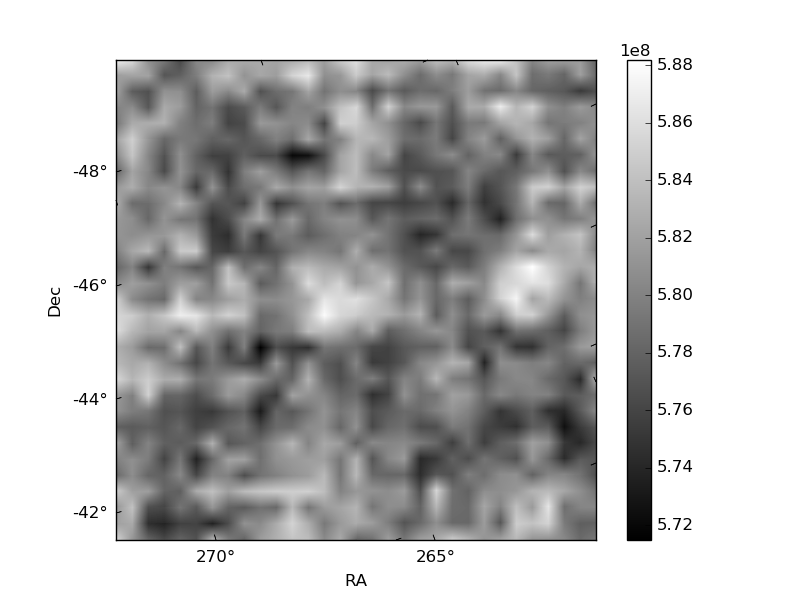
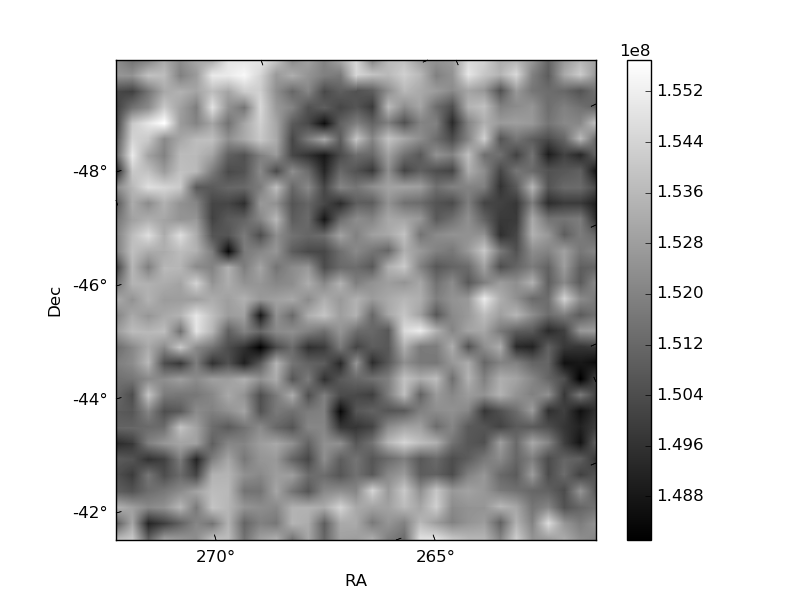
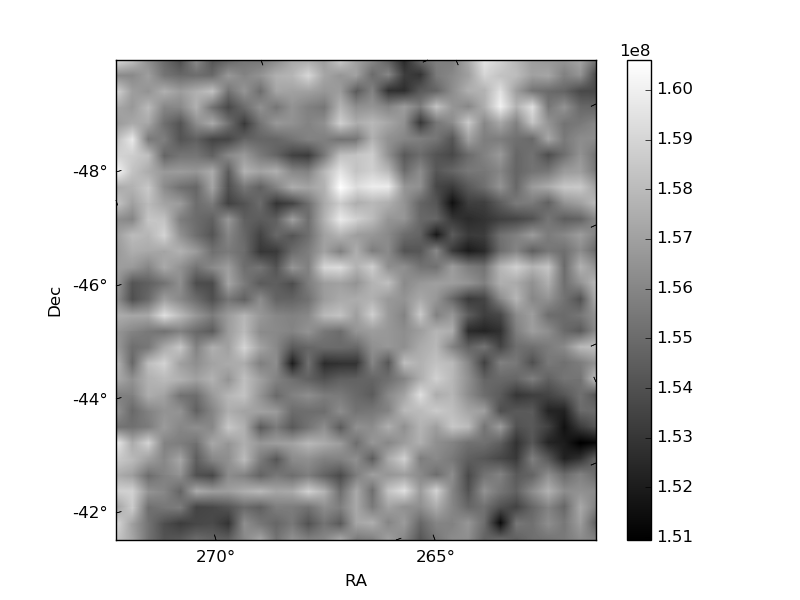
Histogram calculated using DETX and DETY for each event in the final _common_clean file
| Quadrant A | 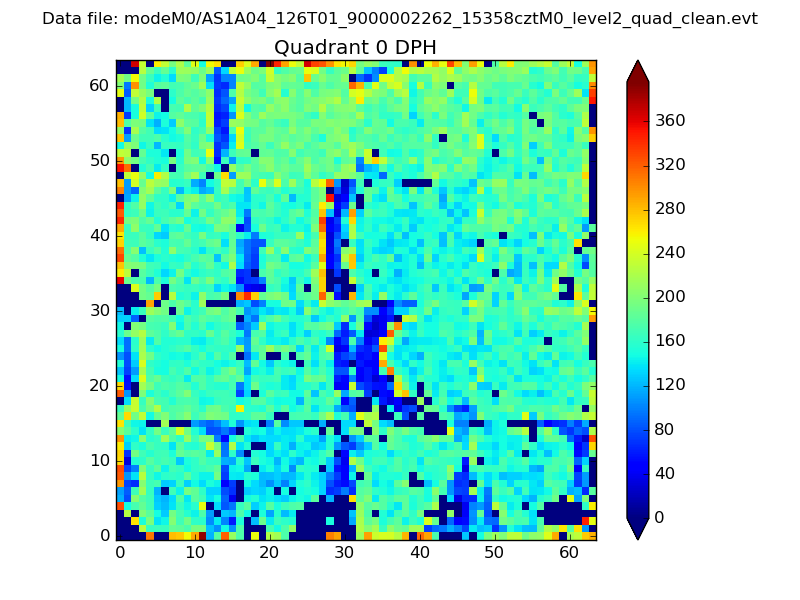 |
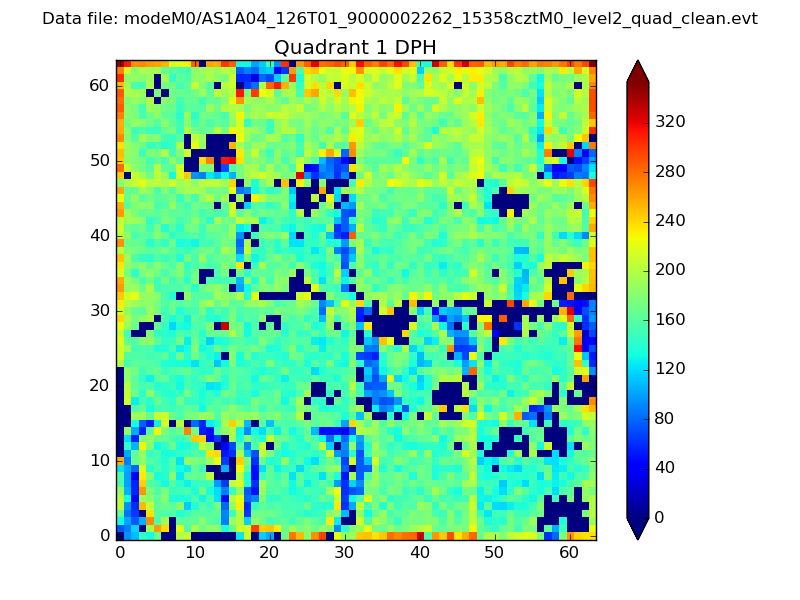 |
Quadrant B |
|---|---|---|---|
| Quadrant D | 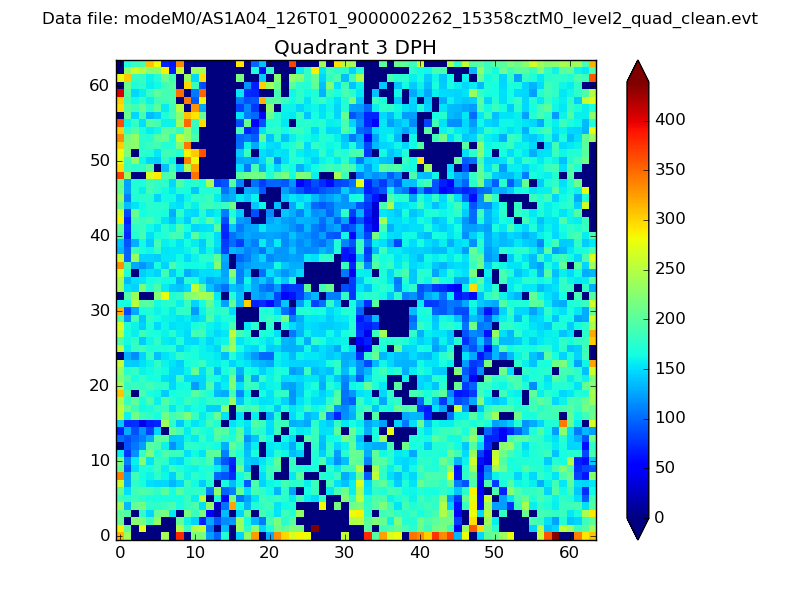 |
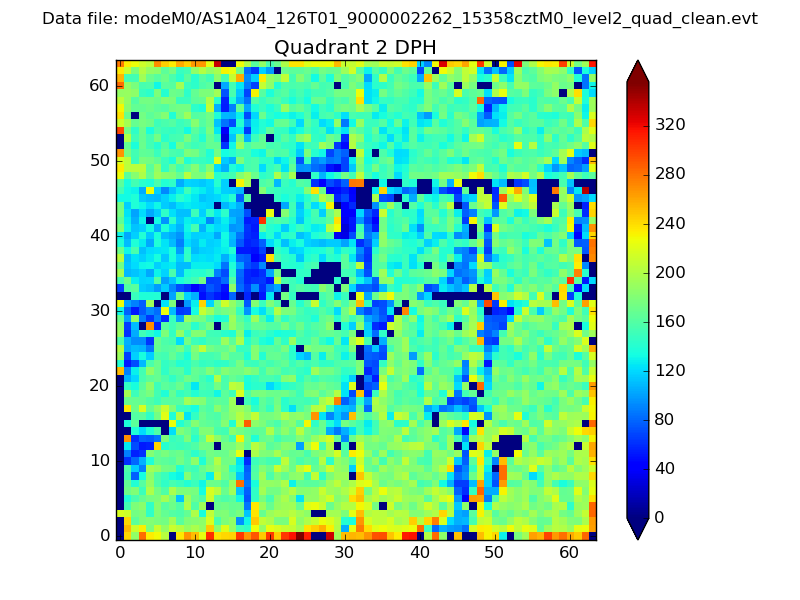 |
Quadrant C |
| Plot type | Count rate plots | Images |
|---|---|---|
| Comparison with Poisson distribution Blue bars denote a histogram of data divided into 1 sec bins. Red curve is a Poisson curve with rate = median count rate of data. |
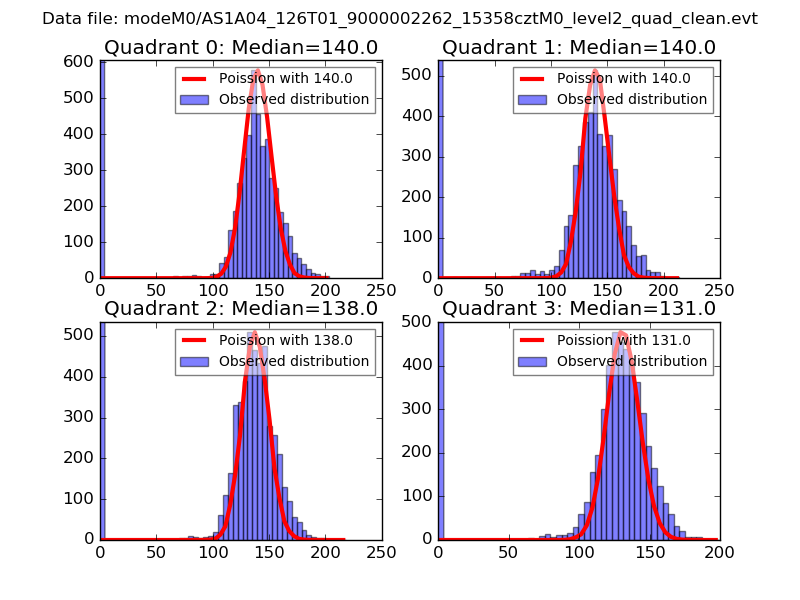 |
 |
| Quadrant-wise count rates Data is divided into 100 sec bins |
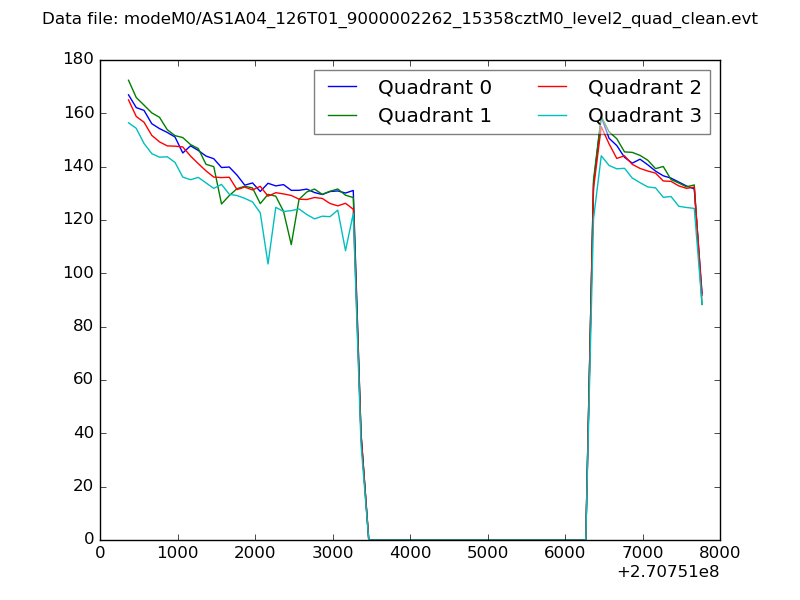 |
|
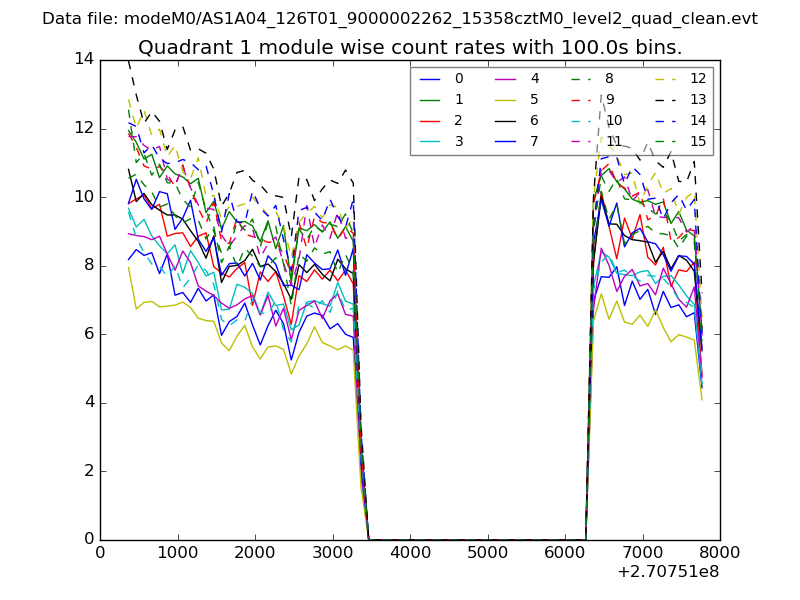
| Module-wise count rates for Quadrant A Data is divided into 100 sec bins |
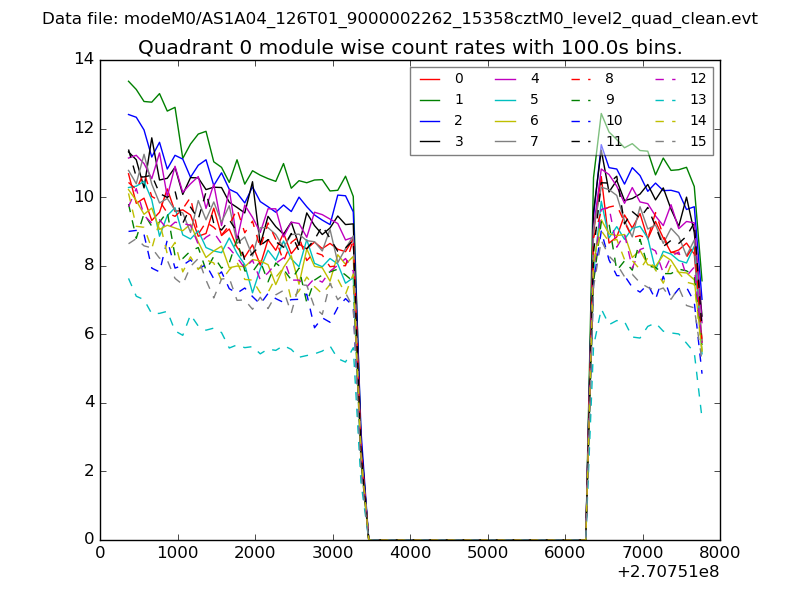 |
 |
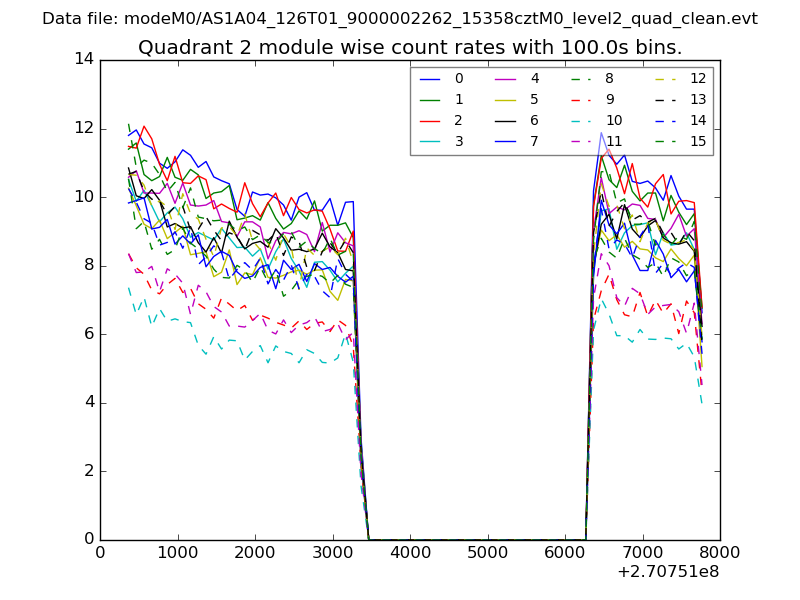
| Module-wise count rates for Quadrant B Data is divided into 100 sec bins |
 |
 |
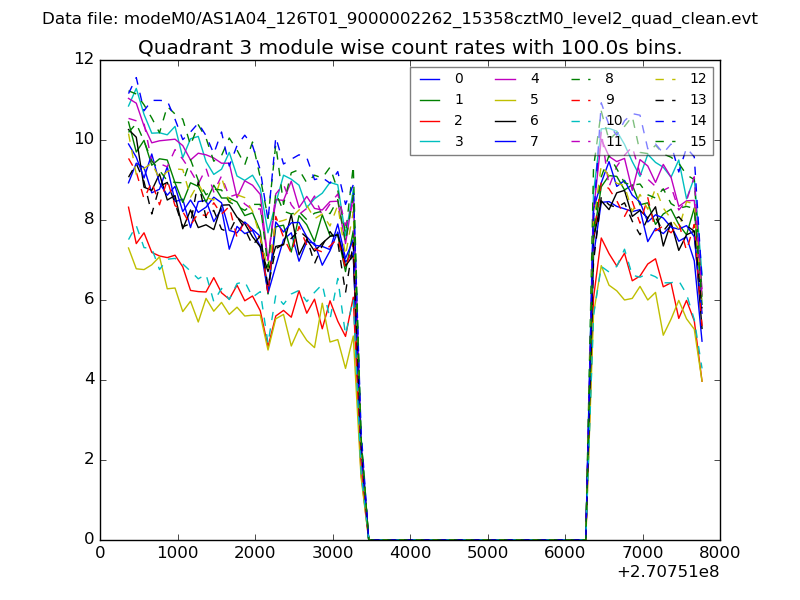
| Module-wise count rates for Quadrant C Data is divided into 100 sec bins |
 |
 |
| Module-wise count rates for Quadrant D Data is divided into 100 sec bins |
 |
 |
| Parameter | Plot |
|---|---|
| CZT HV Monitor | 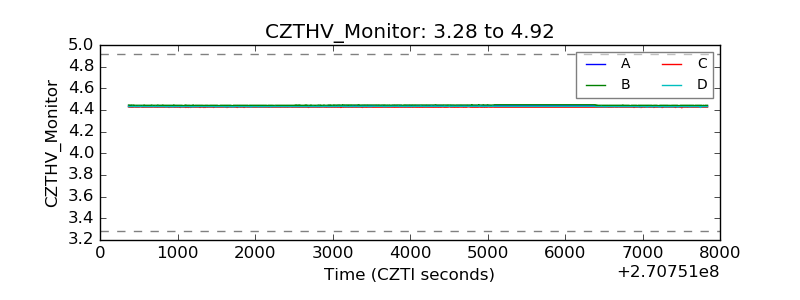 |
| D_VDD | 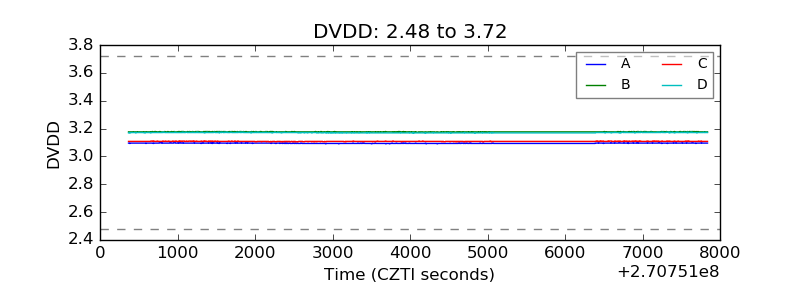 |
| Temperature 1 | 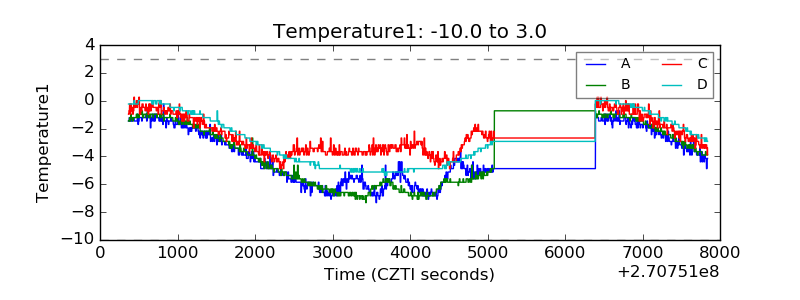 |
| Veto HV Monitor | 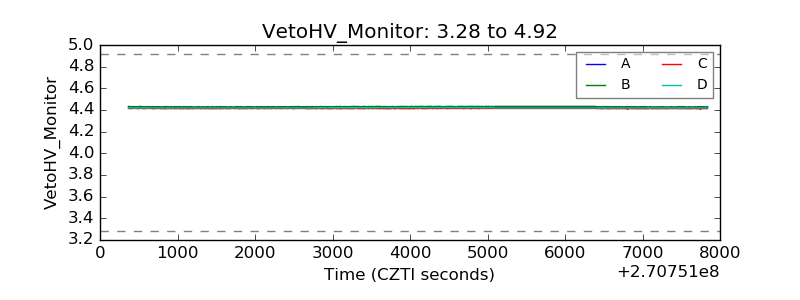 |
| Veto LLD | 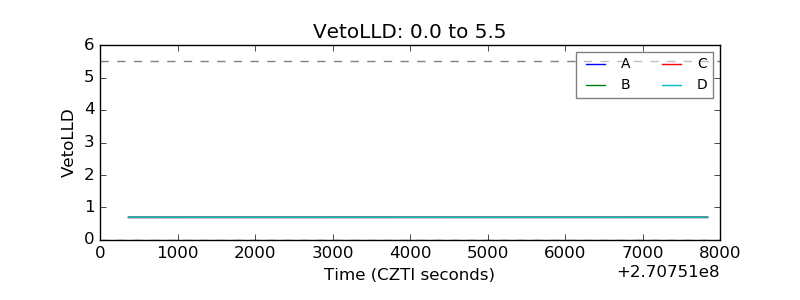 |
| Alpha Counter | 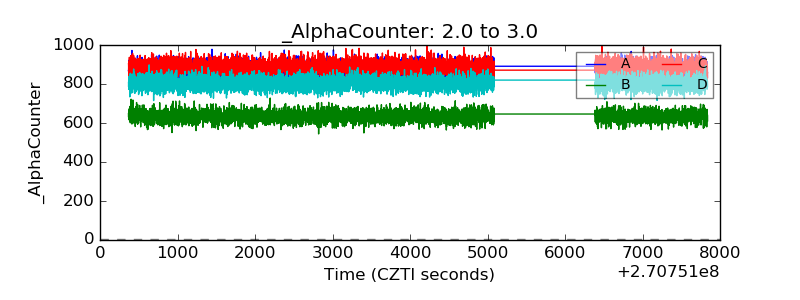 |
| _CPM_Rate | 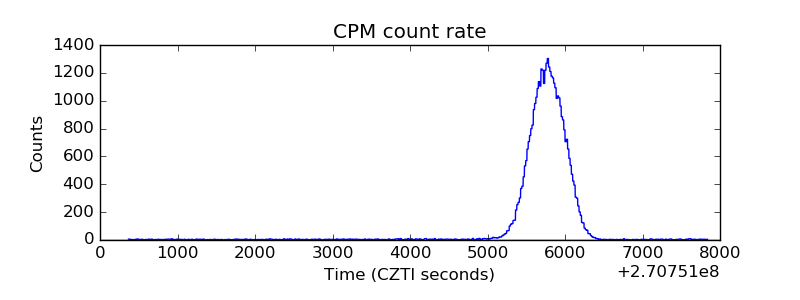 |
| CZT Counter | 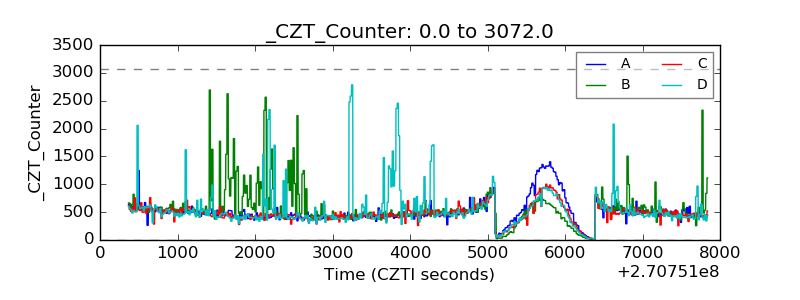 |
| +2.5 Volts monitor |  |
| +5 Volts monitor |  |
| _ROLL_ROT | 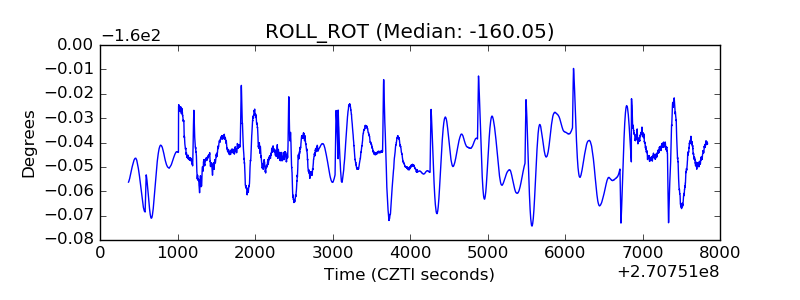 |
| _Roll_DEC | 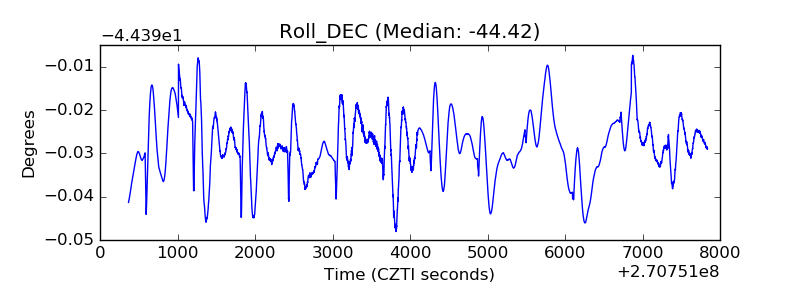 |
| _Roll_RA | 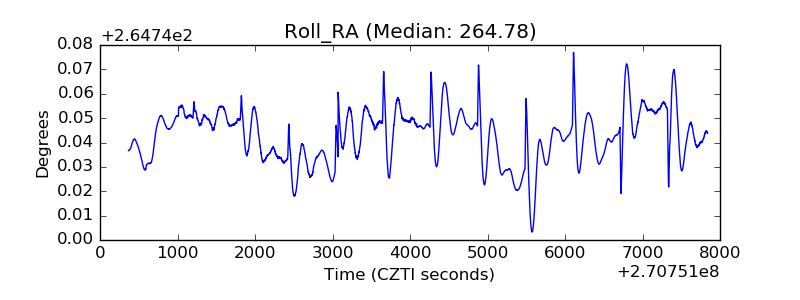 |
| Veto Counter | 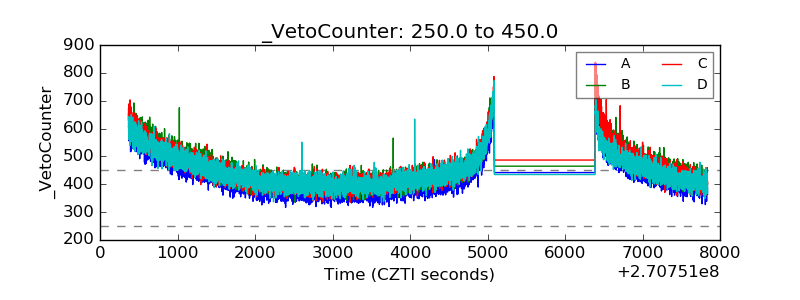 |