| Param | Original file | Final file |
|---|---|---|
| Filename | modeM0/AS1A04_126T01_9000002262_15359cztM0_level2.evt | modeM0/AS1A04_126T01_9000002262_15359cztM0_level2_quad_clean.evt |
| Size (bytes) | 453,528,000 | 94,052,160 |
| Size | 432.5 MB | 89.7 MB |
| Events in quadrant A | 3,037,854 | 611,631 |
| Events in quadrant B | 3,948,474 | 602,343 |
| Events in quadrant C | 3,161,472 | 606,023 |
| Events in quadrant D | 3,148,640 | 577,884 |
| Mode M9 | |||
|---|---|---|---|
| Quadrant | BADHDUFLAG | Total packets | Discarded packets |
| A | 0 | 16 | 0 |
| B | 0 | 16 | 0 |
| C | 0 | 16 | 0 |
| D | 0 | 17 | 0 |
| Mode M0 | |||
|---|---|---|---|
| Quadrant | BADHDUFLAG | Total packets | Discarded packets |
| A | 0 | 13412 | 3 |
| B | 0 | 15911 | 2 |
| C | 0 | 13608 | 2 |
| D | 0 | 13941 | 2 |
| Mode SS | |||
|---|---|---|---|
| Quadrant | BADHDUFLAG | Total packets | Discarded packets |
| A | 0 | 132 | 0 |
| B | 0 | 132 | 0 |
| C | 0 | 132 | 0 |
| D | 0 | 132 | 0 |
| Quadrant | Total seconds | Saturated seconds | Saturation percentage |
|---|---|---|---|
| A | 6452 | 48 | 0.743955% |
| B | 6452 | 242 | 3.750775% |
| C | 6452 | 28 | 0.433974% |
| D | 6452 | 72 | 1.115933% |
Noise dominated data is calculated using 1-second bins in cleaned event files. If a bin has >2000 counts, and if more than 50% of those come from <1% of pixels, then it is considered to be noise-dominated and hence unusable.
| Quadrant | # 1 sec bins | Bins with >0 counts | Bins with >2000 counts | High rate bins dominated by noise | Noise dominated (total time) | Noise dominated (detector-on time) | Marked lightcurve |
|---|---|---|---|---|---|---|---|
| A | 7538 | 6454 | 1 | 1 | 0.01% | 0.02% | 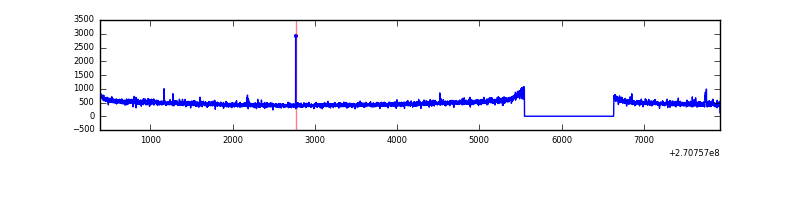 |
| B | 7538 | 6454 | 135 | 135 | 1.79% | 2.09% | 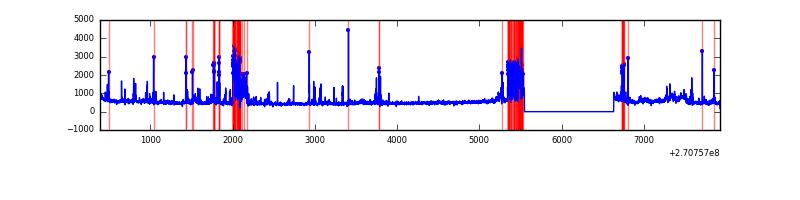 |
| C | 7538 | 6454 | 3 | 3 | 0.04% | 0.05% | 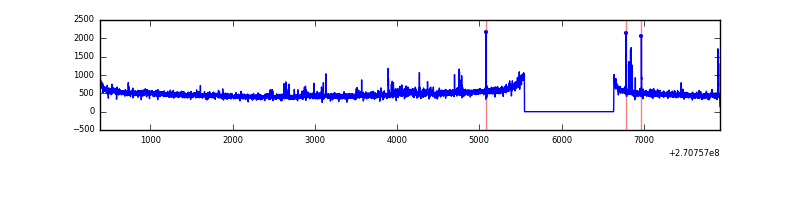 |
| D | 7538 | 6454 | 26 | 26 | 0.34% | 0.40% | 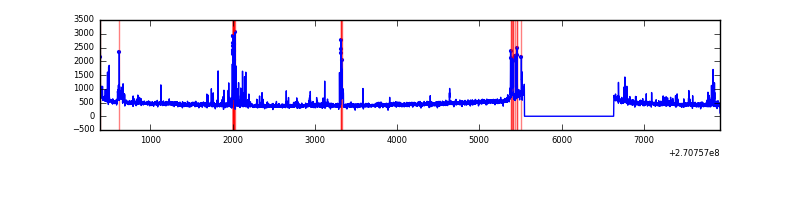 |
Top three noisy pixels from each quadrant. If the there are fewer than three noisy pixels in the level2.evt file, extra rows are filled as -1
| Pixel properties | Quadrant properties | ||||||
|---|---|---|---|---|---|---|---|
| Quadrant | DetID | PixID | Counts | Sigma | Mean | Median | Sigma |
| A | 15 | 239 | 12336 | 73.14 | 784 | 768 | 158.2 |
| A | 9 | 143 | 11930 | 70.57 | 784 | 768 | 158.2 |
| A | 0 | 226 | 7105 | 40.07 | 784 | 768 | 158.2 |
| B | 10 | 16 | 718757 | 4903.87 | 774 | 755 | 146.4 |
| B | 0 | 190 | 51894 | 349.27 | 774 | 755 | 146.4 |
| B | 0 | 189 | 35215 | 235.36 | 774 | 755 | 146.4 |
| C | 3 | 233 | 220351 | 1265.74 | 754 | 759 | 173.5 |
| C | 13 | 61 | 5438 | 26.97 | 754 | 759 | 173.5 |
| C | 7 | 247 | 2149 | 8.01 | 754 | 759 | 173.5 |
| D | 2 | 33 | 88797 | 487.05 | 750 | 728 | 180.8 |
| D | 7 | 38 | 50129 | 273.2 | 750 | 728 | 180.8 |
| D | 10 | 70 | 44686 | 243.1 | 750 | 728 | 180.8 |
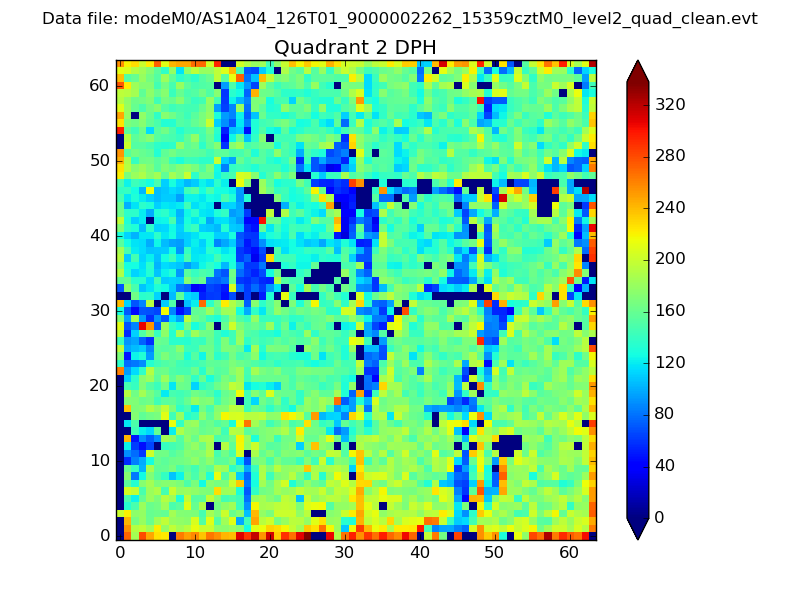
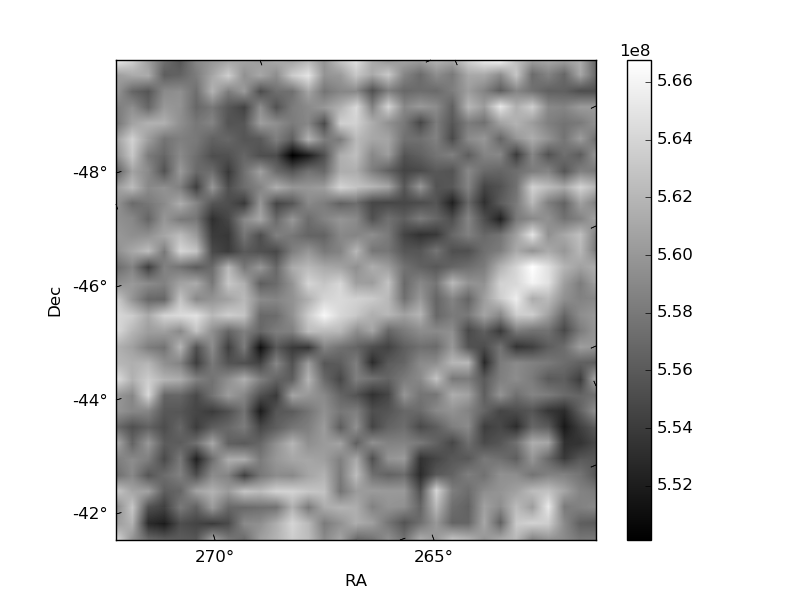
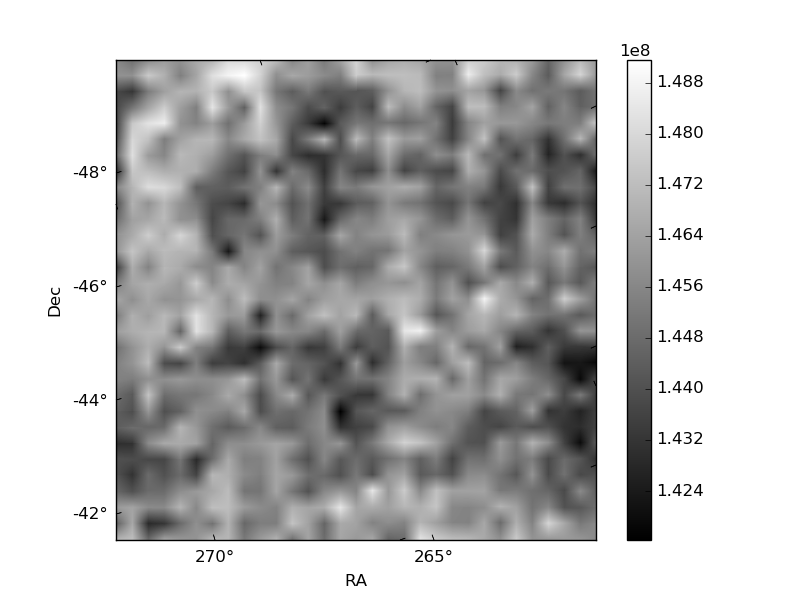
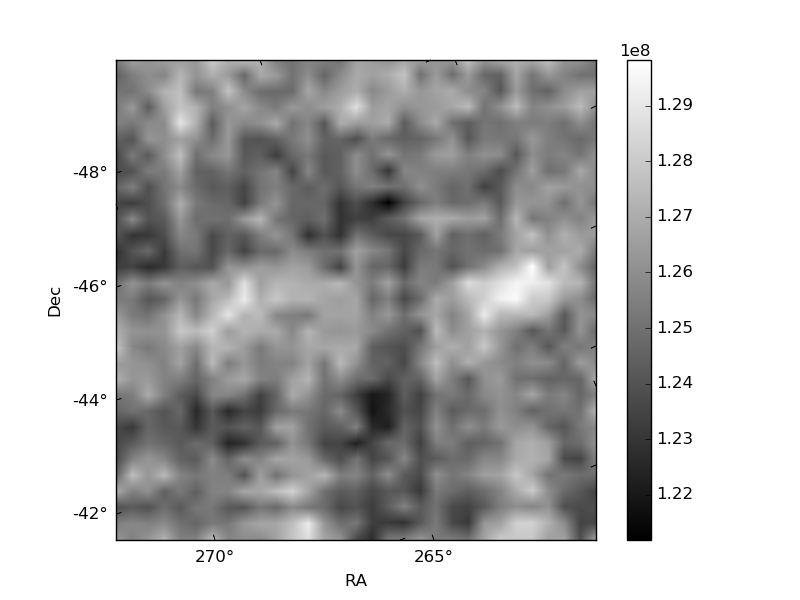
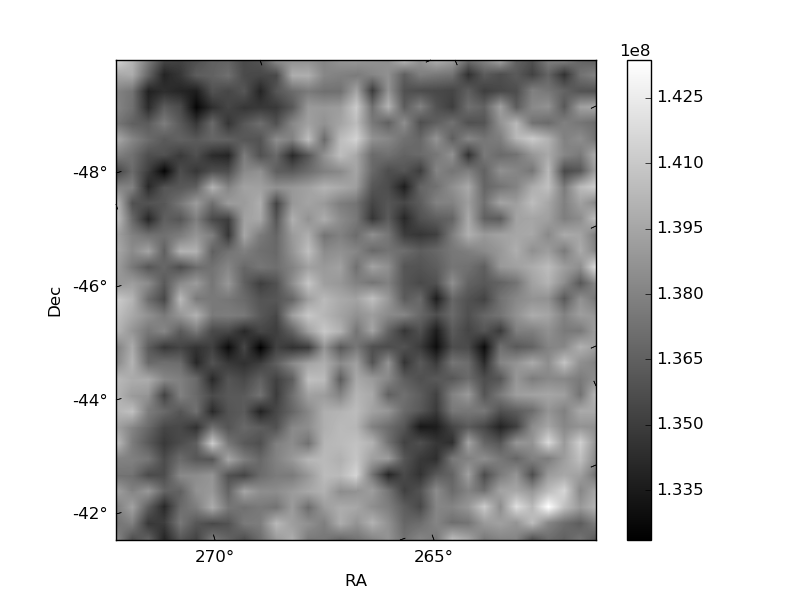
Histogram calculated using DETX and DETY for each event in the final _common_clean file
| Quadrant A | 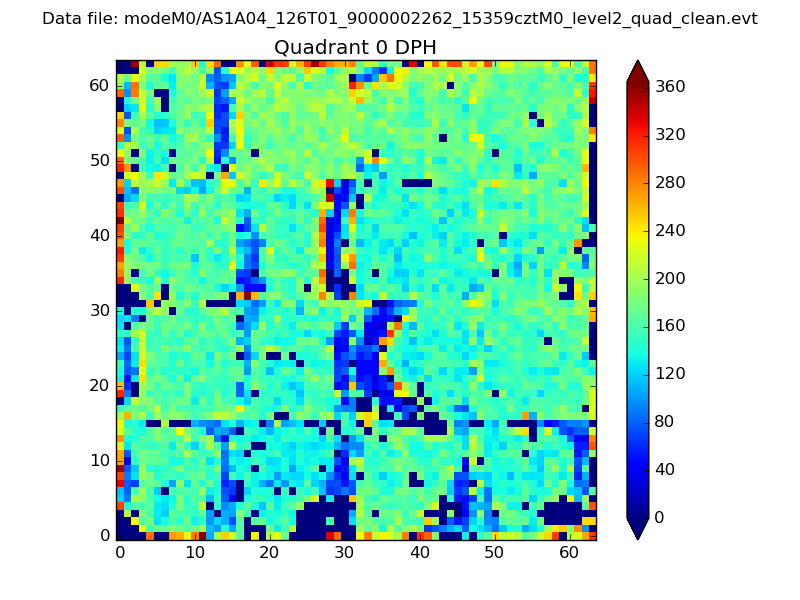 |
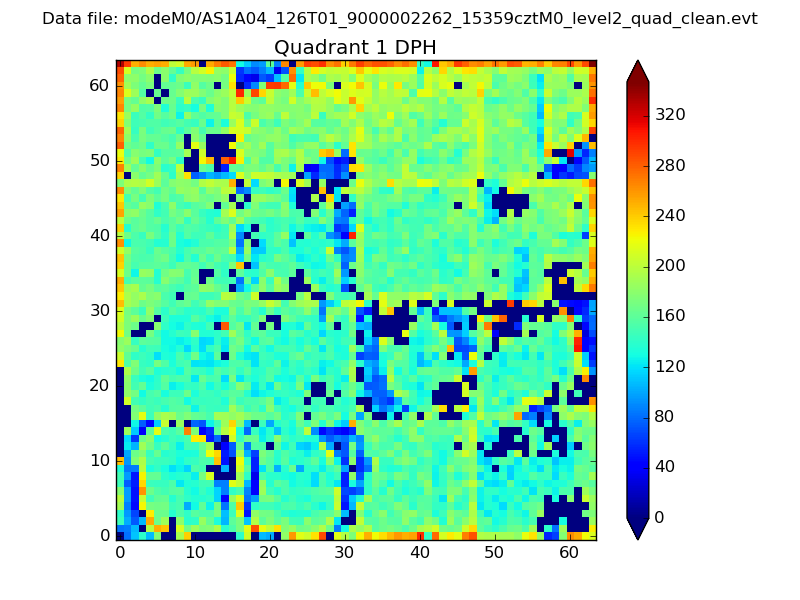 |
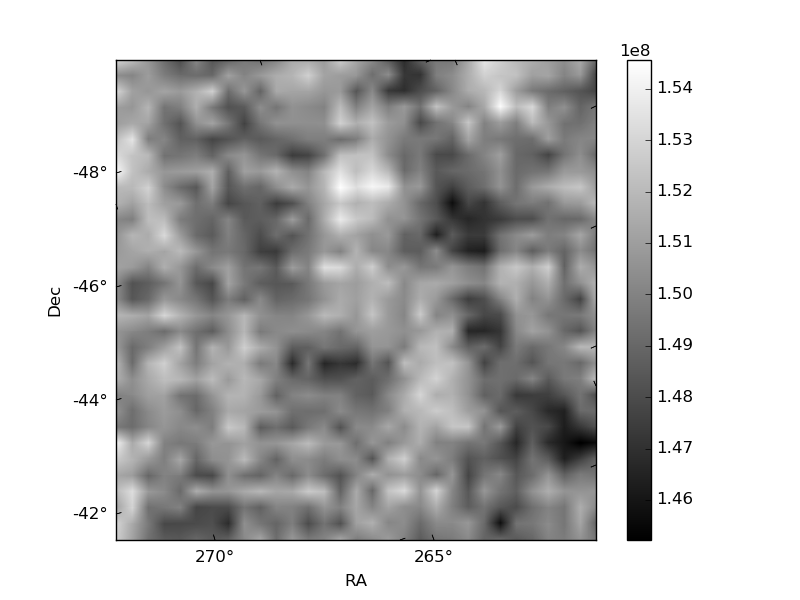
Quadrant B |
|---|---|---|---|
| Quadrant D | 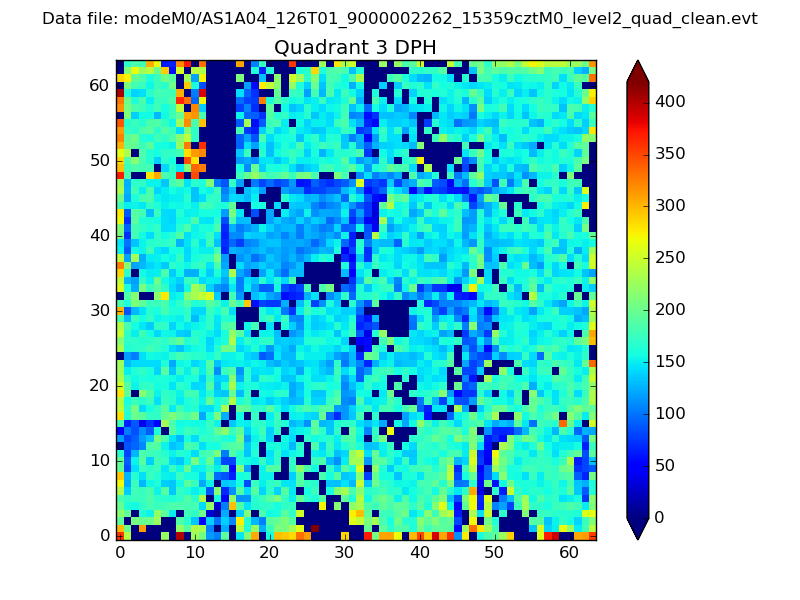 |
 |
Quadrant C |
| Plot type | Count rate plots | Images |
|---|---|---|
| Comparison with Poisson distribution Blue bars denote a histogram of data divided into 1 sec bins. Red curve is a Poisson curve with rate = median count rate of data. |
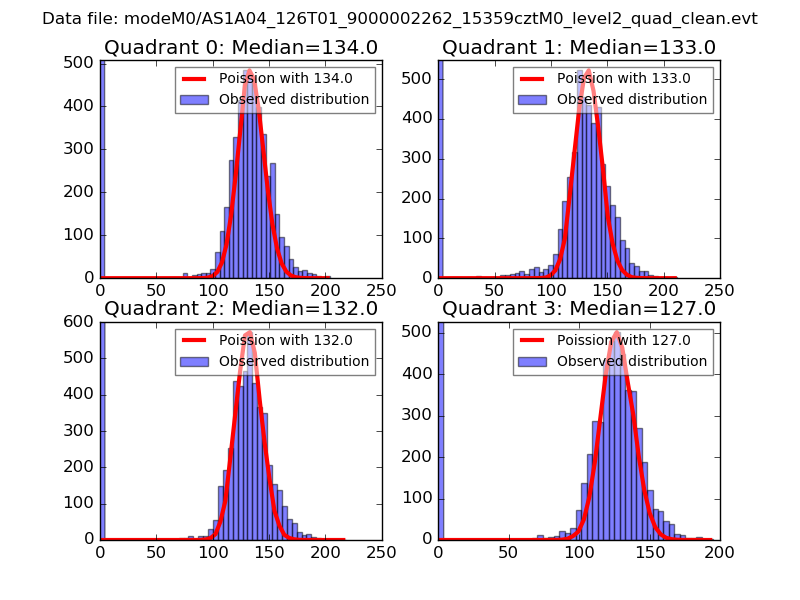 |
 |
| Quadrant-wise count rates Data is divided into 100 sec bins |
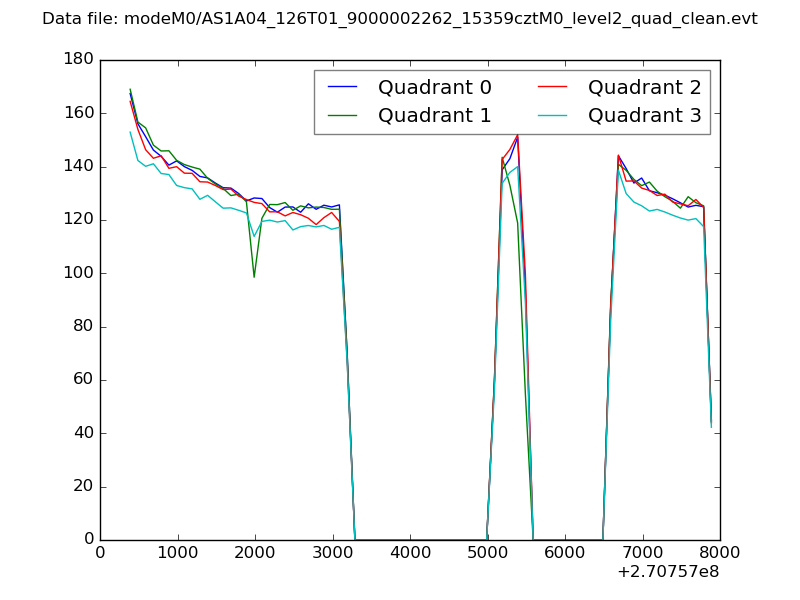 |
|
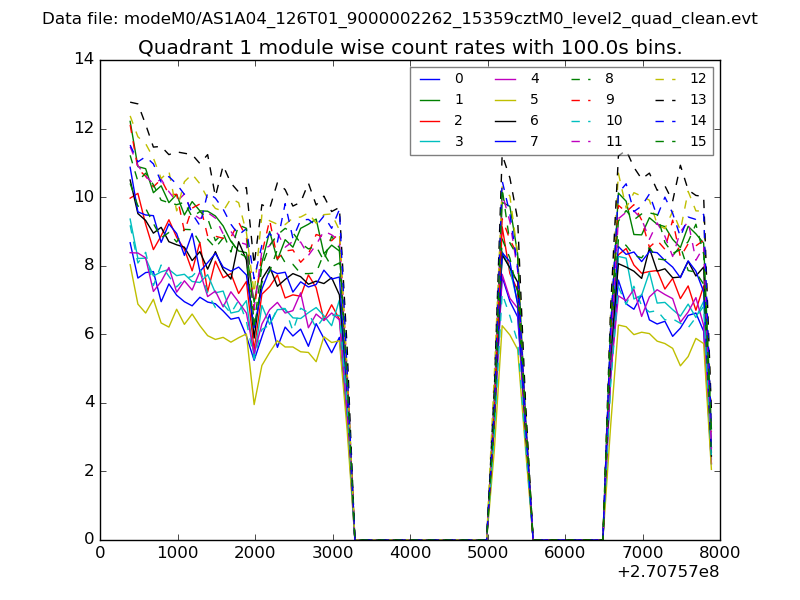
| Module-wise count rates for Quadrant A Data is divided into 100 sec bins |
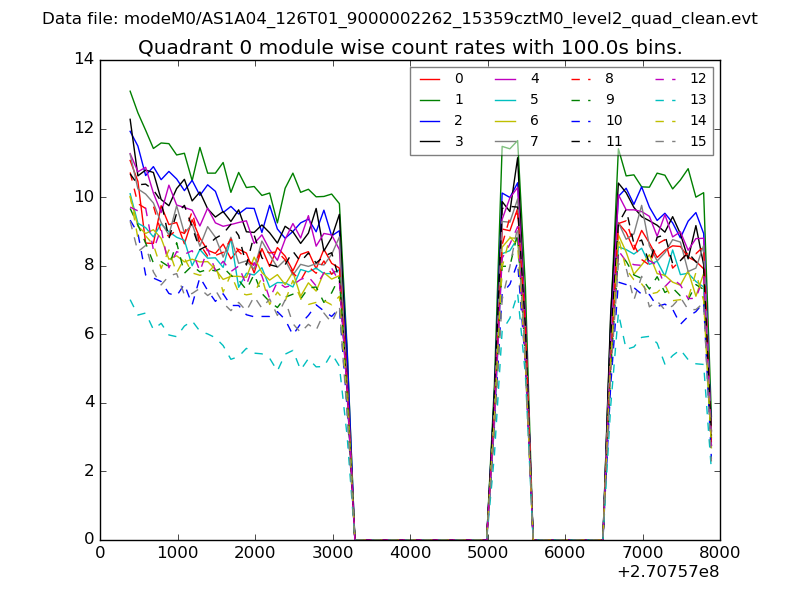 |
 |
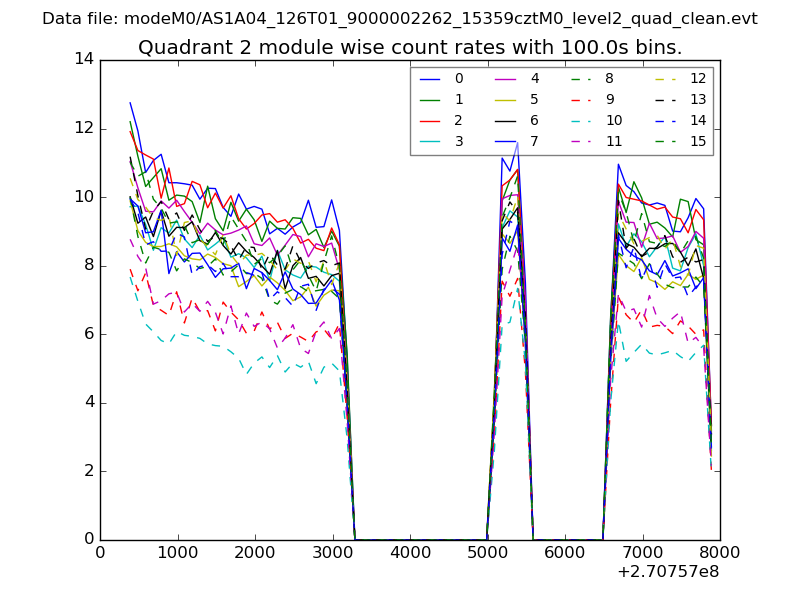
| Module-wise count rates for Quadrant B Data is divided into 100 sec bins |
 |
 |
| Module-wise count rates for Quadrant C Data is divided into 100 sec bins |
 |
 |
| Module-wise count rates for Quadrant D Data is divided into 100 sec bins |
 |
 |
| Parameter | Plot |
|---|---|
| CZT HV Monitor | 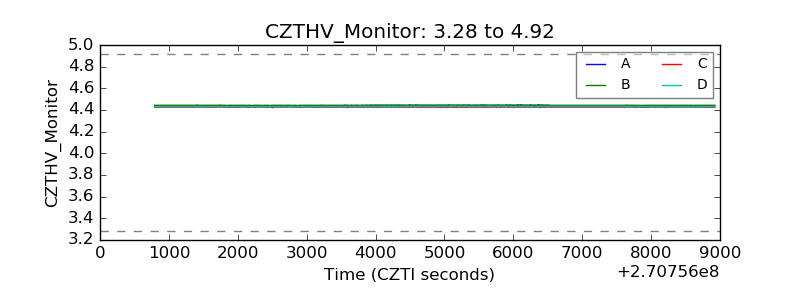 |
| D_VDD | 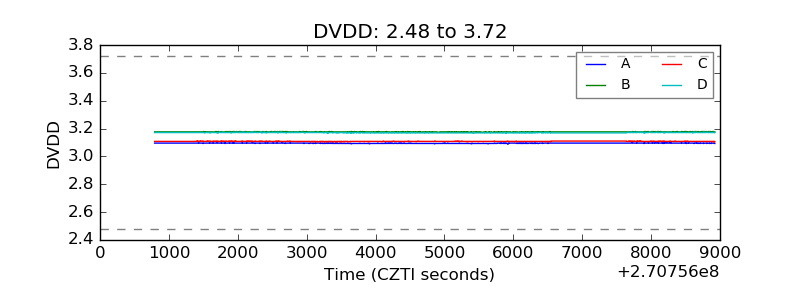 |
| Temperature 1 | 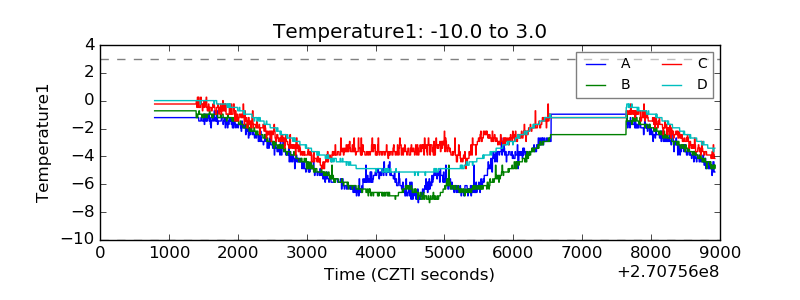 |
| Veto HV Monitor | 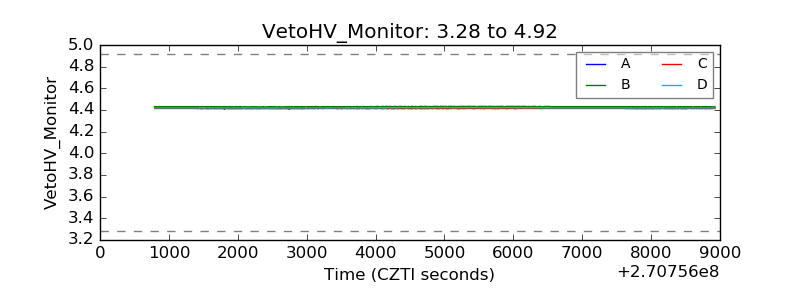 |
| Veto LLD | 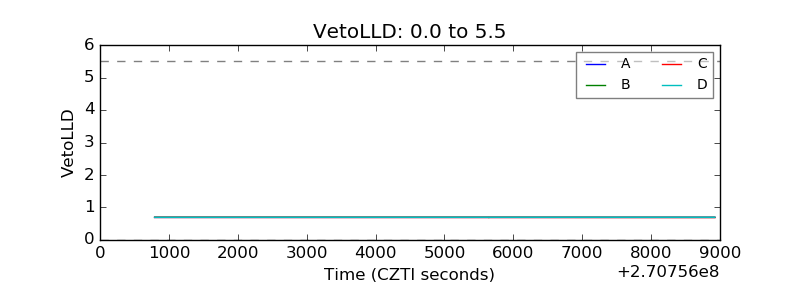 |
| Alpha Counter | 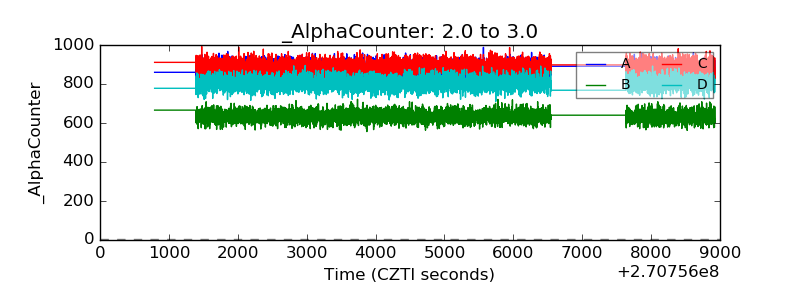 |
| _CPM_Rate | 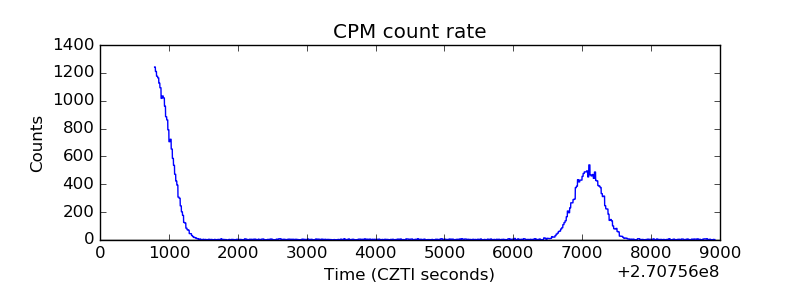 |
| CZT Counter | 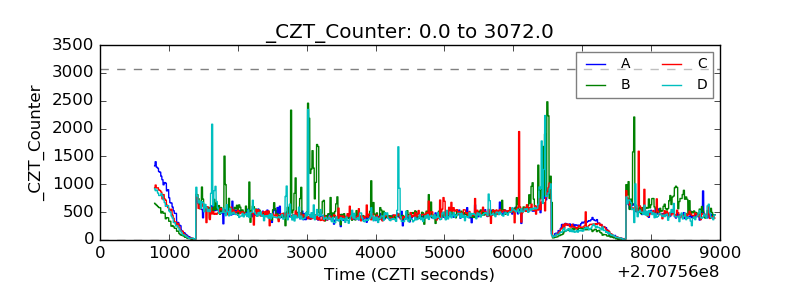 |
| +2.5 Volts monitor |  |
| +5 Volts monitor |  |
| _ROLL_ROT |  |
| _Roll_DEC | 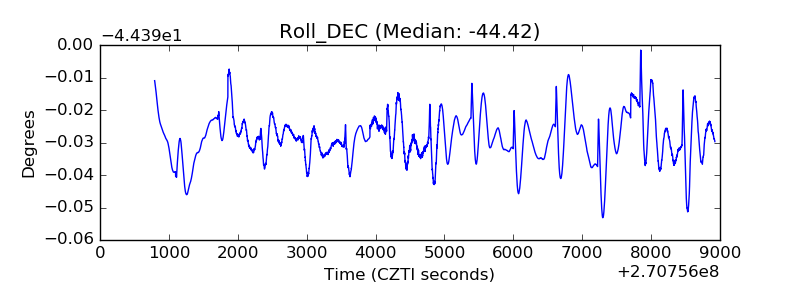 |
| _Roll_RA | 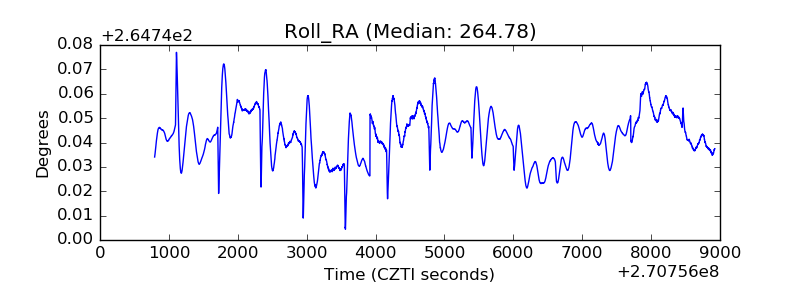 |
| Veto Counter | 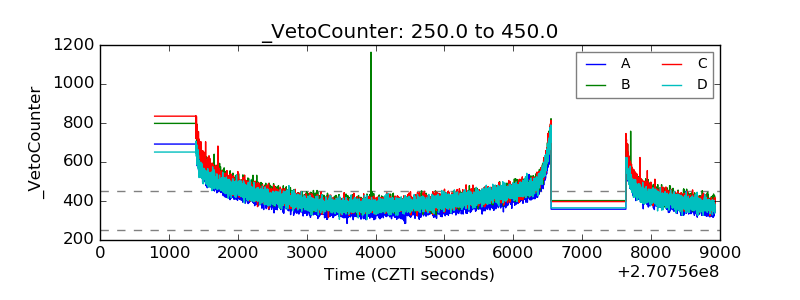 |