| Param | Original file | Final file |
|---|---|---|
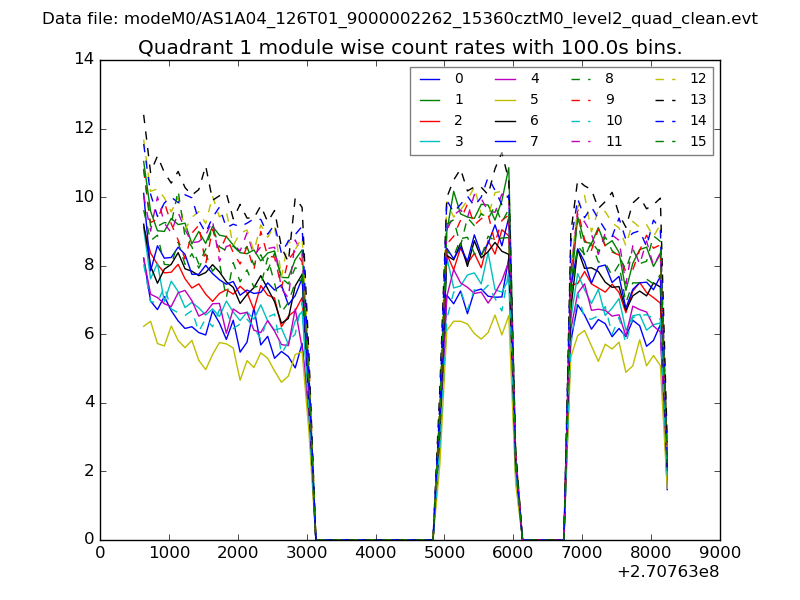
| Filename | modeM0/AS1A04_126T01_9000002262_15360cztM0_level2.evt | modeM0/AS1A04_126T01_9000002262_15360cztM0_level2_quad_clean.evt |
| Size (bytes) | 475,891,200 | 97,859,520 |
| Size | 453.8 MB | 93.3 MB |
| Events in quadrant A | 3,180,684 | 630,125 |
| Events in quadrant B | 3,779,057 | 632,487 |
| Events in quadrant C | 3,297,073 | 628,994 |
| Events in quadrant D | 3,691,885 | 596,127 |
| Mode M9 | |||
|---|---|---|---|
| Quadrant | BADHDUFLAG | Total packets | Discarded packets |
| A | 0 | 14 | 0 |
| B | 0 | 14 | 0 |
| C | 0 | 14 | 0 |
| D | 0 | 15 | 0 |
| Mode M0 | |||
|---|---|---|---|
| Quadrant | BADHDUFLAG | Total packets | Discarded packets |
| A | 0 | 14151 | 3 |
| B | 0 | 15728 | 2 |
| C | 0 | 14355 | 2 |
| D | 0 | 15536 | 2 |
| Mode SS | |||
|---|---|---|---|
| Quadrant | BADHDUFLAG | Total packets | Discarded packets |
| A | 0 | 138 | 0 |
| B | 0 | 138 | 0 |
| C | 0 | 138 | 0 |
| D | 0 | 138 | 0 |
| Quadrant | Total seconds | Saturated seconds | Saturation percentage |
|---|---|---|---|
| A | 6830 | 16 | 0.234261% |
| B | 6830 | 100 | 1.464129% |
| C | 6830 | 9 | 0.131772% |
| D | 6830 | 97 | 1.420205% |
Noise dominated data is calculated using 1-second bins in cleaned event files. If a bin has >2000 counts, and if more than 50% of those come from <1% of pixels, then it is considered to be noise-dominated and hence unusable.
| Quadrant | # 1 sec bins | Bins with >0 counts | Bins with >2000 counts | High rate bins dominated by noise | Noise dominated (total time) | Noise dominated (detector-on time) | Marked lightcurve |
|---|---|---|---|---|---|---|---|
| A | 7631 | 6832 | 3 | 3 | 0.04% | 0.04% | 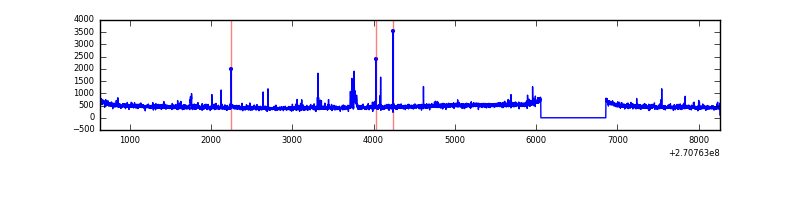 |
| B | 7631 | 6832 | 72 | 72 | 0.94% | 1.05% | 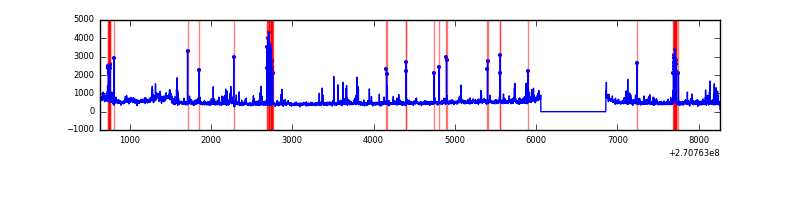 |
| C | 7631 | 6832 | 5 | 5 | 0.07% | 0.07% | 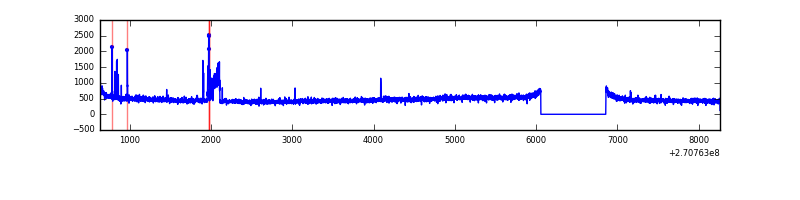 |
| D | 7631 | 6832 | 82 | 82 | 1.07% | 1.20% | 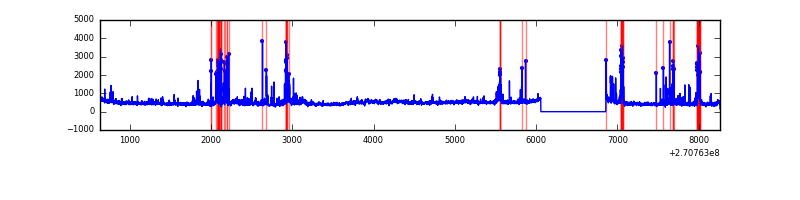 |
Top three noisy pixels from each quadrant. If the there are fewer than three noisy pixels in the level2.evt file, extra rows are filled as -1
| Pixel properties | Quadrant properties | ||||||
|---|---|---|---|---|---|---|---|
| Quadrant | DetID | PixID | Counts | Sigma | Mean | Median | Sigma |
| A | 15 | 239 | 54004 | 328.27 | 802 | 786 | 162.1 |
| A | 9 | 143 | 38923 | 235.24 | 802 | 786 | 162.1 |
| A | 13 | 248 | 7836 | 43.49 | 802 | 786 | 162.1 |
| B | 10 | 16 | 395765 | 2584.79 | 803 | 784 | 152.8 |
| B | 4 | 173 | 64673 | 418.09 | 803 | 784 | 152.8 |
| B | 0 | 190 | 46802 | 301.15 | 803 | 784 | 152.8 |
| C | 3 | 233 | 268860 | 1496.79 | 773 | 779 | 179.1 |
| C | 13 | 61 | 5517 | 26.45 | 773 | 779 | 179.1 |
| C | 4 | 238 | 5414 | 25.88 | 773 | 779 | 179.1 |
| D | 13 | 122 | 321016 | 1710.48 | 767 | 743 | 187.2 |
| D | 7 | 38 | 261770 | 1394.07 | 767 | 743 | 187.2 |
| D | 2 | 33 | 73370 | 387.88 | 767 | 743 | 187.2 |
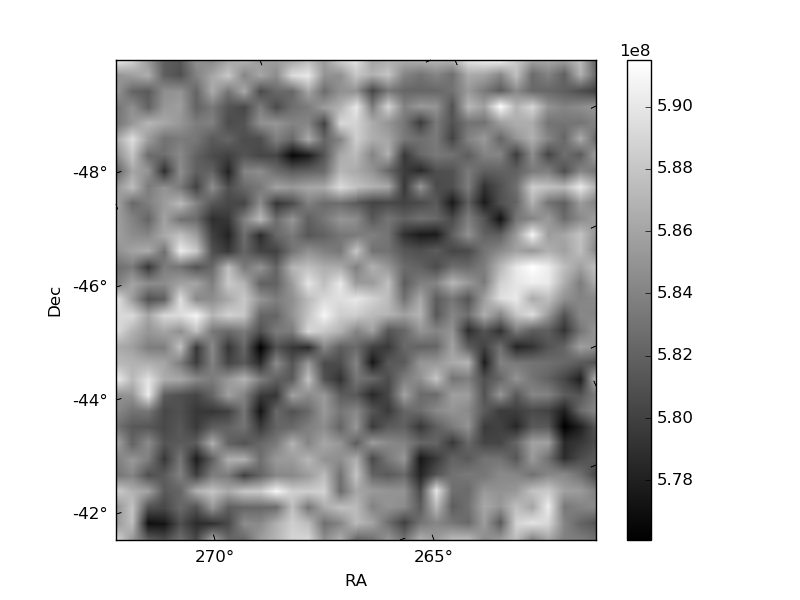
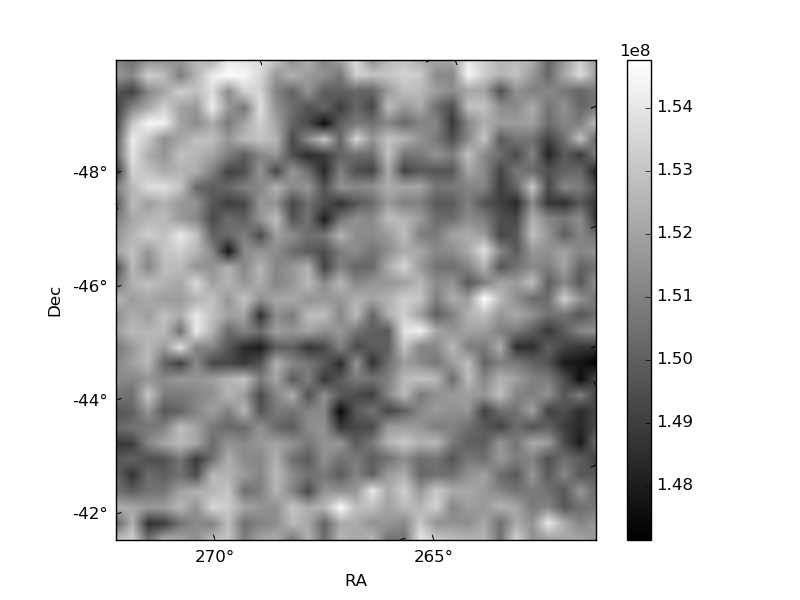
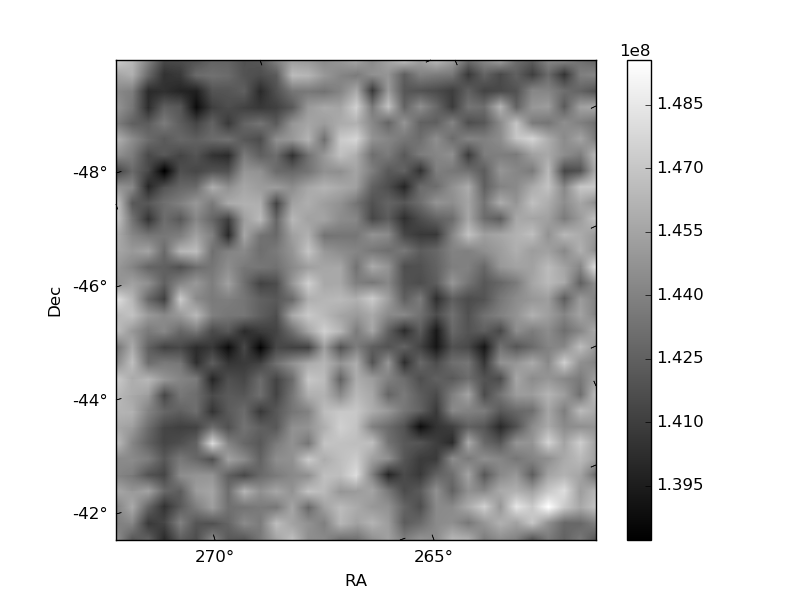
Histogram calculated using DETX and DETY for each event in the final _common_clean file
| Quadrant A | 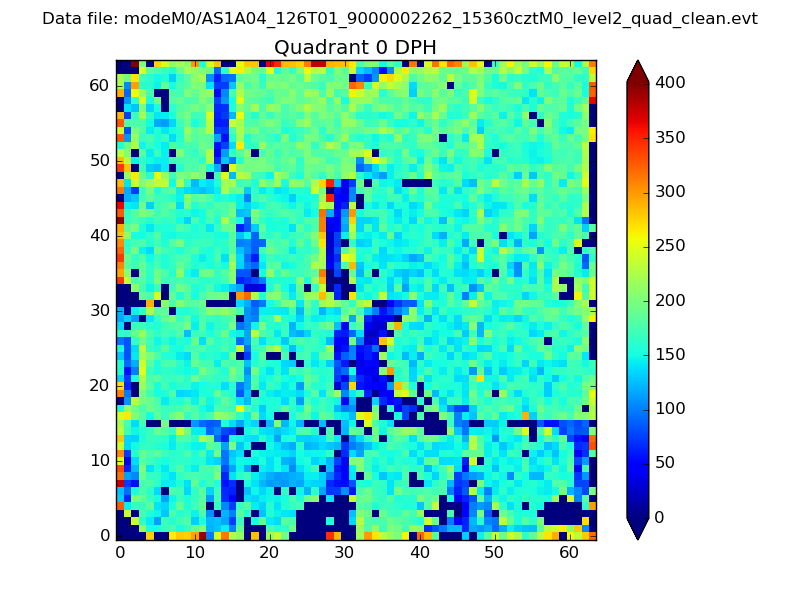 |
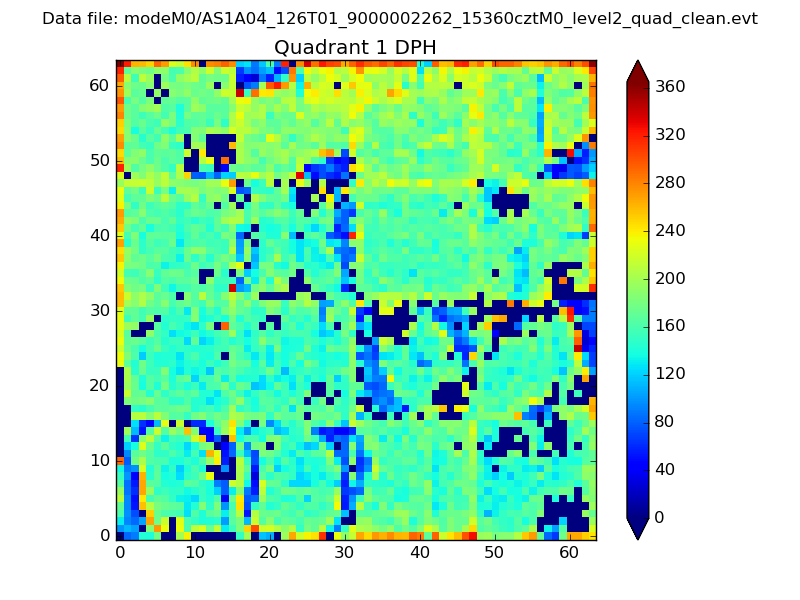 |
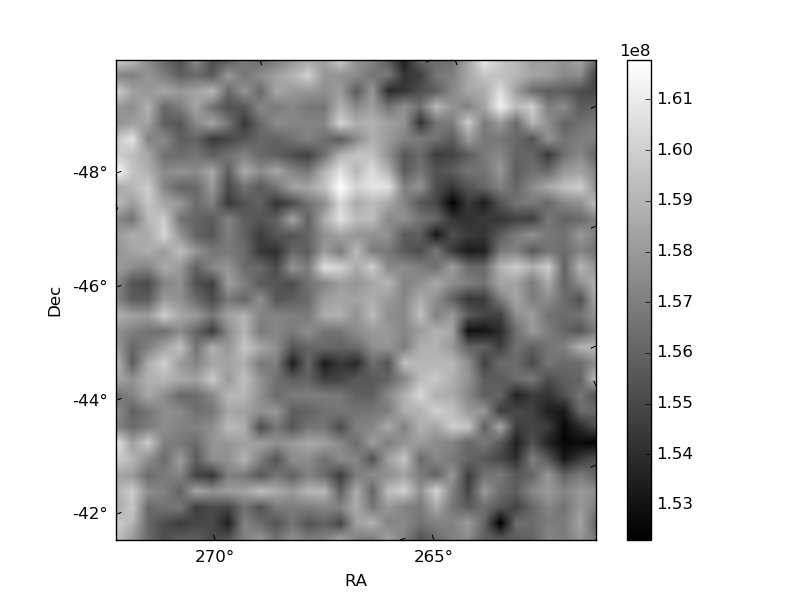
Quadrant B |
|---|---|---|---|
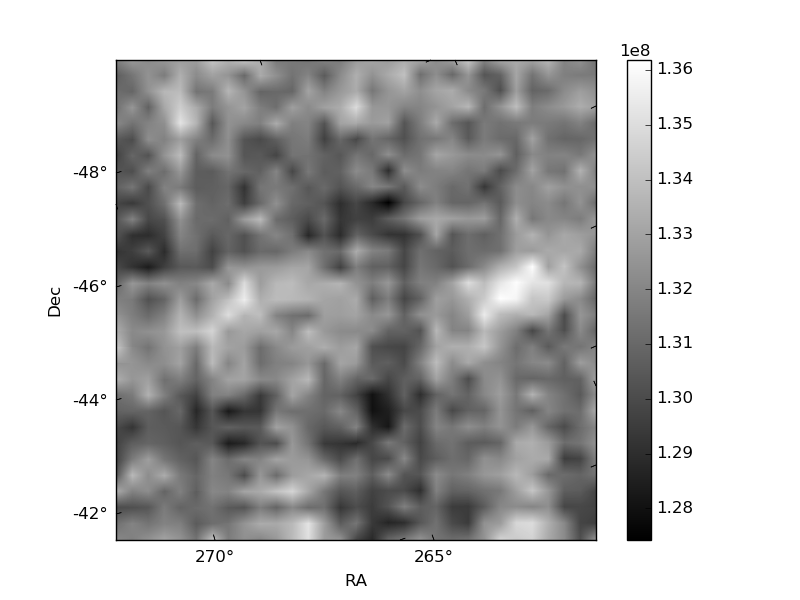
| Quadrant D | 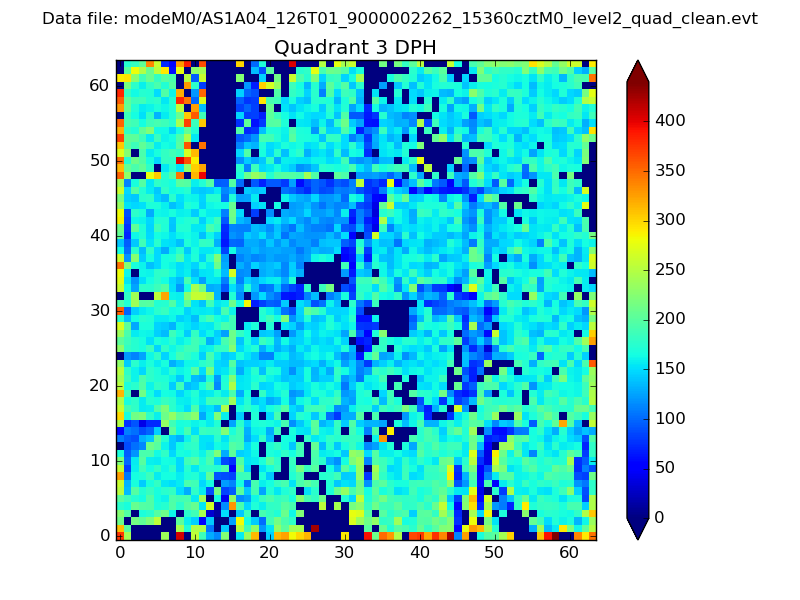 |
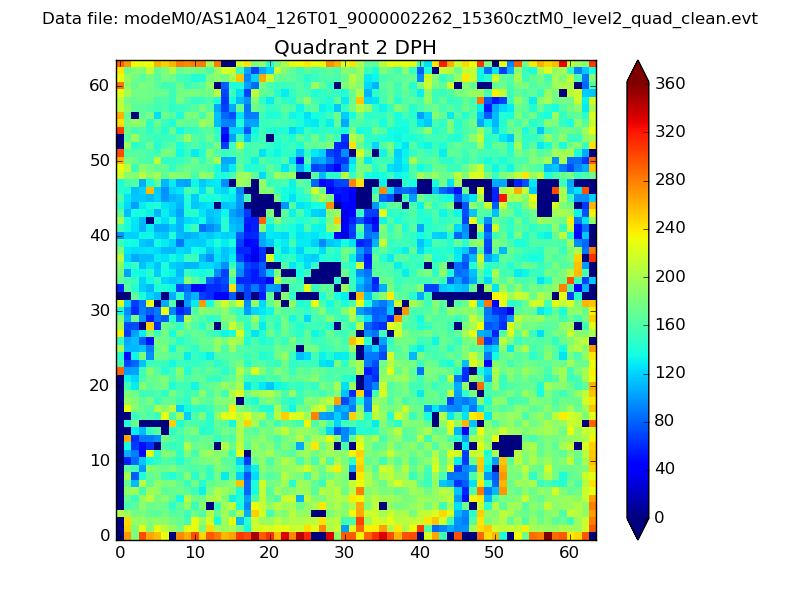 |
Quadrant C |
| Plot type | Count rate plots | Images |
|---|---|---|
| Comparison with Poisson distribution Blue bars denote a histogram of data divided into 1 sec bins. Red curve is a Poisson curve with rate = median count rate of data. |
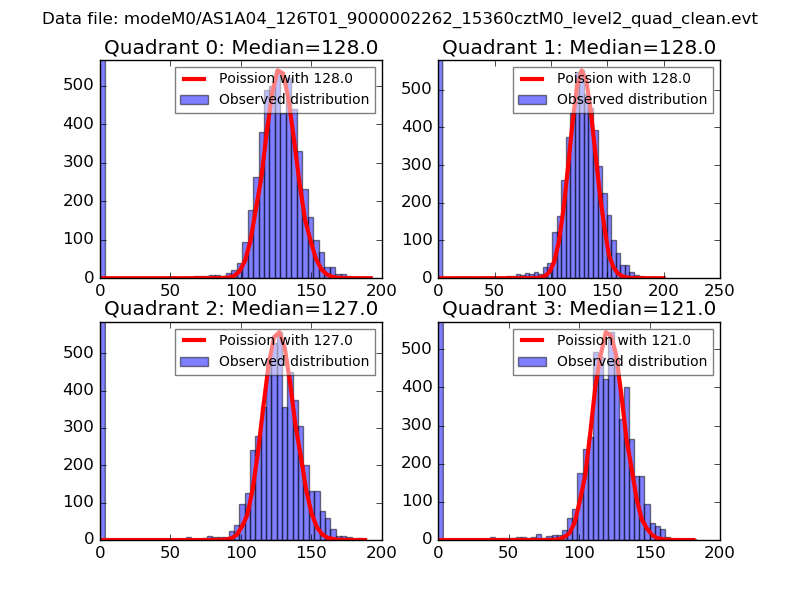 |
 |
| Quadrant-wise count rates Data is divided into 100 sec bins |
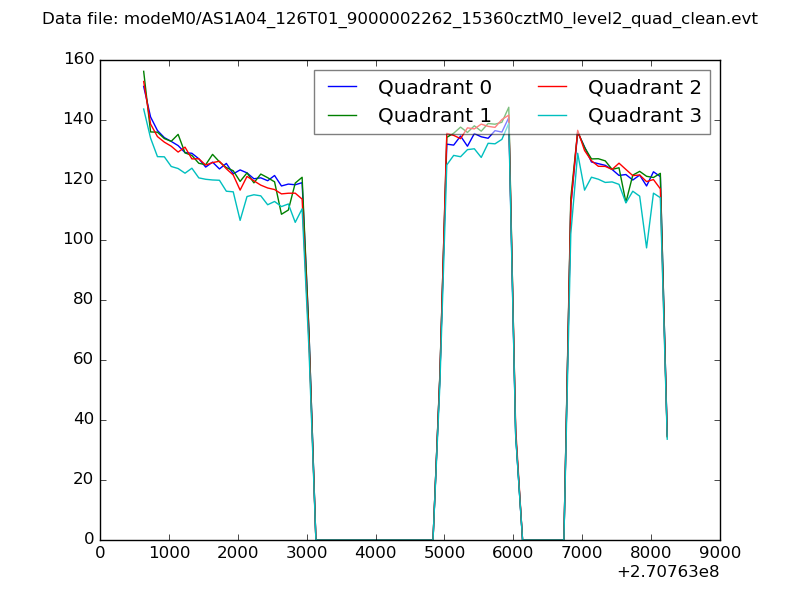 |
|
| Module-wise count rates for Quadrant A Data is divided into 100 sec bins |
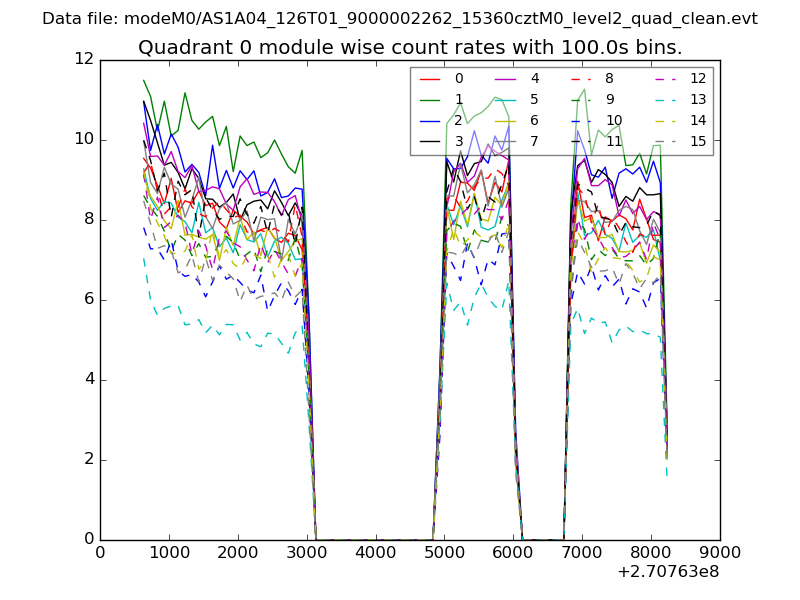 |
 |
| Module-wise count rates for Quadrant B Data is divided into 100 sec bins |
 |
 |
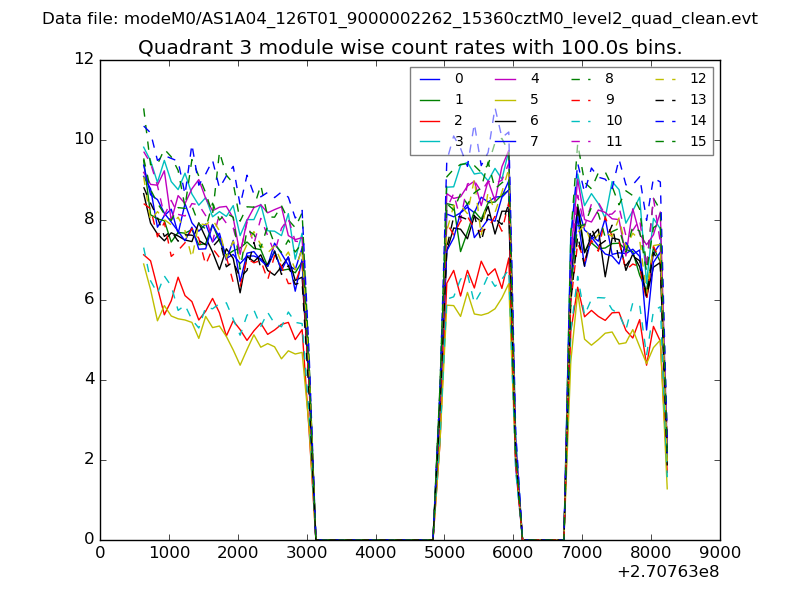
| Module-wise count rates for Quadrant C Data is divided into 100 sec bins |
 |
 |
| Module-wise count rates for Quadrant D Data is divided into 100 sec bins |
 |
 |
| Parameter | Plot |
|---|---|
| CZT HV Monitor | 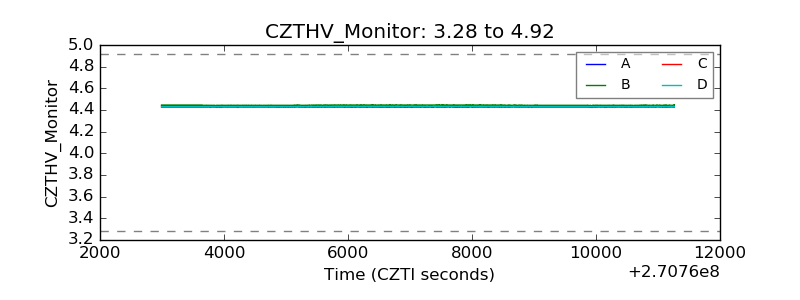 |
| D_VDD | 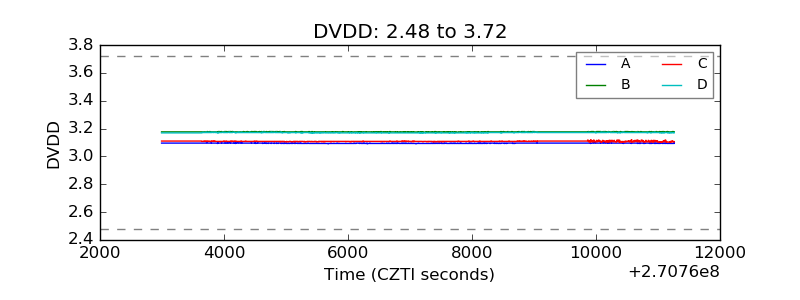 |
| Temperature 1 | 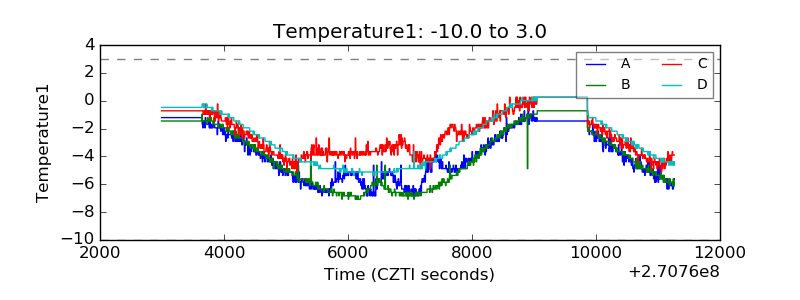 |
| Veto HV Monitor | 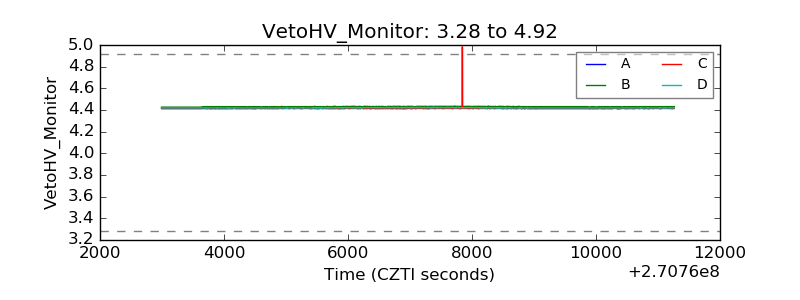 |
| Veto LLD |  |
| Alpha Counter | 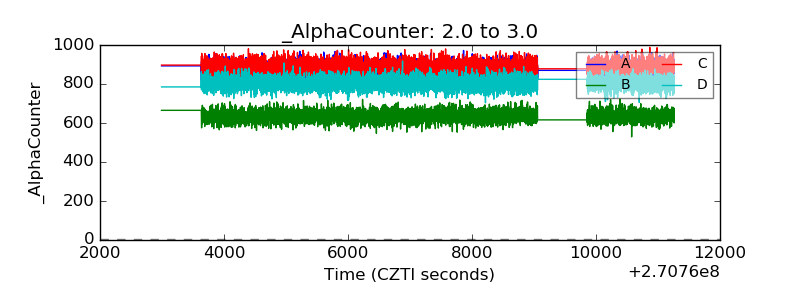 |
| _CPM_Rate | 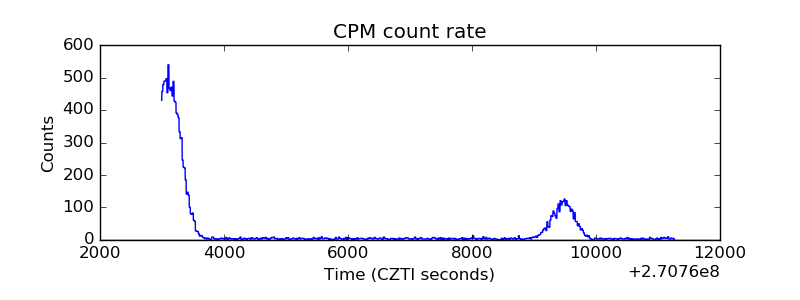 |
| CZT Counter | 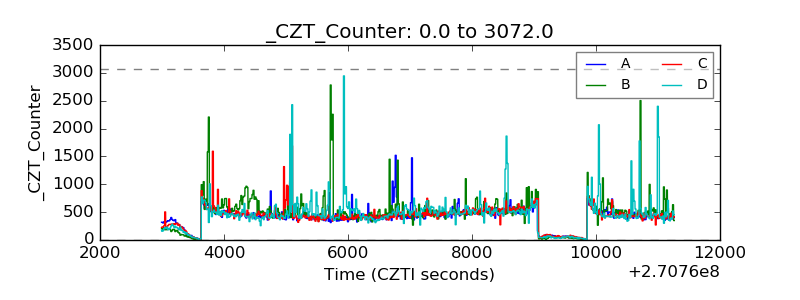 |
| +2.5 Volts monitor |  |
| +5 Volts monitor |  |
| _ROLL_ROT | 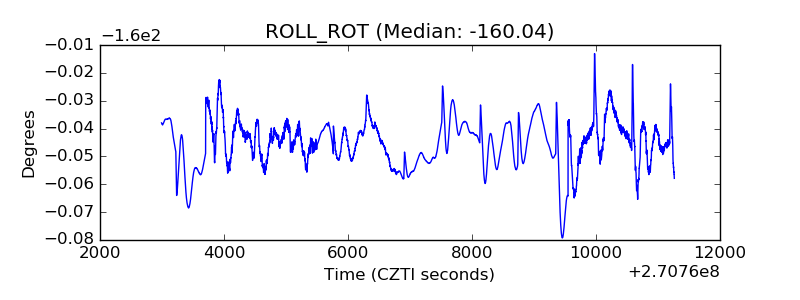 |
| _Roll_DEC | 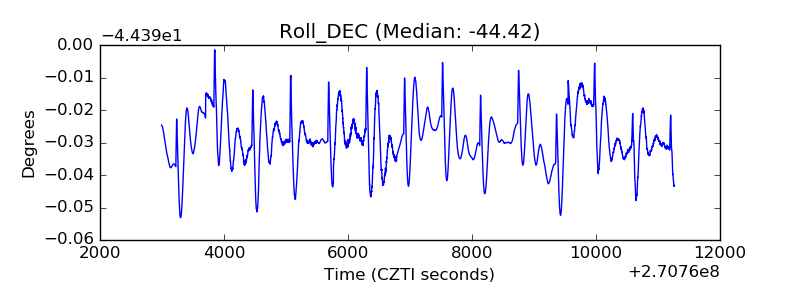 |
| _Roll_RA | 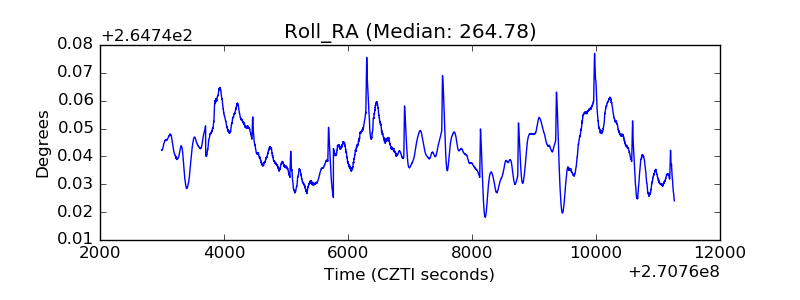 |
| Veto Counter | 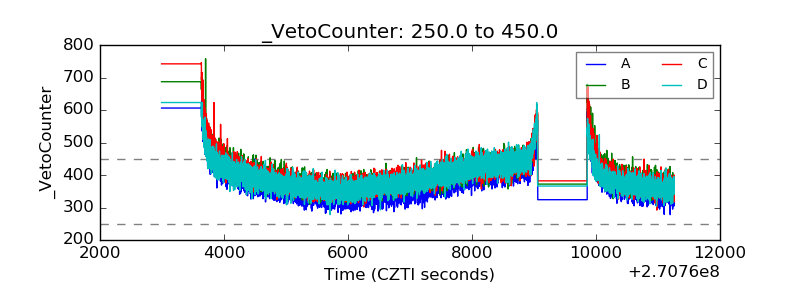 |