| Param | Original file | Final file |
|---|---|---|
| Filename | modeM0/AS1A04_126T01_9000002262_15365cztM0_level2.evt | modeM0/AS1A04_126T01_9000002262_15365cztM0_level2_quad_clean.evt |
| Size (bytes) | 692,449,920 | 129,536,640 |
| Size | 660.4 MB | 123.5 MB |
| Events in quadrant A | 4,671,189 | 804,455 |
| Events in quadrant B | 5,499,010 | 811,473 |
| Events in quadrant C | 4,988,630 | 811,015 |
| Events in quadrant D | 5,106,258 | 775,129 |
| Mode M9 | |||
|---|---|---|---|
| Quadrant | BADHDUFLAG | Total packets | Discarded packets |
| A | 0 | 11 | 0 |
| B | 0 | 11 | 0 |
| C | 0 | 11 | 0 |
| D | 0 | 11 | 0 |
| Mode M0 | |||
|---|---|---|---|
| Quadrant | BADHDUFLAG | Total packets | Discarded packets |
| A | 0 | 21215 | 2 |
| B | 0 | 23253 | 2 |
| C | 0 | 21366 | 2 |
| D | 0 | 22794 | 2 |
| Mode SS | |||
|---|---|---|---|
| Quadrant | BADHDUFLAG | Total packets | Discarded packets |
| A | 0 | 212 | 0 |
| B | 0 | 212 | 0 |
| C | 0 | 212 | 0 |
| D | 0 | 212 | 0 |
| Quadrant | Total seconds | Saturated seconds | Saturation percentage |
|---|---|---|---|
| A | 10409 | 75 | 0.720530% |
| B | 10409 | 163 | 1.565953% |
| C | 10409 | 81 | 0.778173% |
| D | 10409 | 153 | 1.469882% |
Noise dominated data is calculated using 1-second bins in cleaned event files. If a bin has >2000 counts, and if more than 50% of those come from <1% of pixels, then it is considered to be noise-dominated and hence unusable.
| Quadrant | # 1 sec bins | Bins with >0 counts | Bins with >2000 counts | High rate bins dominated by noise | Noise dominated (total time) | Noise dominated (detector-on time) | Marked lightcurve |
|---|---|---|---|---|---|---|---|
| A | 11480 | 10412 | 0 | 0 | 0.00% | 0.00% | 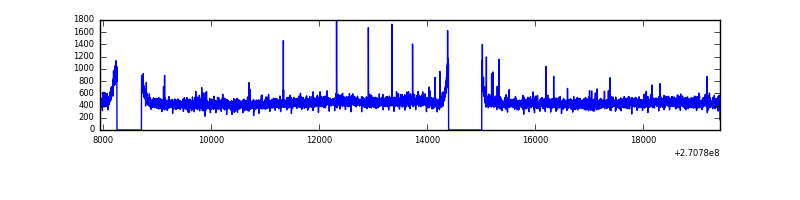 |
| B | 11480 | 10411 | 32 | 32 | 0.28% | 0.31% | 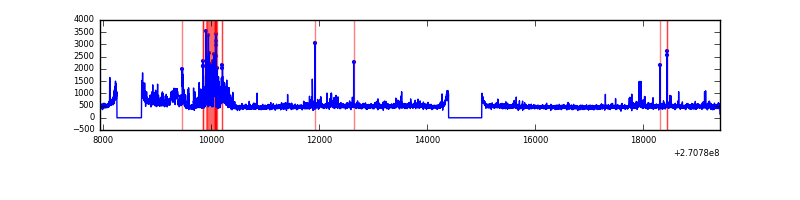 |
| C | 11480 | 10411 | 0 | 0 | 0.00% | 0.00% | 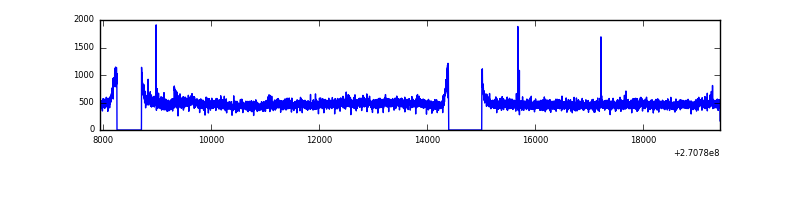 |
| D | 11480 | 10411 | 77 | 77 | 0.67% | 0.74% | 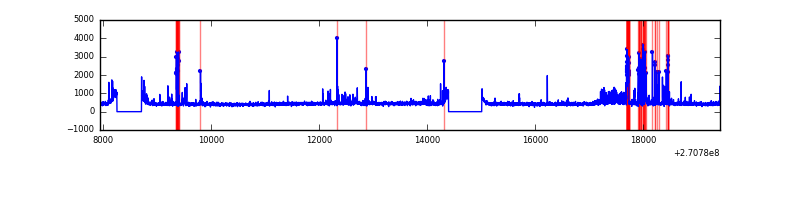 |
Top three noisy pixels from each quadrant. If the there are fewer than three noisy pixels in the level2.evt file, extra rows are filled as -1
| Pixel properties | Quadrant properties | ||||||
|---|---|---|---|---|---|---|---|
| Quadrant | DetID | PixID | Counts | Sigma | Mean | Median | Sigma |
| A | 9 | 143 | 33184 | 131.13 | 1204 | 1179 | 244.1 |
| A | 15 | 239 | 10593 | 38.57 | 1204 | 1179 | 244.1 |
| A | 0 | 226 | 10576 | 38.5 | 1204 | 1179 | 244.1 |
| B | 10 | 245 | 547343 | 2357.76 | 1204 | 1173 | 231.6 |
| B | 0 | 229 | 65410 | 277.3 | 1204 | 1173 | 231.6 |
| B | 4 | 173 | 30875 | 128.22 | 1204 | 1173 | 231.6 |
| C | 3 | 233 | 412092 | 1504.66 | 1173 | 1179 | 273.1 |
| C | 13 | 61 | 8382 | 26.38 | 1173 | 1179 | 273.1 |
| C | 10 | 22 | 5288 | 15.05 | 1173 | 1179 | 273.1 |
| D | 2 | 33 | 265906 | 930.14 | 1169 | 1136 | 284.7 |
| D | 1 | 255 | 177039 | 617.95 | 1169 | 1136 | 284.7 |
| D | 13 | 172 | 105554 | 366.82 | 1169 | 1136 | 284.7 |
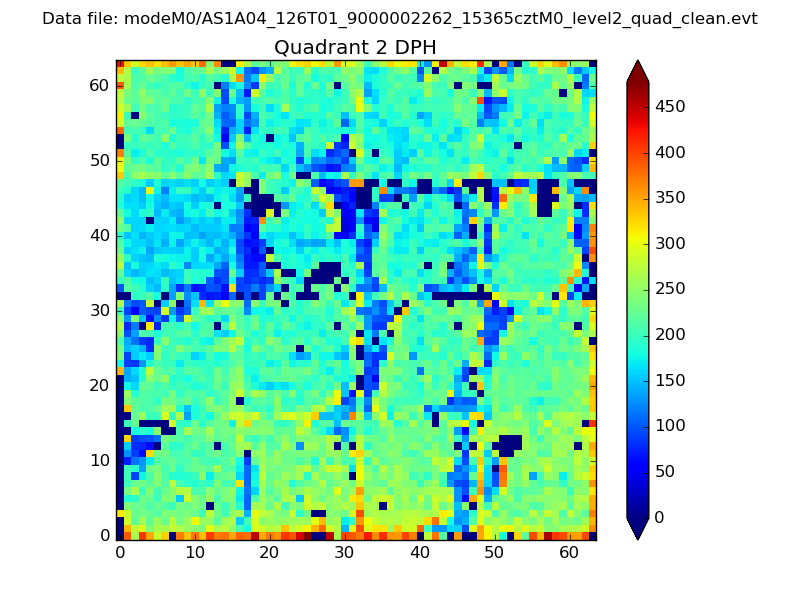
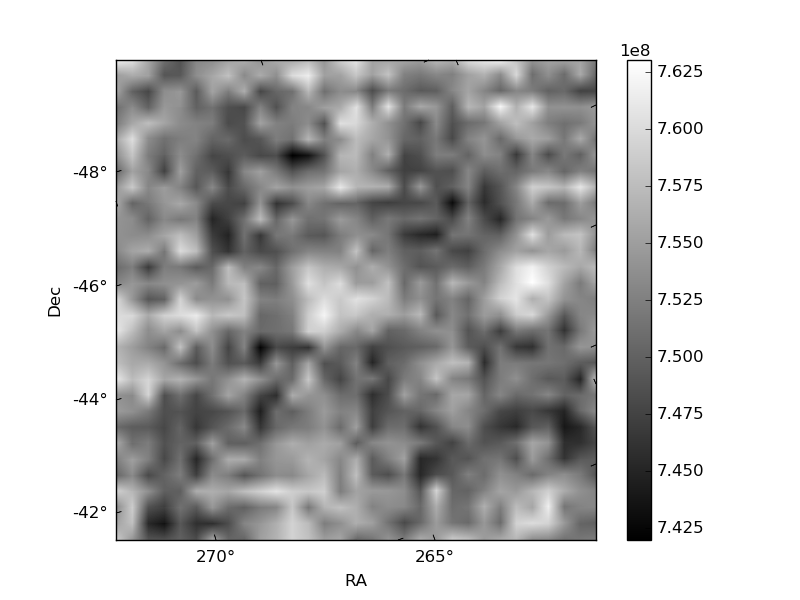
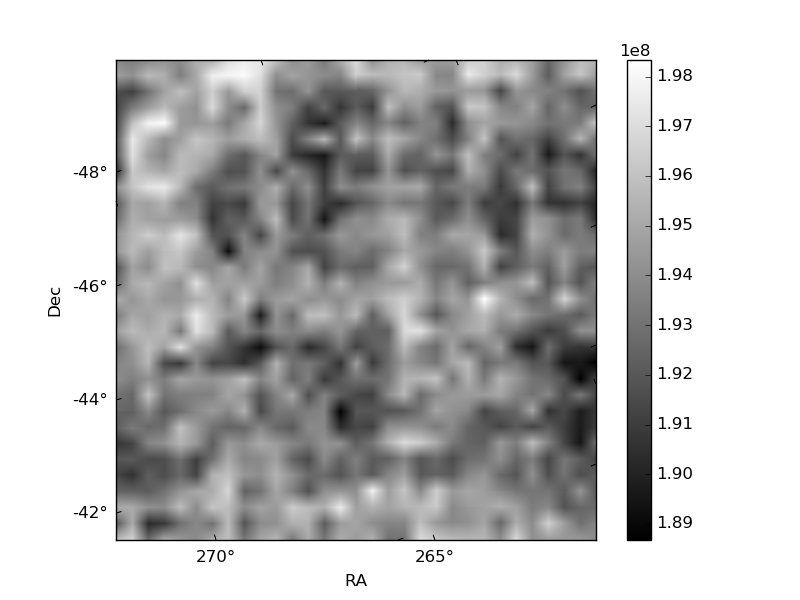
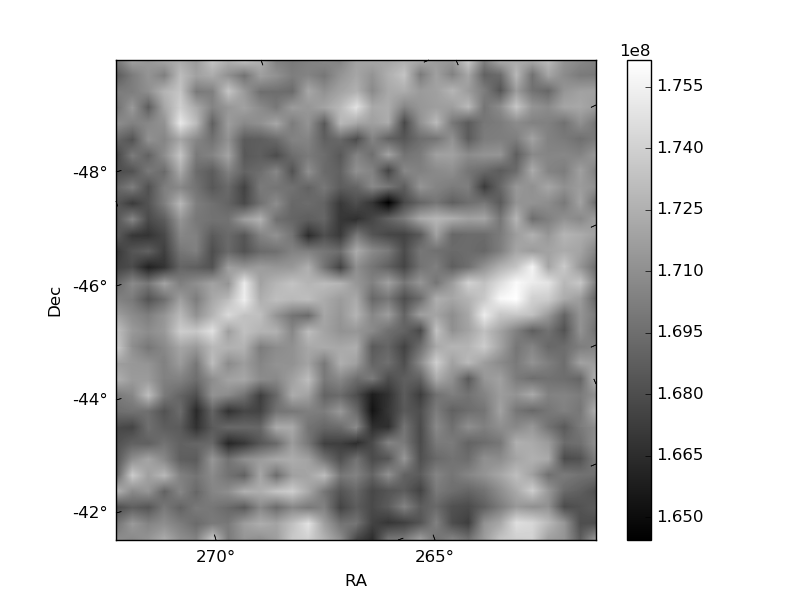
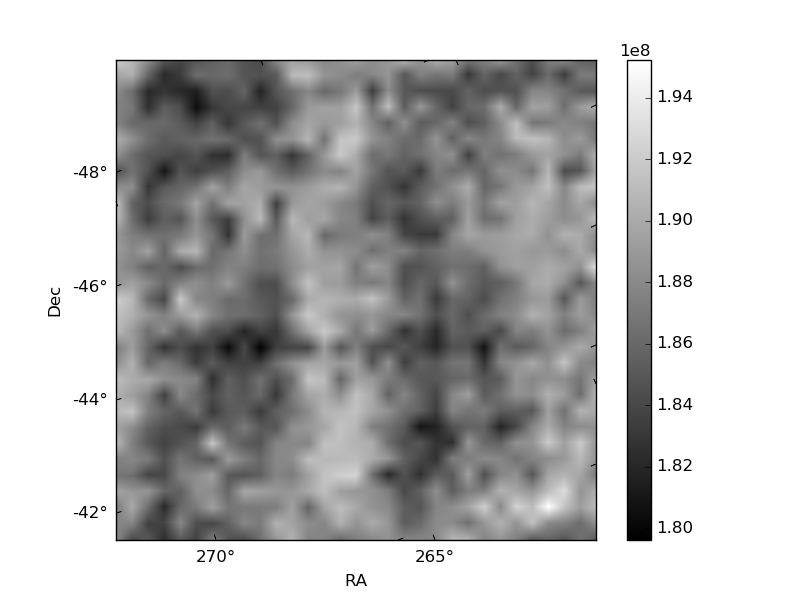
Histogram calculated using DETX and DETY for each event in the final _common_clean file
| Quadrant A | 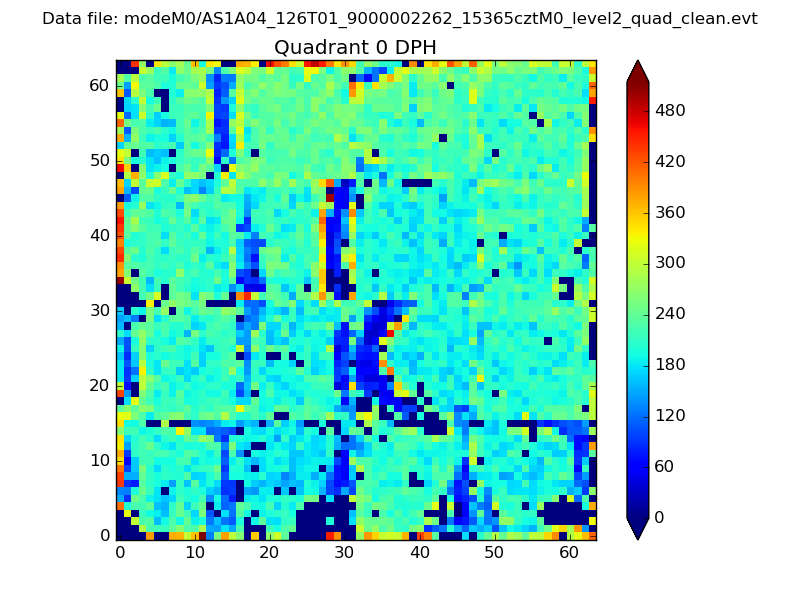 |
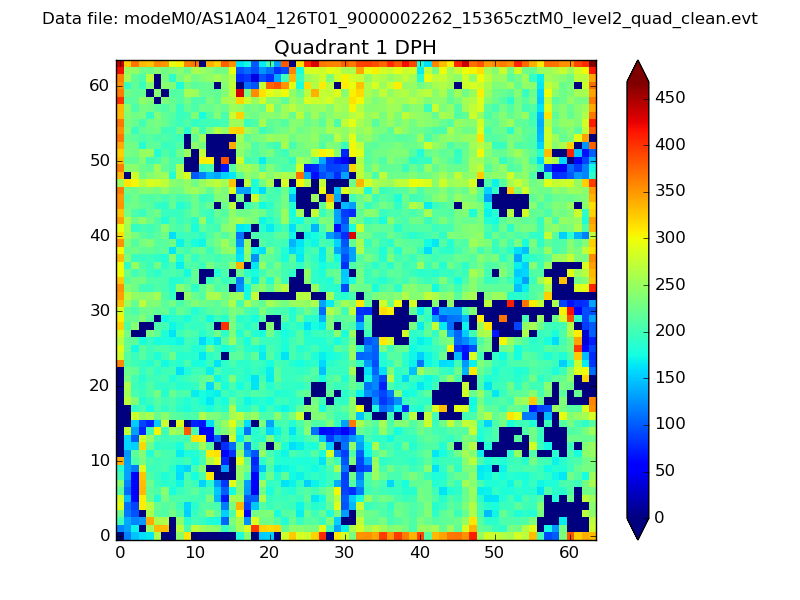 |
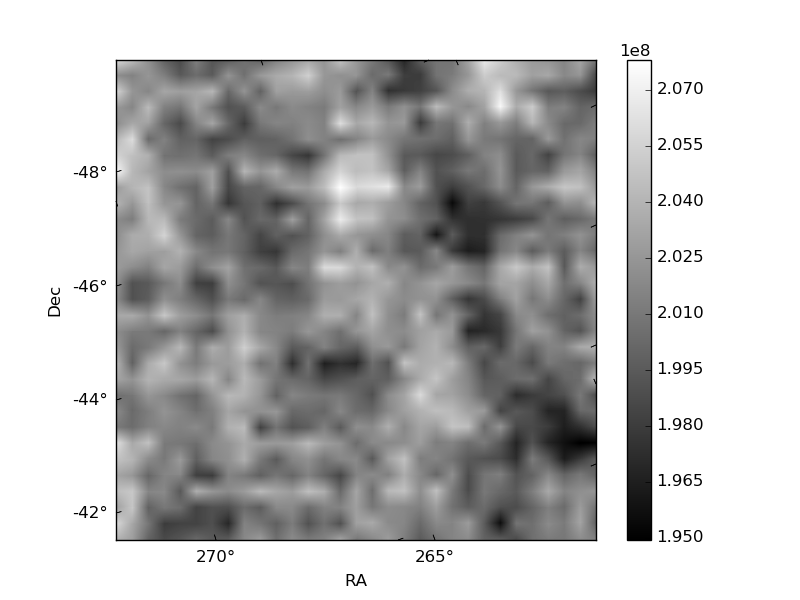
Quadrant B |
|---|---|---|---|
| Quadrant D | 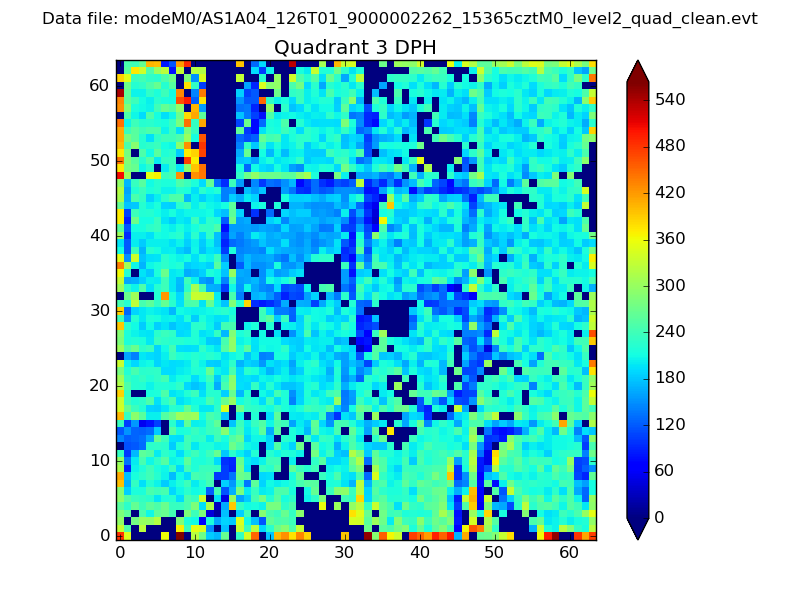 |
 |
Quadrant C |
| Plot type | Count rate plots | Images |
|---|---|---|
| Comparison with Poisson distribution Blue bars denote a histogram of data divided into 1 sec bins. Red curve is a Poisson curve with rate = median count rate of data. |
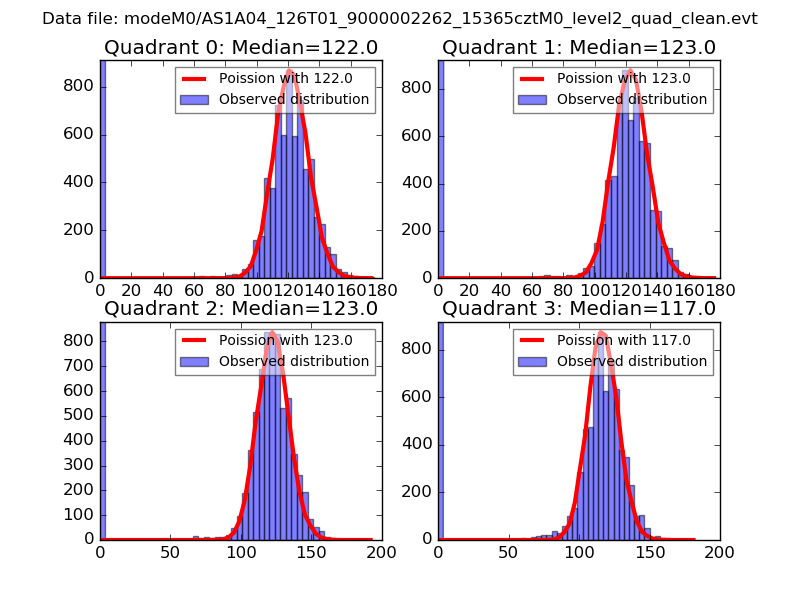 |
 |
| Quadrant-wise count rates Data is divided into 100 sec bins |
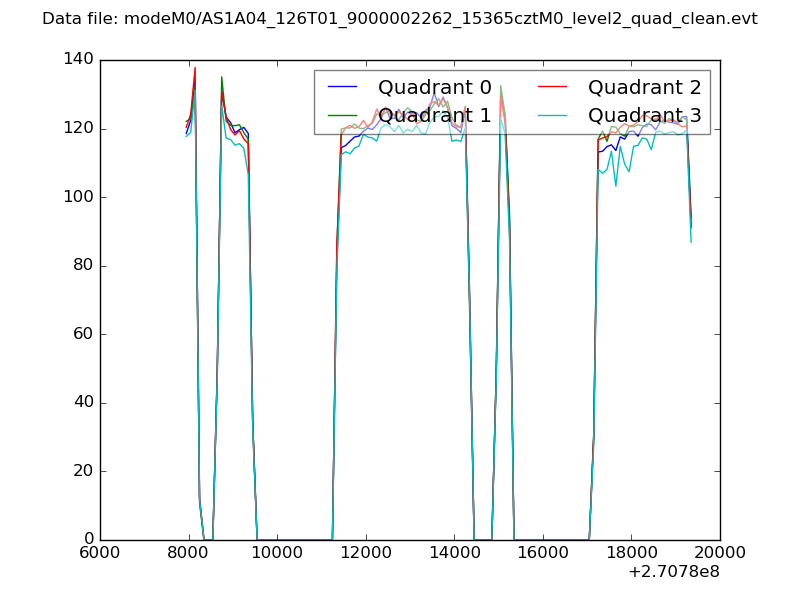 |
|
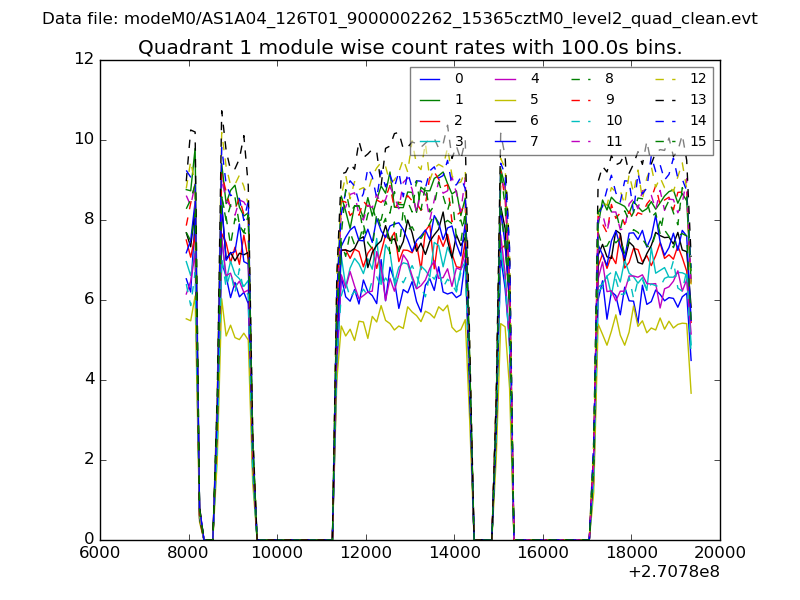
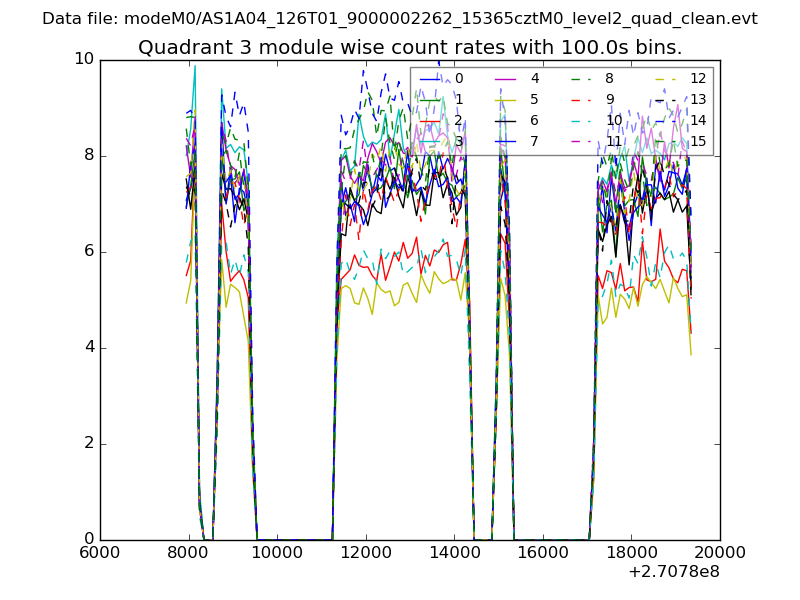
| Module-wise count rates for Quadrant A Data is divided into 100 sec bins |
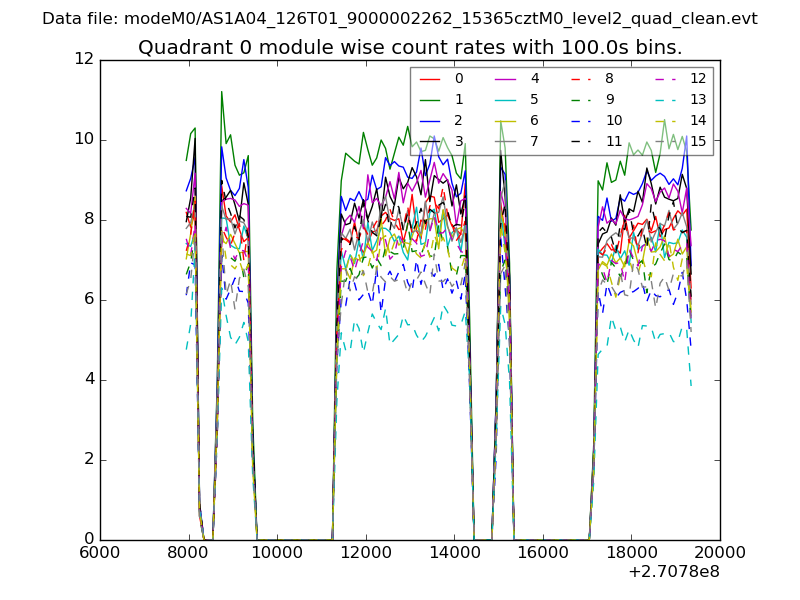 |
 |
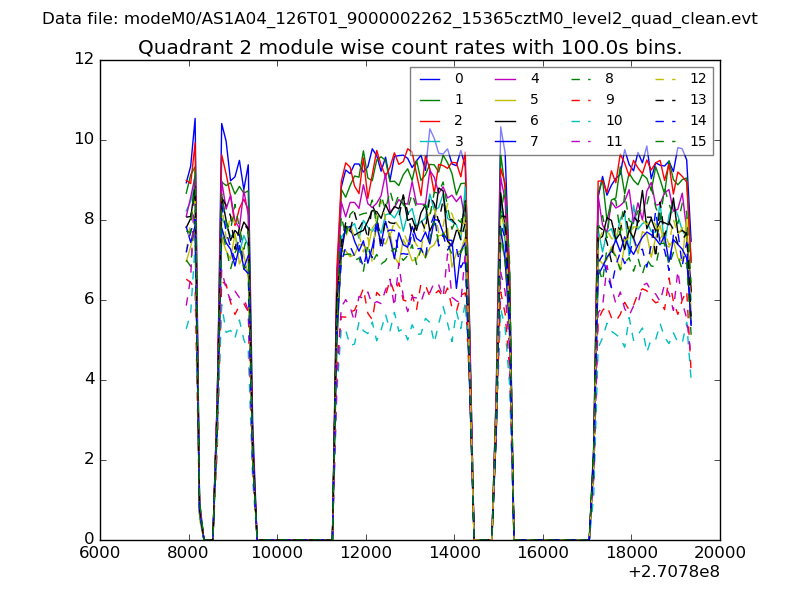
| Module-wise count rates for Quadrant B Data is divided into 100 sec bins |
 |
 |
| Module-wise count rates for Quadrant C Data is divided into 100 sec bins |
 |
 |
| Module-wise count rates for Quadrant D Data is divided into 100 sec bins |
 |
 |
| Parameter | Plot |
|---|---|
| CZT HV Monitor | 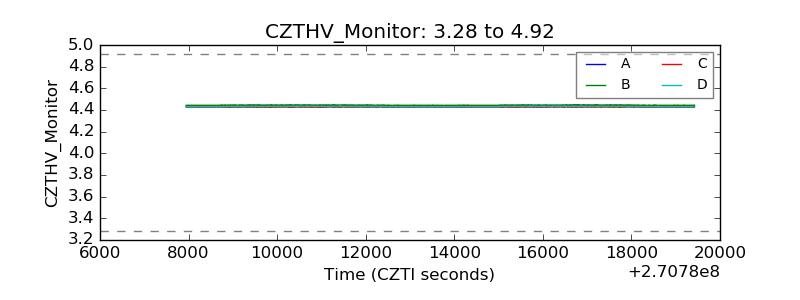 |
| D_VDD | 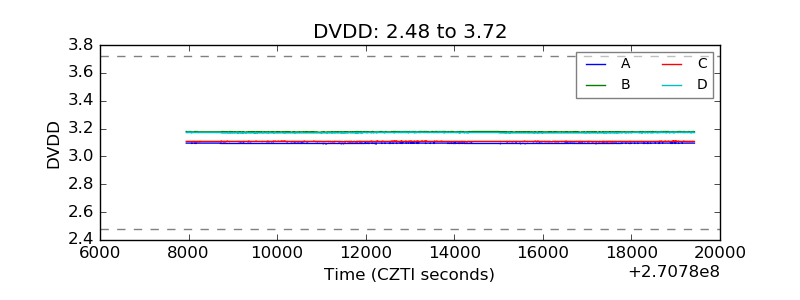 |
| Temperature 1 | 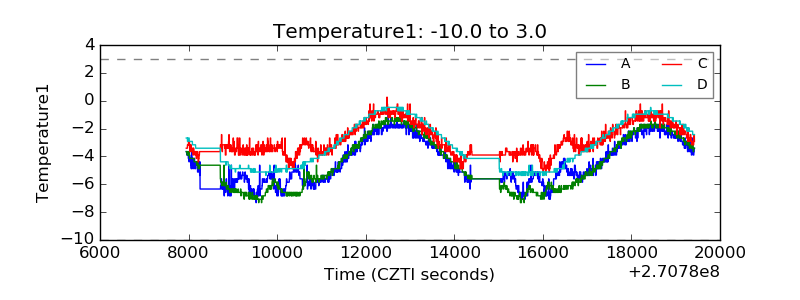 |
| Veto HV Monitor | 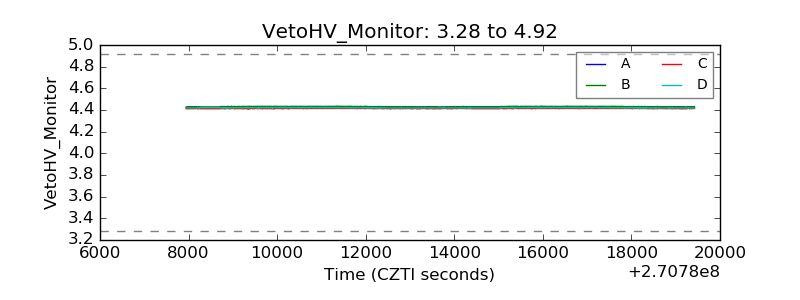 |
| Veto LLD | 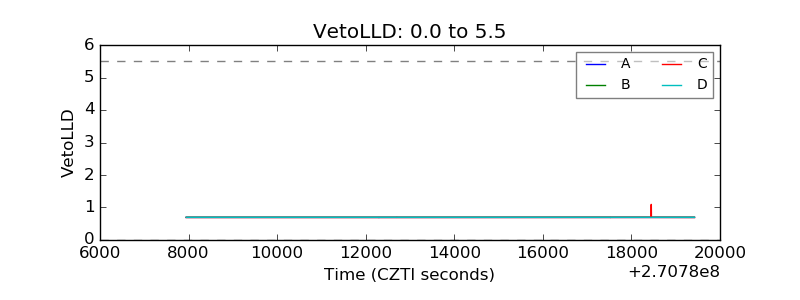 |
| Alpha Counter | 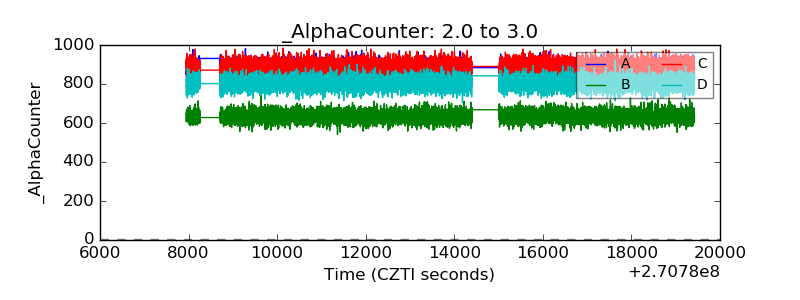 |
| _CPM_Rate | 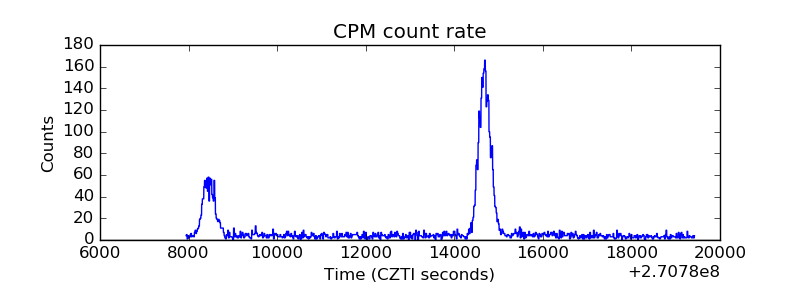 |
| CZT Counter | 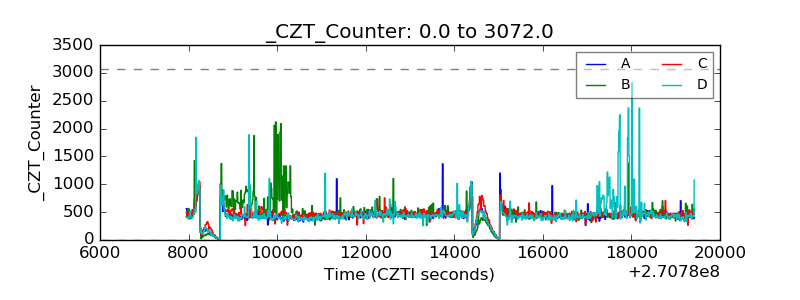 |
| +2.5 Volts monitor |  |
| +5 Volts monitor |  |
| _ROLL_ROT |  |
| _Roll_DEC | 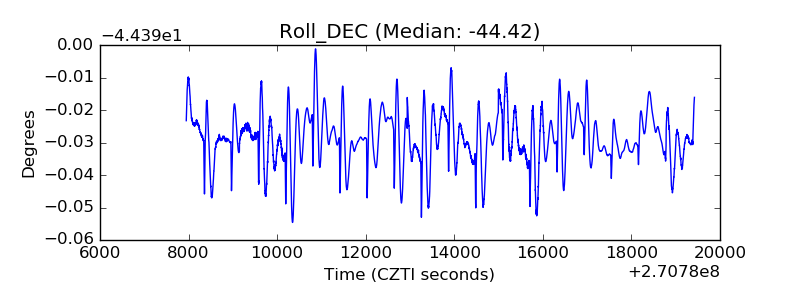 |
| _Roll_RA | 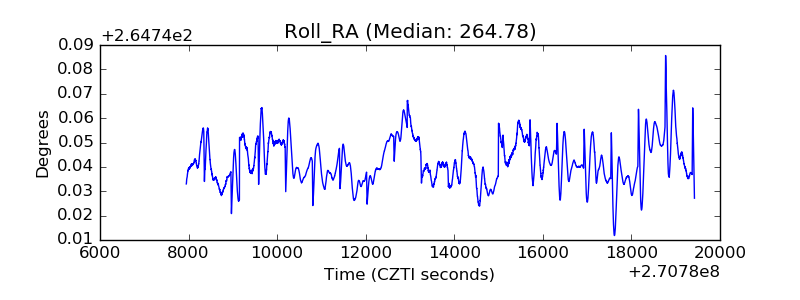 |
| Veto Counter | 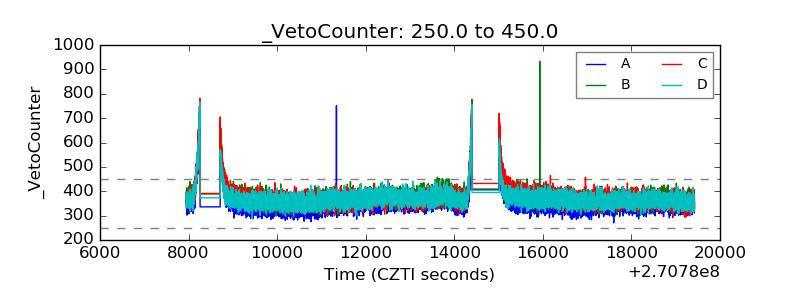 |