| Param | Original file | Final file |
|---|---|---|
| Filename | modeM0/AS1A04_049T01_9000002266cztM0_level2.fits | modeM0/AS1A04_049T01_9000002266cztM0_level2_quad_clean.evt |
| Size (bytes) | 160,404,480 | 179,910,720 |
| Size | 153.0 MB | 171.6 MB |
| Events in quadrant A | 973,030 | 1,113,865 |
| Events in quadrant B | 931,432 | 1,110,961 |
| Events in quadrant C | 940,236 | 1,052,676 |
| Events in quadrant D | 830,252 | 987,900 |
| Mode SS | |||
|---|---|---|---|
| Quadrant | BADHDUFLAG | Total packets | Discarded packets |
| A | 0 | 350 | 0 |
| B | 0 | 350 | 0 |
| C | 0 | 350 | 0 |
| D | 0 | 350 | 0 |
| Mode M0 | |||
|---|---|---|---|
| Quadrant | BADHDUFLAG | Total packets | Discarded packets |
| A | 0 | 36531 | 0 |
| B | 0 | 37010 | 0 |
| C | 0 | 49417 | 0 |
| D | 0 | 38788 | 0 |
| Mode M9 | |||
|---|---|---|---|
| Quadrant | BADHDUFLAG | Total packets | Discarded packets |
| A | 0 | 28 | 0 |
| B | 0 | 28 | 0 |
| C | 0 | 28 | 0 |
| D | 0 | 28 | 0 |
| Quadrant | Total seconds | Saturated seconds | Saturation percentage |
|---|---|---|---|
| A | 17153 | 203 | 1.183466% |
| B | 17153 | 205 | 1.195126% |
| C | 17153 | 481 | 2.804174% |
| D | 17153 | 320 | 1.865563% |
Noise dominated data is calculated using 1-second bins in cleaned event files. If a bin has >2000 counts, and if more than 50% of those come from <1% of pixels, then it is considered to be noise-dominated and hence unusable.
| Quadrant | # 1 sec bins | Bins with >0 counts | Bins with >2000 counts | High rate bins dominated by noise | Noise dominated (total time) | Noise dominated (detector-on time) | Marked lightcurve |
|---|---|---|---|---|---|---|---|
| A | 19928 | 17152 | 0 | 0 | 0.00% | 0.00% |  |
| B | 19928 | 17152 | 0 | 0 | 0.00% | 0.00% |  |
| C | 19928 | 17150 | 0 | 0 | 0.00% | 0.00% |  |
| D | 19928 | 17147 | 0 | 0 | 0.00% | 0.00% |  |
Top three noisy pixels from each quadrant. If the there are fewer than three noisy pixels in the level2.evt file, extra rows are filled as -1
| Pixel properties | Quadrant properties | ||||||
|---|---|---|---|---|---|---|---|
| Quadrant | DetID | PixID | Counts | Sigma | Mean | Median | Sigma |
| A | 0 | 29 | 955 | 11.15 | 253 | 238 | 64.3 |
| A | 7 | 110 | 827 | 9.16 | 253 | 238 | 64.3 |
| A | 0 | 30 | 757 | 8.07 | 253 | 238 | 64.3 |
| B | 2 | 9 | 752 | 10.24 | 246 | 235 | 50.5 |
| B | 2 | 8 | 633 | 7.88 | 246 | 235 | 50.5 |
| B | 5 | 225 | 630 | 7.82 | 246 | 235 | 50.5 |
| C | 2 | 191 | 647 | 6.24 | 248 | 232 | 66.5 |
| C | 3 | 126 | 638 | 6.11 | 248 | 232 | 66.5 |
| C | 9 | 233 | 635 | 6.06 | 248 | 232 | 66.5 |
| D | 10 | 189 | 633 | 6.47 | 237 | 215 | 64.6 |
| D | 7 | 3 | 601 | 5.97 | 237 | 215 | 64.6 |
| D | 10 | 113 | 595 | 5.88 | 237 | 215 | 64.6 |
Histogram calculated using DETX and DETY for each event in the final _common_clean file
| Quadrant A |  |
 |
Quadrant B |
|---|---|---|---|
| Quadrant D |  |
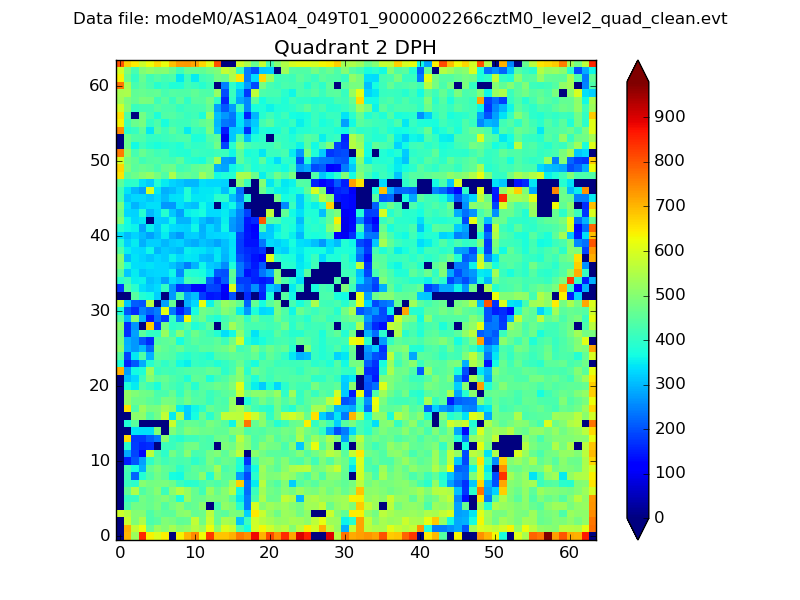 |
Quadrant C |
| Plot type | Count rate plots | Images |
|---|---|---|
| Comparison with Poisson distribution Blue bars denote a histogram of data divided into 1 sec bins. Red curve is a Poisson curve with rate = median count rate of data. |
 |
 |
| Quadrant-wise count rates Data is divided into 100 sec bins |
 |
|
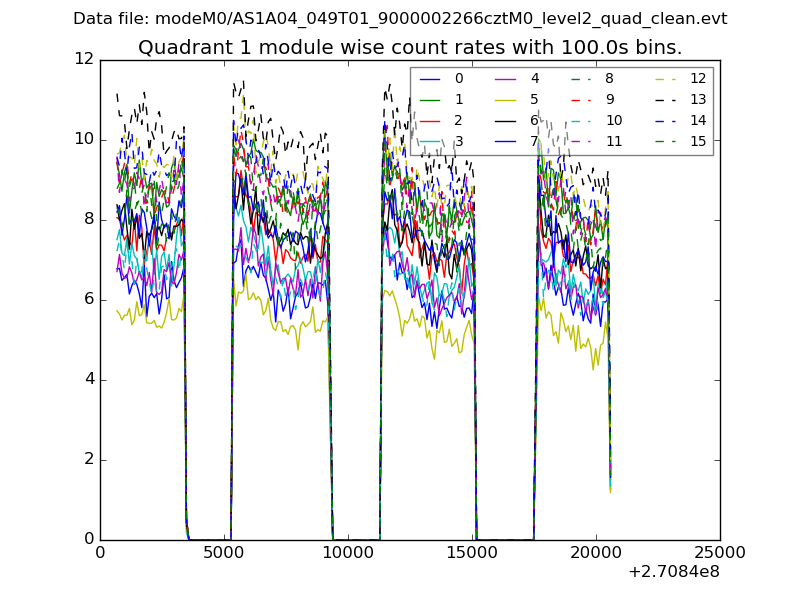
| Module-wise count rates for Quadrant A Data is divided into 100 sec bins |
 |
 |
| Module-wise count rates for Quadrant B Data is divided into 100 sec bins |
 |
 |
| Module-wise count rates for Quadrant C Data is divided into 100 sec bins |
 |
 |
| Module-wise count rates for Quadrant D Data is divided into 100 sec bins |
 |
 |
| Parameter | Plot |
|---|---|
| CZT HV Monitor |  |
| D_VDD | 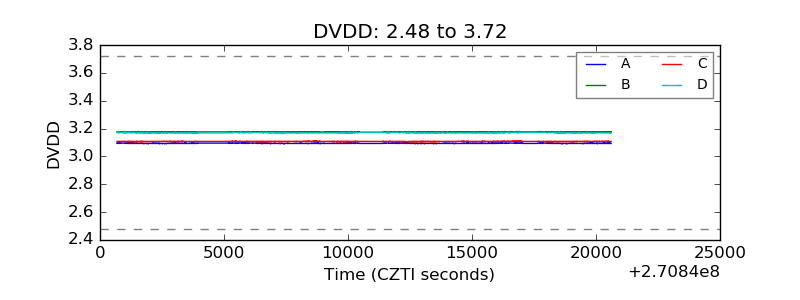 |
| Temperature 1 |  |
| Veto HV Monitor |  |
| Veto LLD |  |
| Alpha Counter |  |
| _CPM_Rate | 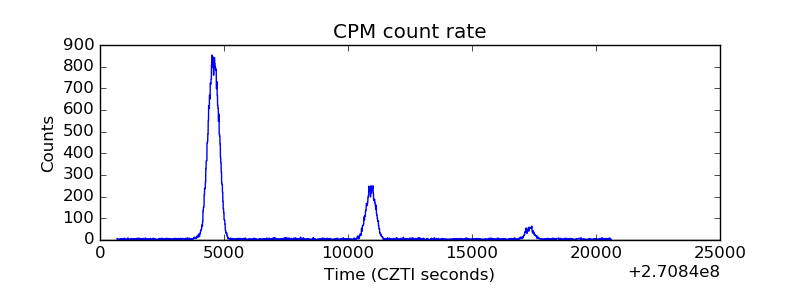 |
| CZT Counter |  |
| +2.5 Volts monitor |  |
| +5 Volts monitor |  |
| _ROLL_ROT | 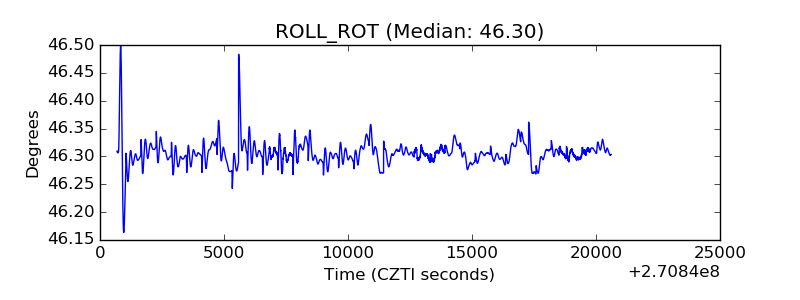 |
| _Roll_DEC |  |
| _Roll_RA | 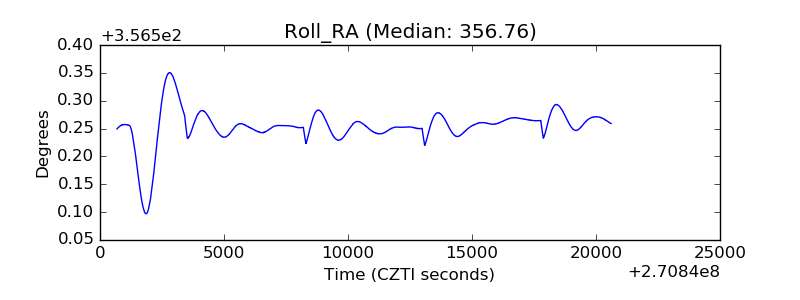 |
| Veto Counter |  |