| Param | Original file | Final file |
|---|---|---|
| Filename | modeM0/AS1A04_049T01_9000002266_15373cztM0_level2.evt | modeM0/AS1A04_049T01_9000002266_15373cztM0_level2_quad_clean.evt |
| Size (bytes) | 335,278,080 | 77,466,240 |
| Size | 319.7 MB | 73.9 MB |
| Events in quadrant A | 2,442,516 | 514,536 |
| Events in quadrant B | 2,431,905 | 517,337 |
| Events in quadrant C | 2,238,422 | 508,627 |
| Events in quadrant D | 2,726,392 | 481,142 |
| Mode SS | |||
|---|---|---|---|
| Quadrant | BADHDUFLAG | Total packets | Discarded packets |
| A | 0 | 96 | 0 |
| B | 0 | 96 | 0 |
| C | 0 | 96 | 0 |
| D | 0 | 96 | 0 |
| Mode M0 | |||
|---|---|---|---|
| Quadrant | BADHDUFLAG | Total packets | Discarded packets |
| A | 0 | 10491 | 2 |
| B | 0 | 10279 | 1 |
| C | 0 | 9606 | 1 |
| D | 0 | 11345 | 1 |
| Mode M9 | |||
|---|---|---|---|
| Quadrant | BADHDUFLAG | Total packets | Discarded packets |
| A | 0 | 12 | 0 |
| B | 0 | 12 | 0 |
| C | 0 | 12 | 0 |
| D | 0 | 12 | 0 |
| Quadrant | Total seconds | Saturated seconds | Saturation percentage |
|---|---|---|---|
| A | 4606 | 157 | 3.408597% |
| B | 4606 | 135 | 2.930960% |
| C | 4606 | 70 | 1.519757% |
| D | 4606 | 237 | 5.145462% |
Noise dominated data is calculated using 1-second bins in cleaned event files. If a bin has >2000 counts, and if more than 50% of those come from <1% of pixels, then it is considered to be noise-dominated and hence unusable.
| Quadrant | # 1 sec bins | Bins with >0 counts | Bins with >2000 counts | High rate bins dominated by noise | Noise dominated (total time) | Noise dominated (detector-on time) | Marked lightcurve |
|---|---|---|---|---|---|---|---|
| A | 5822 | 4607 | 44 | 44 | 0.76% | 0.96% | 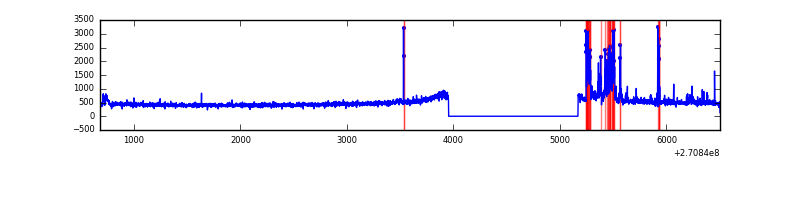 |
| B | 5822 | 4607 | 15 | 15 | 0.26% | 0.33% | 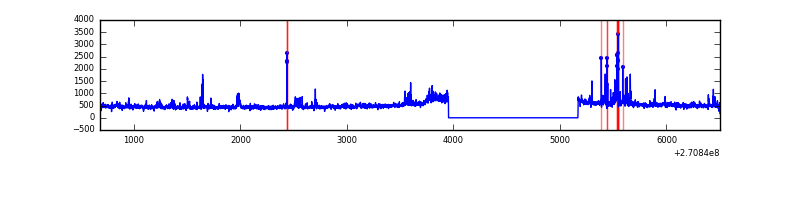 |
| C | 5822 | 4607 | 0 | 0 | 0.00% | 0.00% | 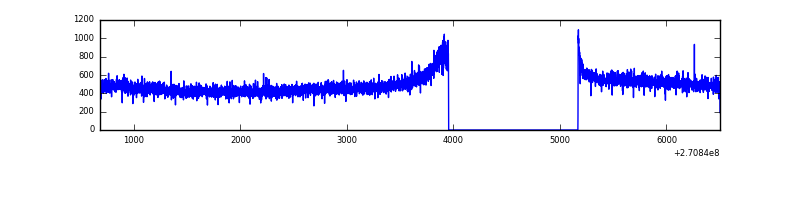 |
| D | 5822 | 4607 | 170 | 170 | 2.92% | 3.69% | 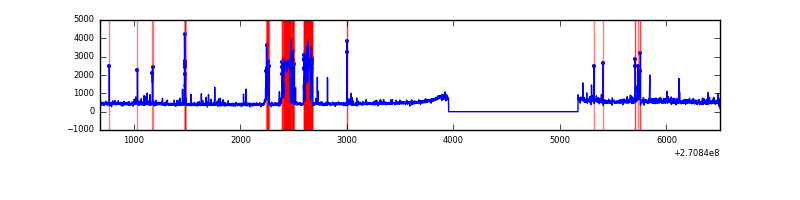 |
Top three noisy pixels from each quadrant. If the there are fewer than three noisy pixels in the level2.evt file, extra rows are filled as -1
| Pixel properties | Quadrant properties | ||||||
|---|---|---|---|---|---|---|---|
| Quadrant | DetID | PixID | Counts | Sigma | Mean | Median | Sigma |
| A | 14 | 238 | 160925 | 1416.95 | 556 | 543 | 113.2 |
| A | 14 | 237 | 110690 | 973.13 | 556 | 543 | 113.2 |
| A | 15 | 239 | 25298 | 218.71 | 556 | 543 | 113.2 |
| B | 4 | 142 | 75482 | 701.63 | 559 | 545 | 106.8 |
| B | 4 | 173 | 73990 | 687.66 | 559 | 545 | 106.8 |
| B | 8 | 3 | 42054 | 388.65 | 559 | 545 | 106.8 |
| C | 3 | 233 | 107385 | 850.18 | 546 | 548 | 125.7 |
| C | 13 | 61 | 3948 | 27.06 | 546 | 548 | 125.7 |
| C | 7 | 247 | 1395 | 6.74 | 546 | 548 | 125.7 |
| D | 2 | 33 | 452396 | 3436.82 | 538 | 522 | 131.5 |
| D | 5 | 222 | 77408 | 584.77 | 538 | 522 | 131.5 |
| D | 7 | 38 | 54239 | 408.55 | 538 | 522 | 131.5 |
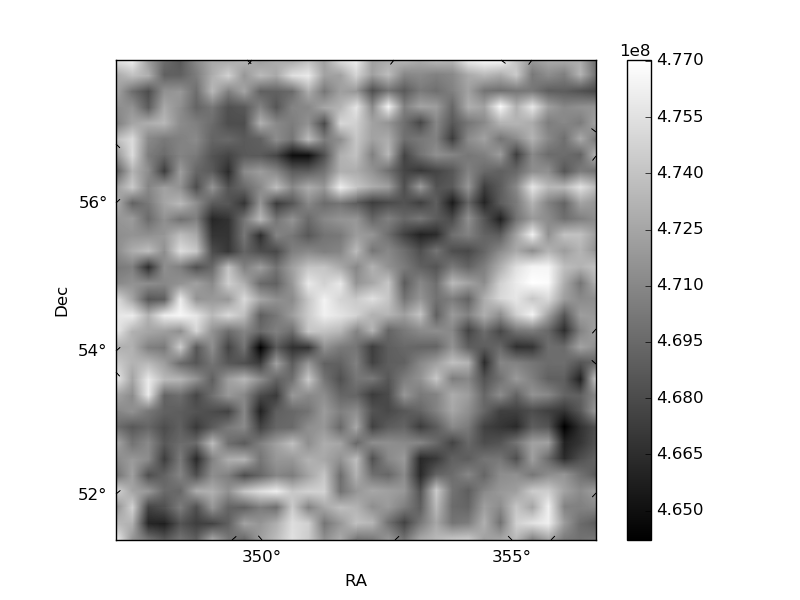
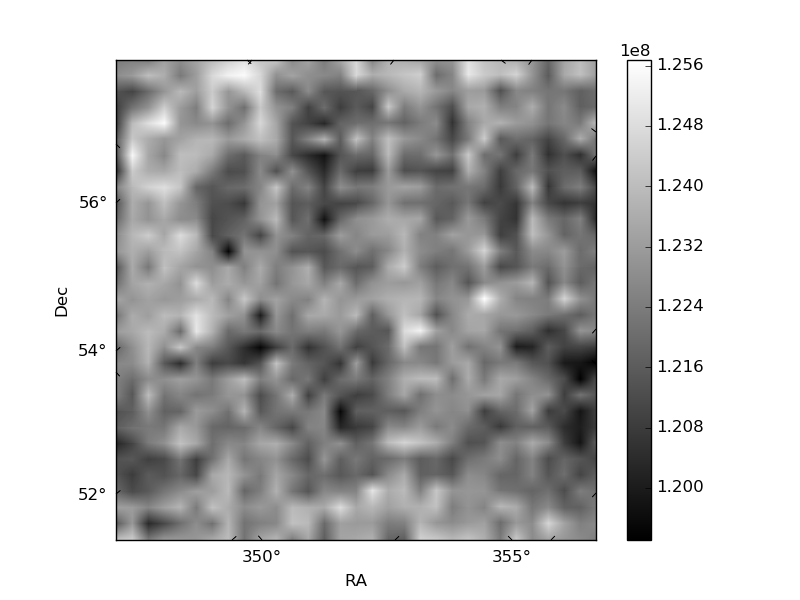
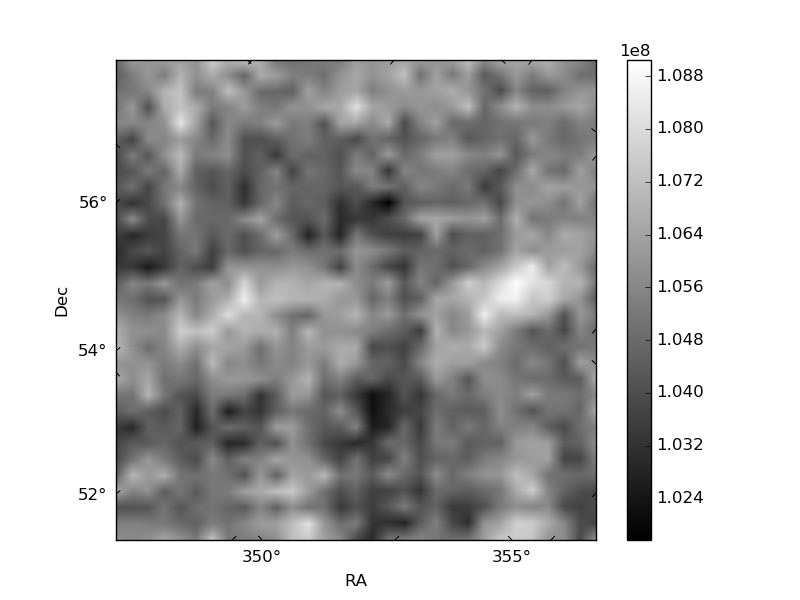
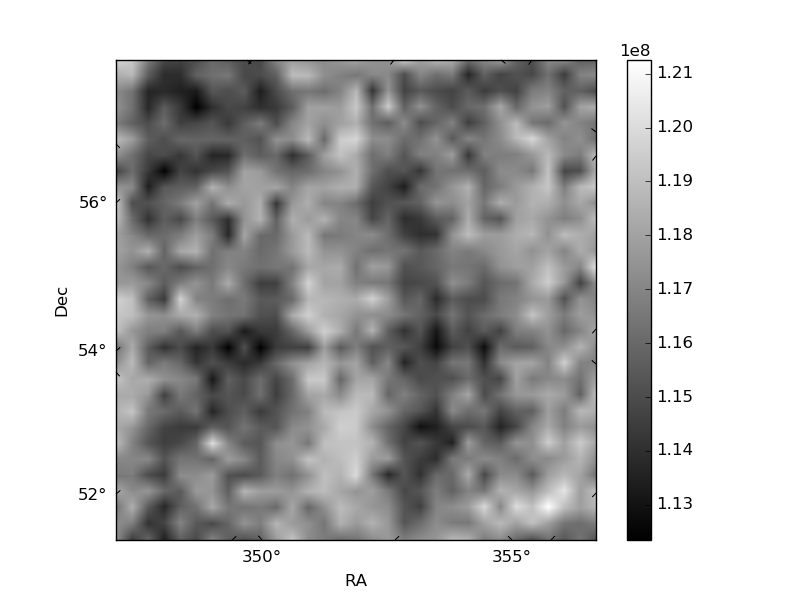
Histogram calculated using DETX and DETY for each event in the final _common_clean file
| Quadrant A | 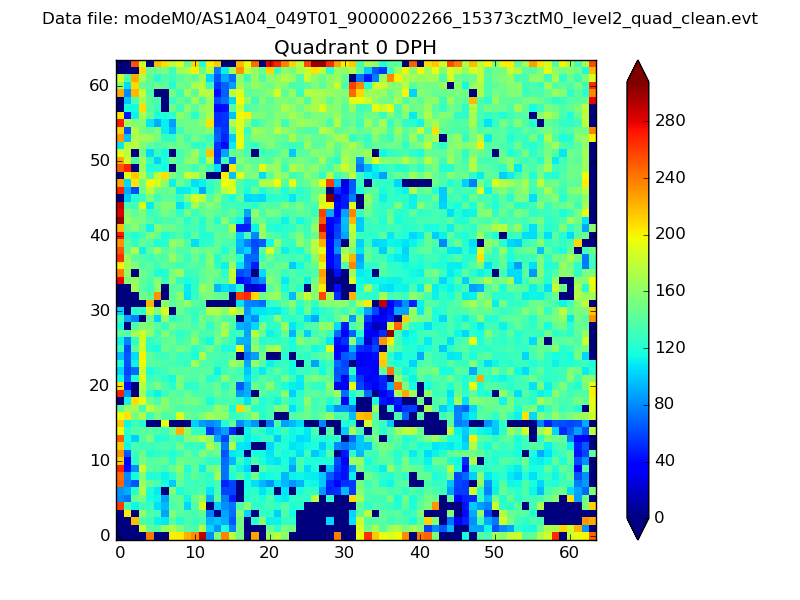 |
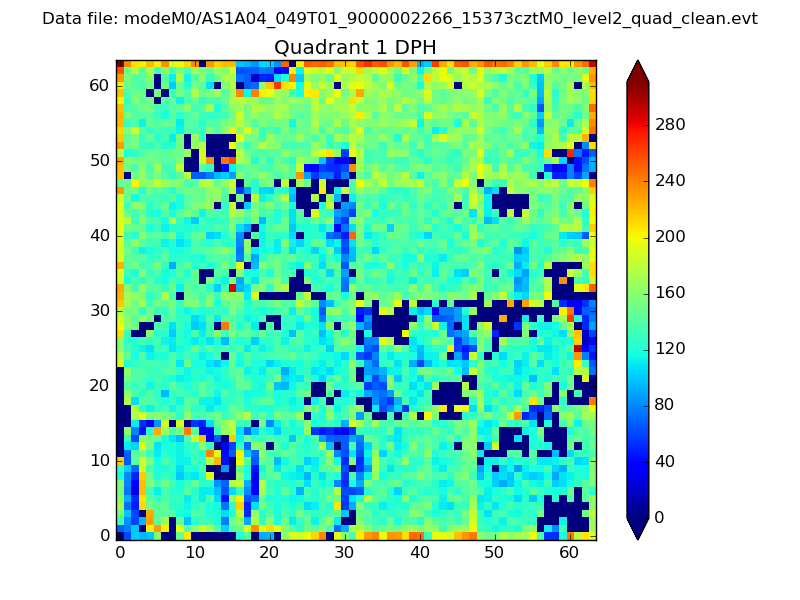 |
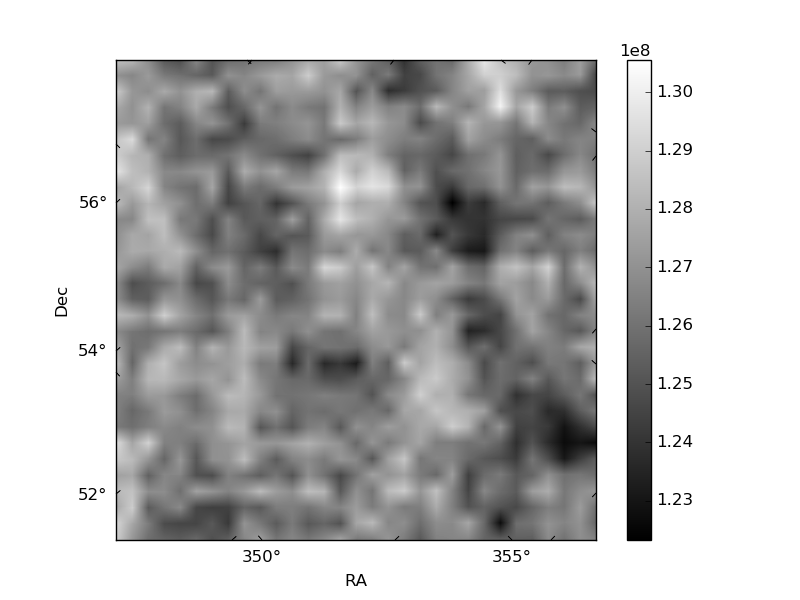
Quadrant B |
|---|---|---|---|
| Quadrant D | 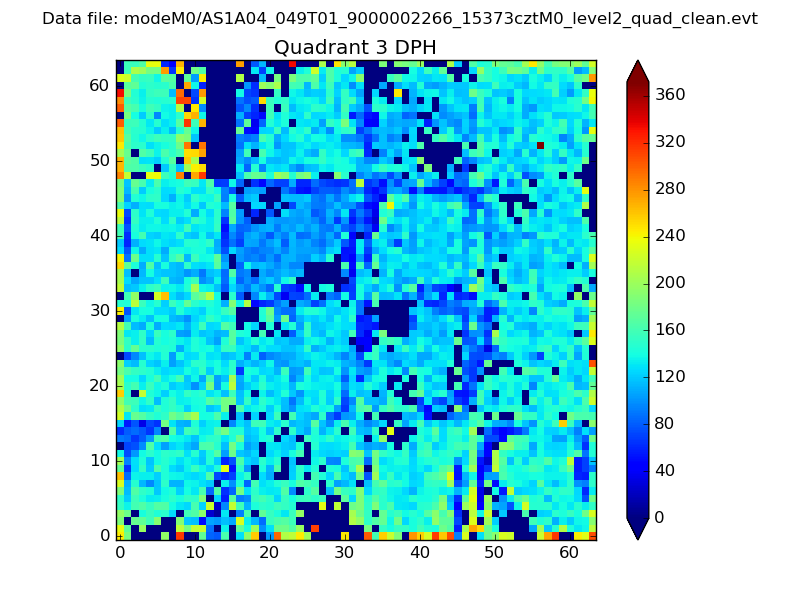 |
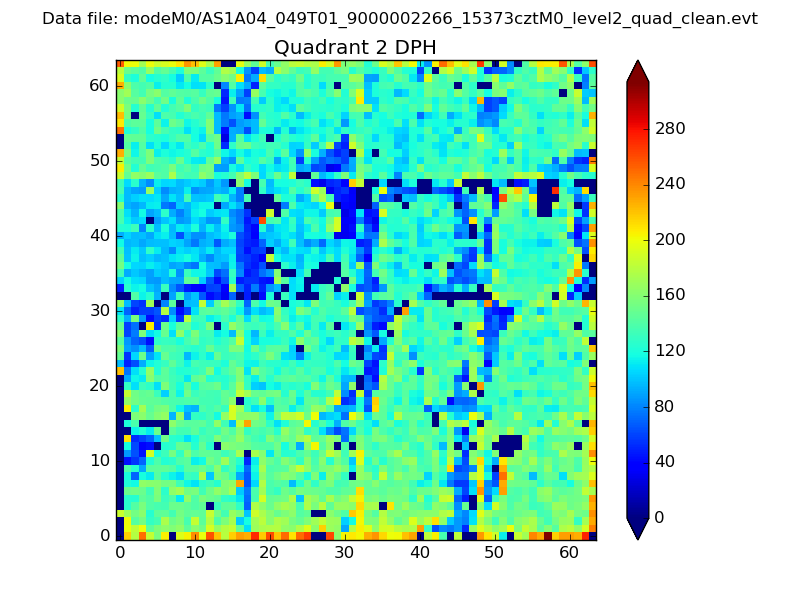 |
Quadrant C |
| Plot type | Count rate plots | Images |
|---|---|---|
| Comparison with Poisson distribution Blue bars denote a histogram of data divided into 1 sec bins. Red curve is a Poisson curve with rate = median count rate of data. |
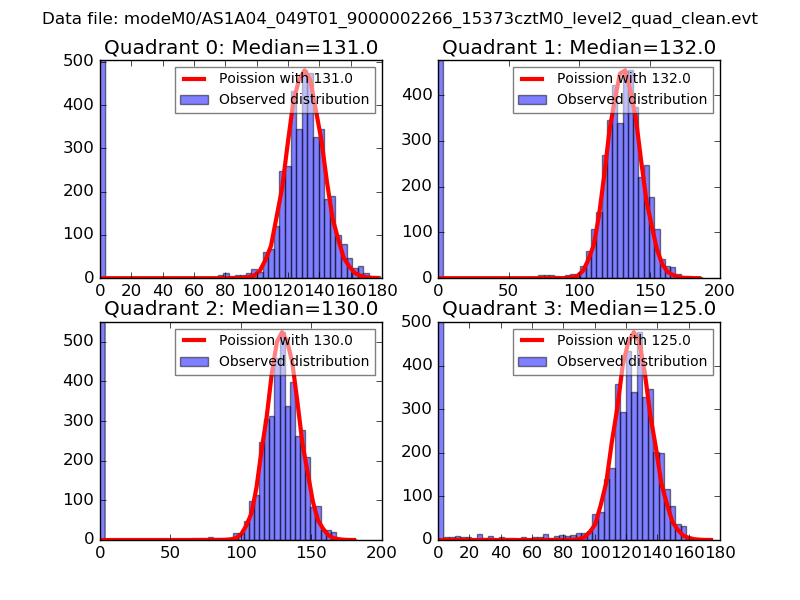 |
 |
| Quadrant-wise count rates Data is divided into 100 sec bins |
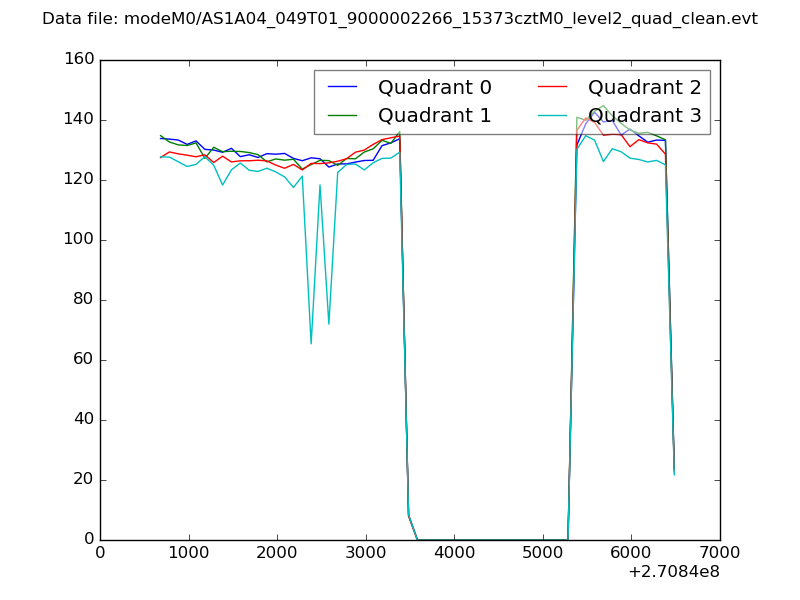 |
|
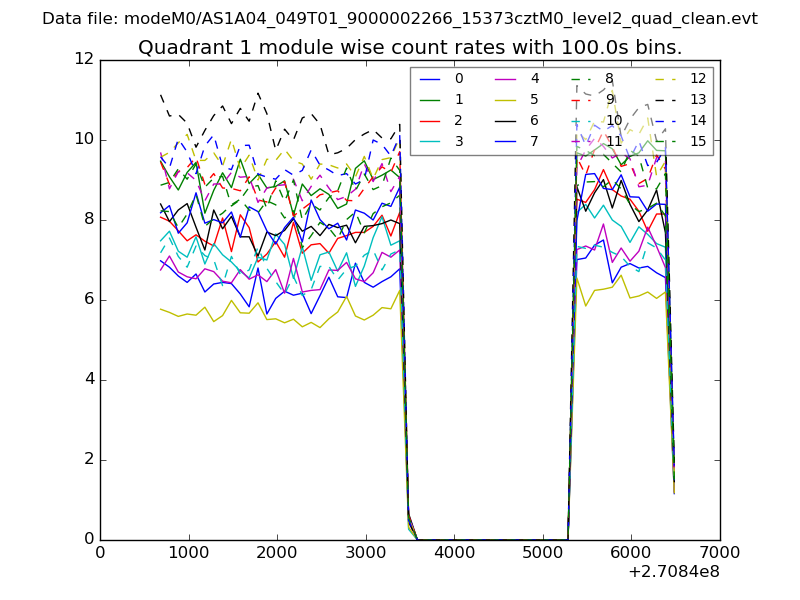
| Module-wise count rates for Quadrant A Data is divided into 100 sec bins |
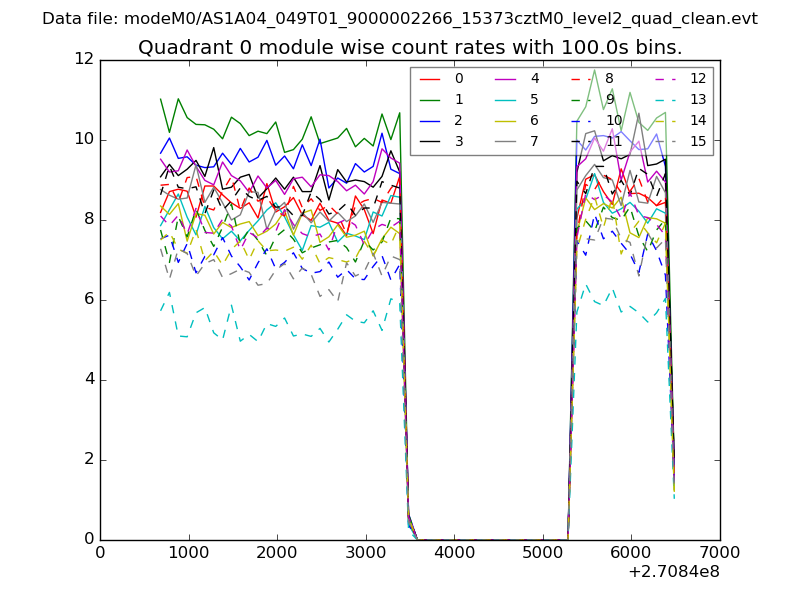 |
 |
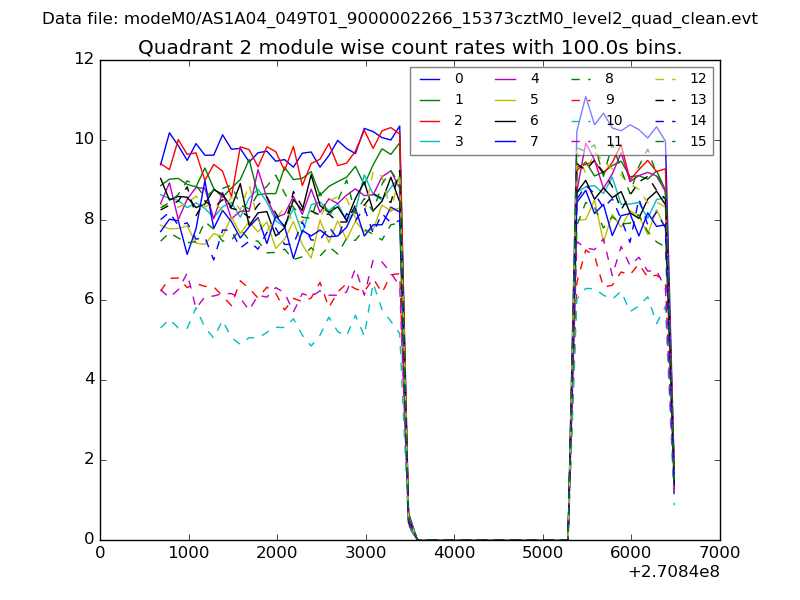
| Module-wise count rates for Quadrant B Data is divided into 100 sec bins |
 |
 |
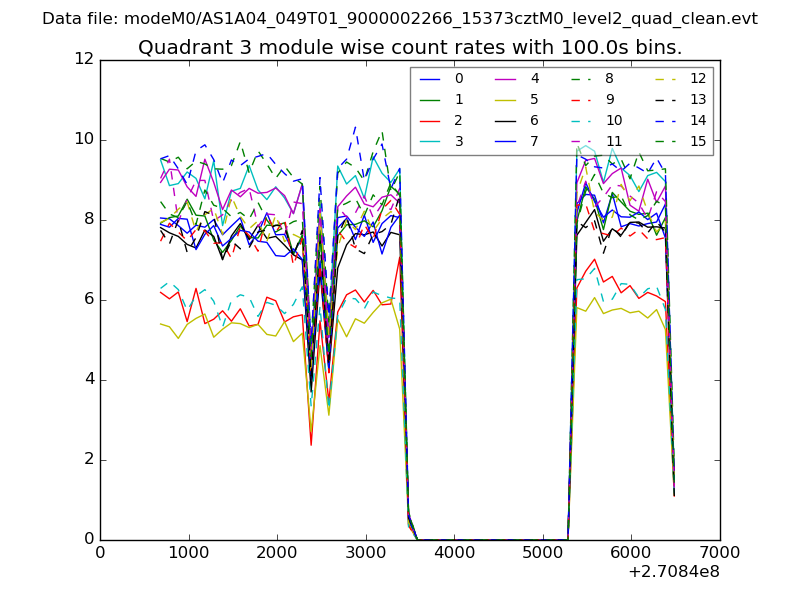
| Module-wise count rates for Quadrant C Data is divided into 100 sec bins |
 |
 |
| Module-wise count rates for Quadrant D Data is divided into 100 sec bins |
 |
 |
| Parameter | Plot |
|---|---|
| CZT HV Monitor | 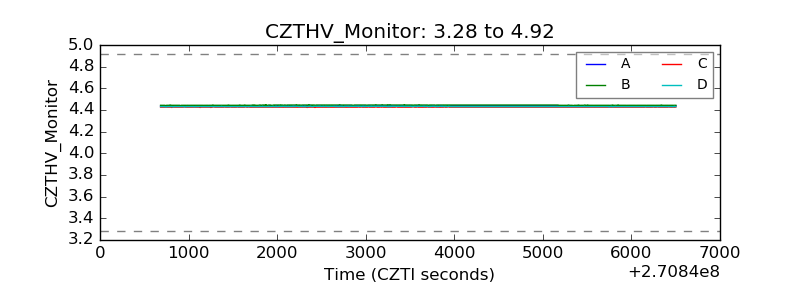 |
| D_VDD | 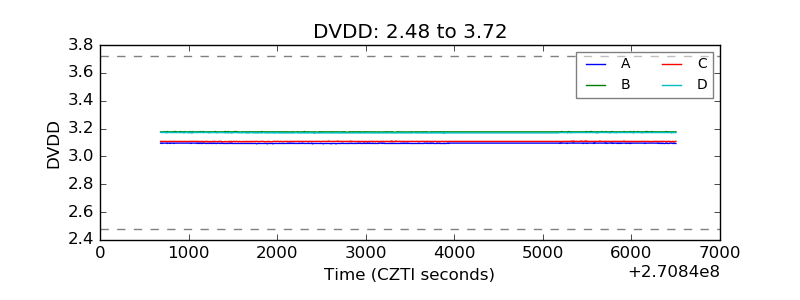 |
| Temperature 1 | 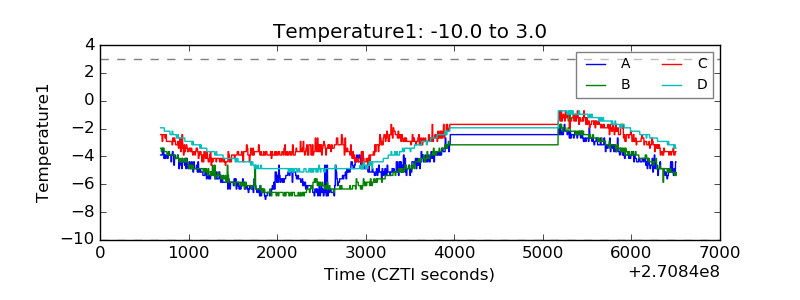 |
| Veto HV Monitor | 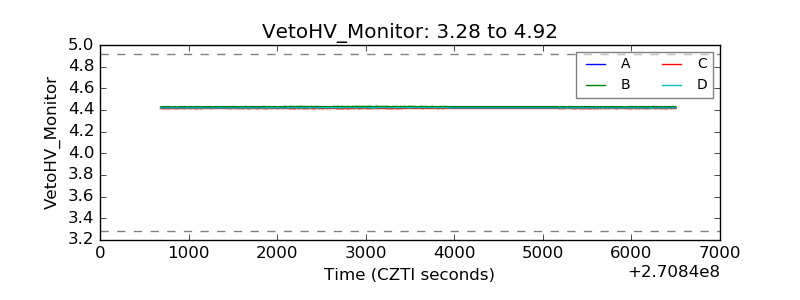 |
| Veto LLD | 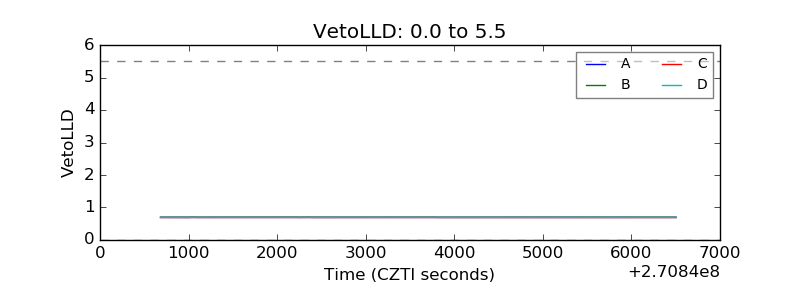 |
| Alpha Counter | 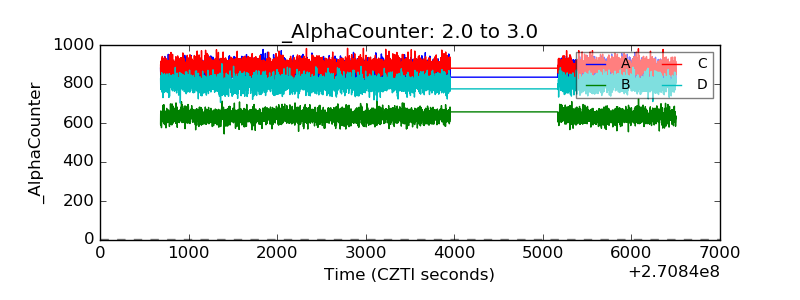 |
| _CPM_Rate | 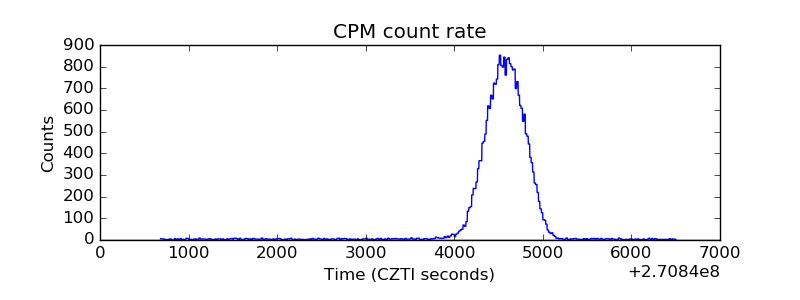 |
| CZT Counter |  |
| +2.5 Volts monitor |  |
| +5 Volts monitor | 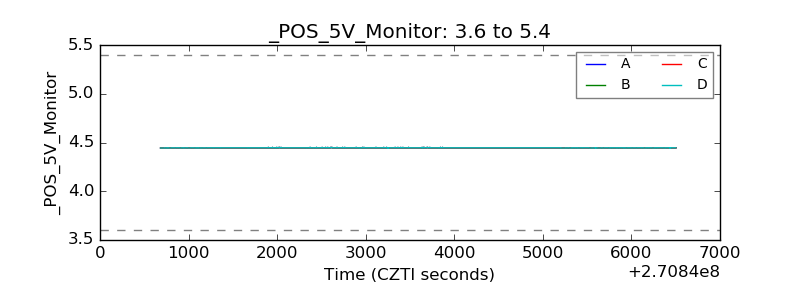 |
| _ROLL_ROT |  |
| _Roll_DEC | 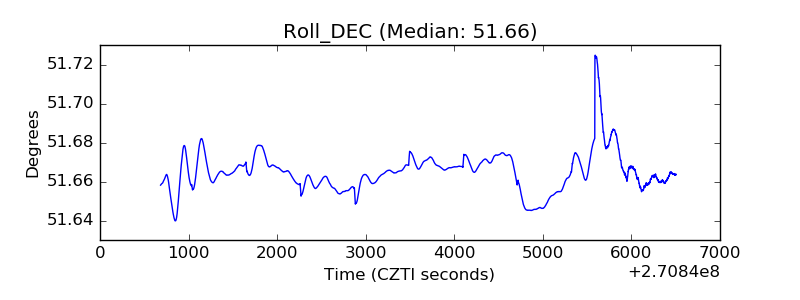 |
| _Roll_RA | 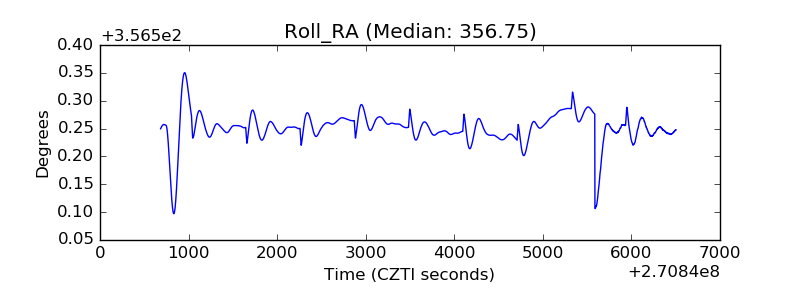 |
| Veto Counter | 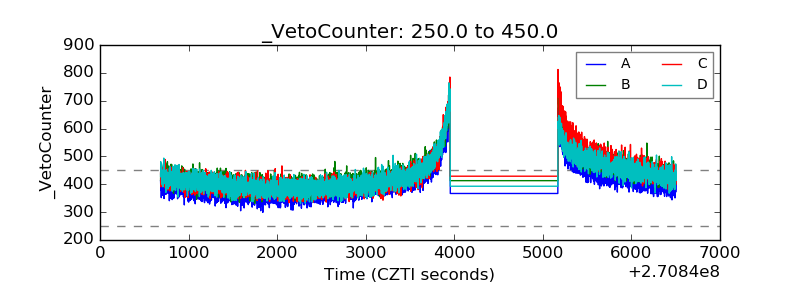 |