| Param | Original file | Final file |
|---|---|---|
| Filename | modeM0/AS1A04_049T01_9000002266_15374cztM0_level2.evt | modeM0/AS1A04_049T01_9000002266_15374cztM0_level2_quad_clean.evt |
| Size (bytes) | 511,447,680 | 102,323,520 |
| Size | 487.8 MB | 97.6 MB |
| Events in quadrant A | 3,381,084 | 667,251 |
| Events in quadrant B | 3,347,484 | 676,056 |
| Events in quadrant C | 5,063,125 | 658,905 |
| Events in quadrant D | 3,253,911 | 640,540 |
| Mode SS | |||
|---|---|---|---|
| Quadrant | BADHDUFLAG | Total packets | Discarded packets |
| A | 0 | 132 | 0 |
| B | 0 | 132 | 0 |
| C | 0 | 132 | 0 |
| D | 0 | 132 | 0 |
| Mode M0 | |||
|---|---|---|---|
| Quadrant | BADHDUFLAG | Total packets | Discarded packets |
| A | 0 | 14502 | 3 |
| B | 0 | 14319 | 2 |
| C | 0 | 19443 | 2 |
| D | 0 | 14322 | 2 |
| Mode M9 | |||
|---|---|---|---|
| Quadrant | BADHDUFLAG | Total packets | Discarded packets |
| A | 0 | 20 | 0 |
| B | 0 | 20 | 0 |
| C | 0 | 20 | 0 |
| D | 0 | 21 | 0 |
| Quadrant | Total seconds | Saturated seconds | Saturation percentage |
|---|---|---|---|
| A | 6544 | 99 | 1.512836% |
| B | 6544 | 54 | 0.825183% |
| C | 6544 | 173 | 2.643643% |
| D | 6544 | 39 | 0.595966% |
Noise dominated data is calculated using 1-second bins in cleaned event files. If a bin has >2000 counts, and if more than 50% of those come from <1% of pixels, then it is considered to be noise-dominated and hence unusable.
| Quadrant | # 1 sec bins | Bins with >0 counts | Bins with >2000 counts | High rate bins dominated by noise | Noise dominated (total time) | Noise dominated (detector-on time) | Marked lightcurve |
|---|---|---|---|---|---|---|---|
| A | 7500 | 6546 | 44 | 44 | 0.59% | 0.67% | 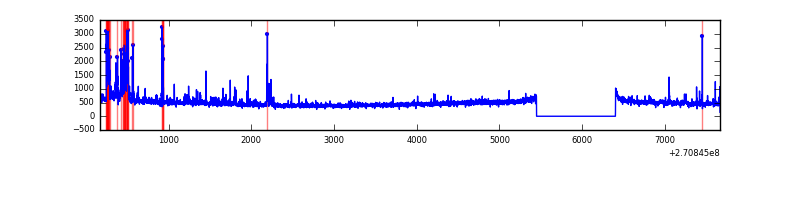 |
| B | 7500 | 6546 | 15 | 15 | 0.20% | 0.23% | 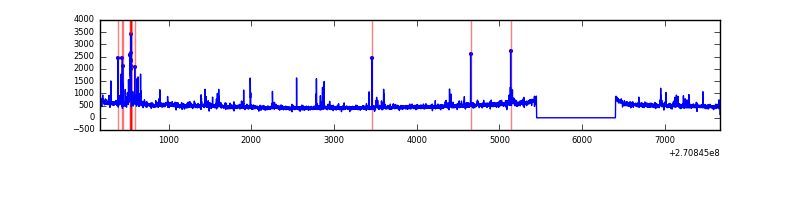 |
| C | 7500 | 6546 | 36 | 36 | 0.48% | 0.55% | 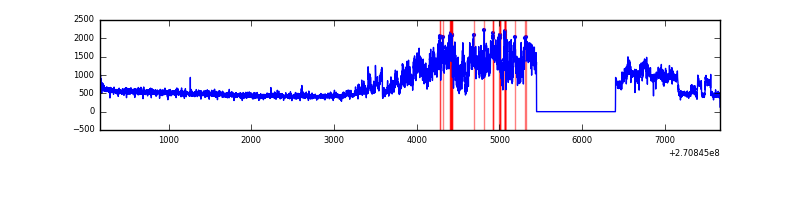 |
| D | 7500 | 6546 | 19 | 19 | 0.25% | 0.29% | 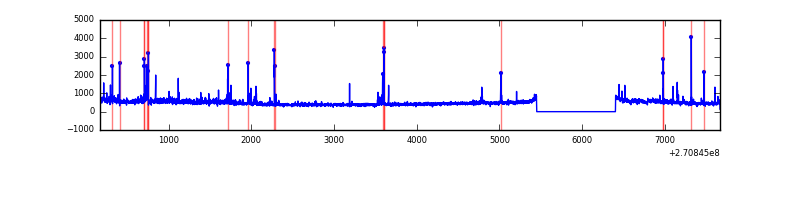 |
Top three noisy pixels from each quadrant. If the there are fewer than three noisy pixels in the level2.evt file, extra rows are filled as -1
| Pixel properties | Quadrant properties | ||||||
|---|---|---|---|---|---|---|---|
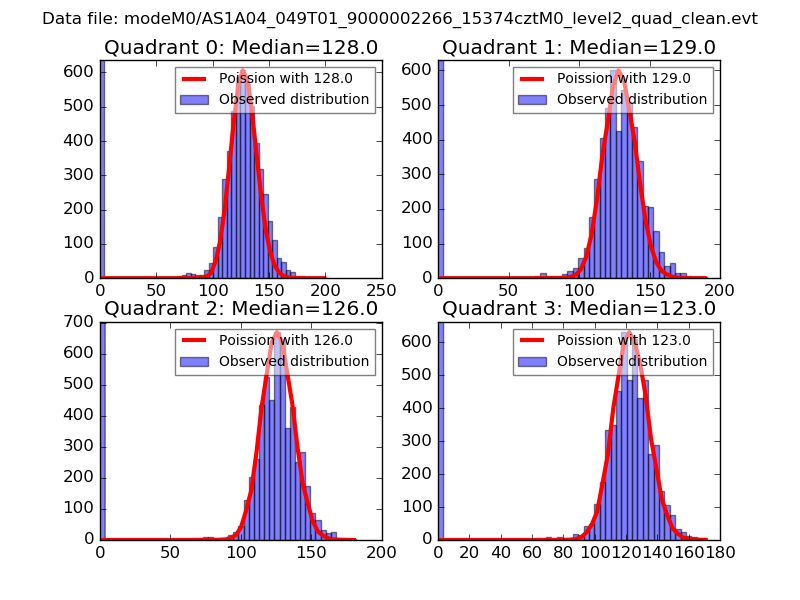
| Quadrant | DetID | PixID | Counts | Sigma | Mean | Median | Sigma |
| A | 14 | 238 | 207581 | 1312.48 | 780 | 763 | 157.6 |
| A | 14 | 237 | 133082 | 839.7 | 780 | 763 | 157.6 |
| A | 15 | 239 | 17239 | 104.56 | 780 | 763 | 157.6 |
| B | 4 | 142 | 75475 | 507.82 | 785 | 766 | 147.1 |
| B | 8 | 3 | 54865 | 367.73 | 785 | 766 | 147.1 |
| B | 4 | 173 | 39224 | 261.41 | 785 | 766 | 147.1 |
| C | 3 | 233 | 2096066 | 12113.02 | 760 | 764 | 173.0 |
| C | 13 | 61 | 5348 | 26.5 | 760 | 764 | 173.0 |
| C | 4 | 112 | 3031 | 13.11 | 760 | 764 | 173.0 |
| D | 5 | 222 | 110989 | 587.37 | 766 | 744 | 187.7 |
| D | 6 | 112 | 39110 | 204.41 | 766 | 744 | 187.7 |
| D | 7 | 38 | 37803 | 197.44 | 766 | 744 | 187.7 |
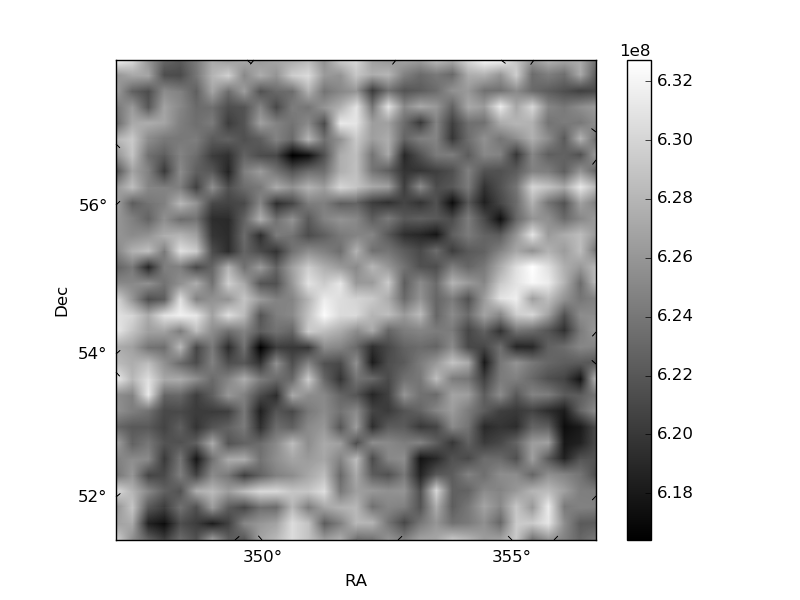
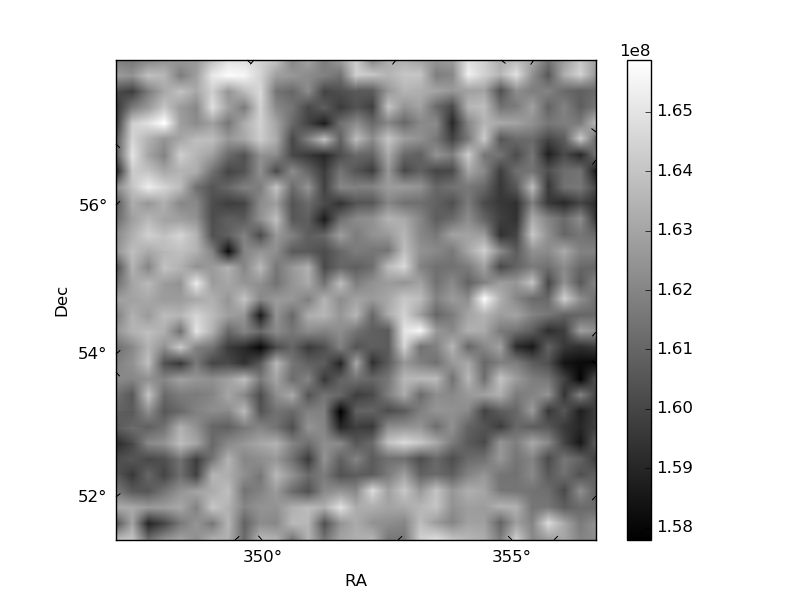
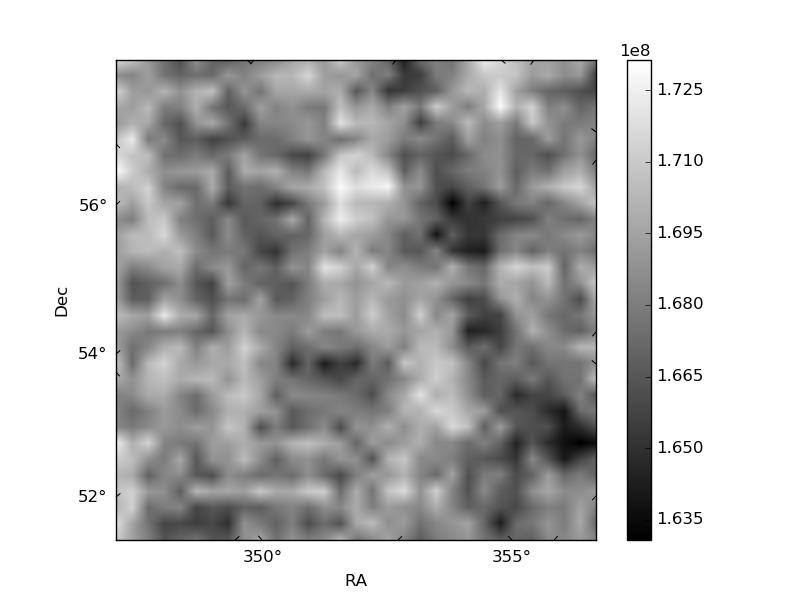
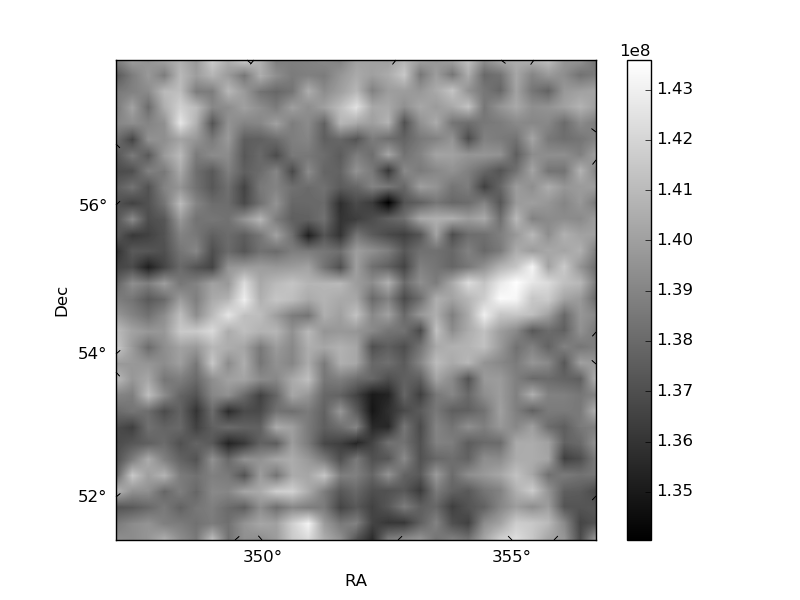
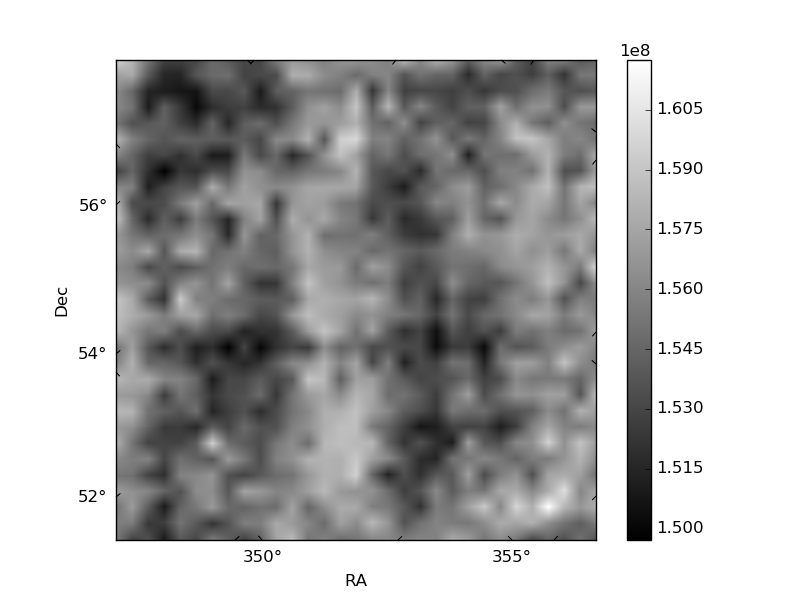
Histogram calculated using DETX and DETY for each event in the final _common_clean file
| Quadrant A | 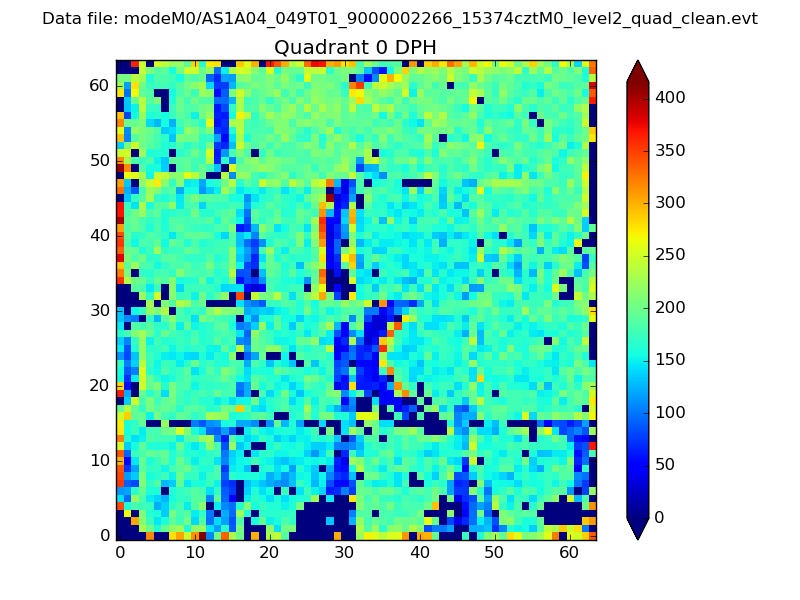 |
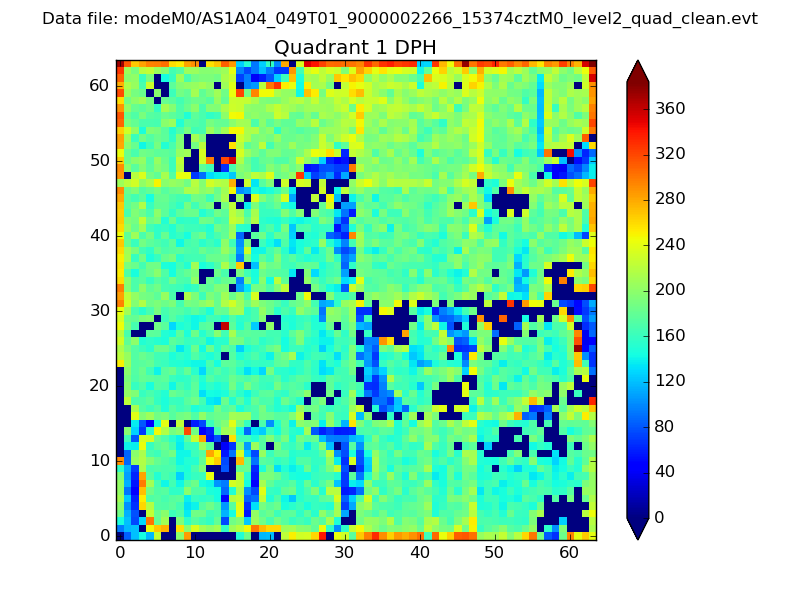 |
Quadrant B |
|---|---|---|---|
| Quadrant D | 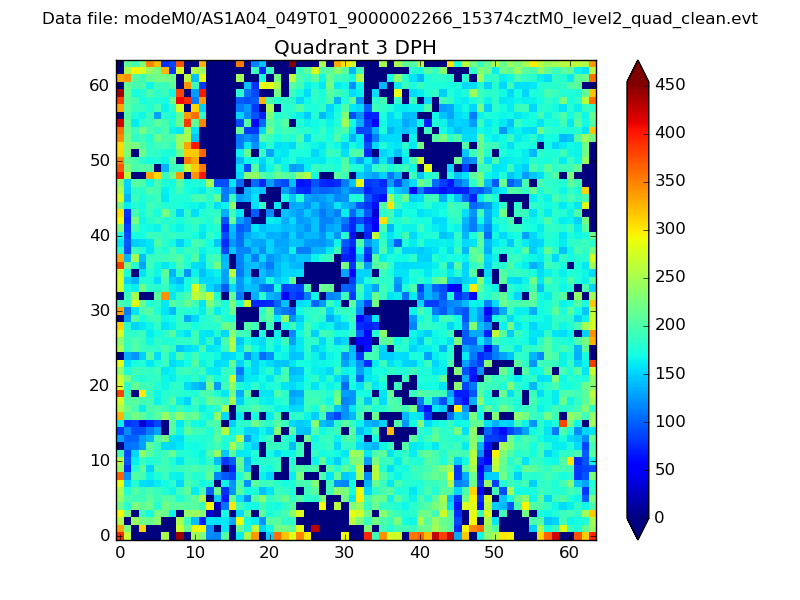 |
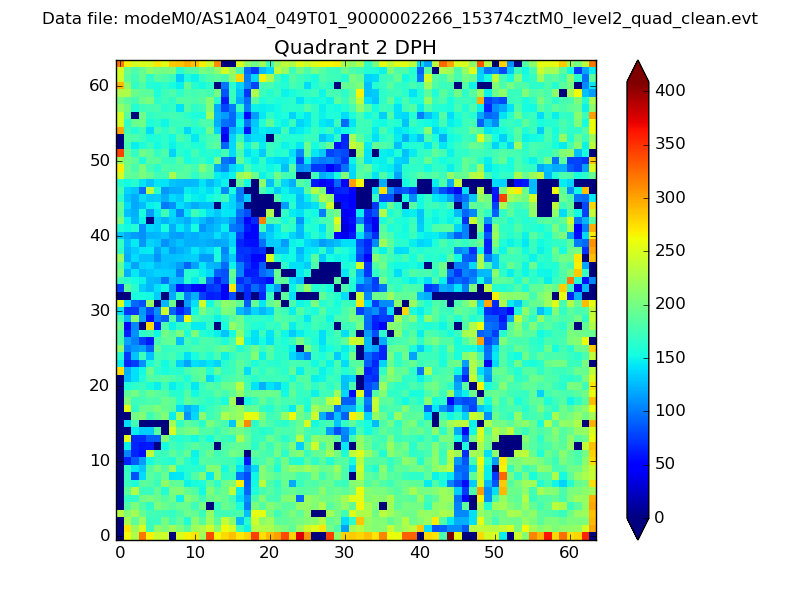 |
Quadrant C |
| Plot type | Count rate plots | Images |
|---|---|---|
| Comparison with Poisson distribution Blue bars denote a histogram of data divided into 1 sec bins. Red curve is a Poisson curve with rate = median count rate of data. |
 |
 |
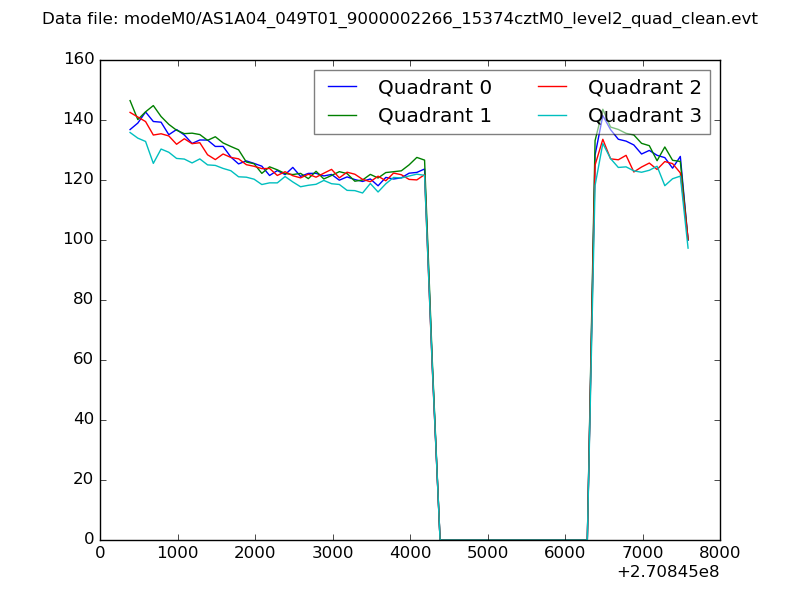
| Quadrant-wise count rates Data is divided into 100 sec bins |
 |
|
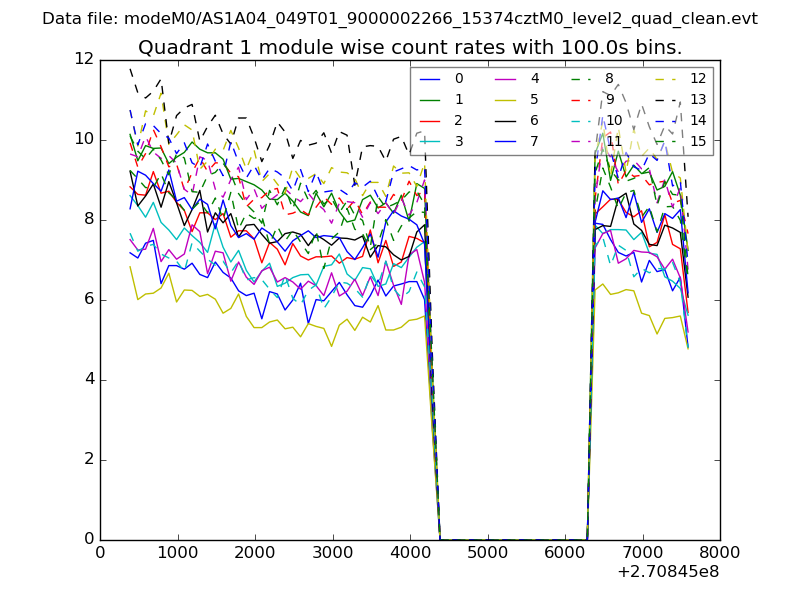
| Module-wise count rates for Quadrant A Data is divided into 100 sec bins |
 |
 |
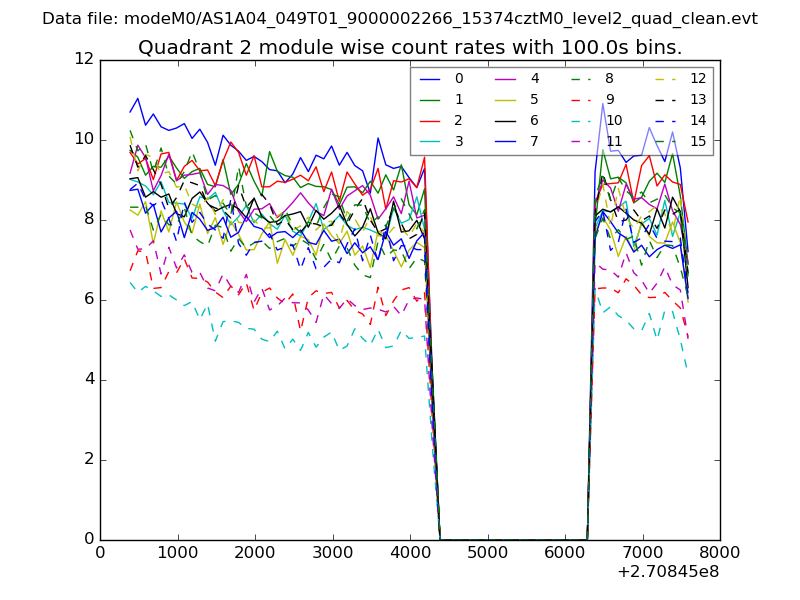
| Module-wise count rates for Quadrant B Data is divided into 100 sec bins |
 |
 |
| Module-wise count rates for Quadrant C Data is divided into 100 sec bins |
 |
 |
| Module-wise count rates for Quadrant D Data is divided into 100 sec bins |
 |
 |
| Parameter | Plot |
|---|---|
| CZT HV Monitor |  |
| D_VDD | 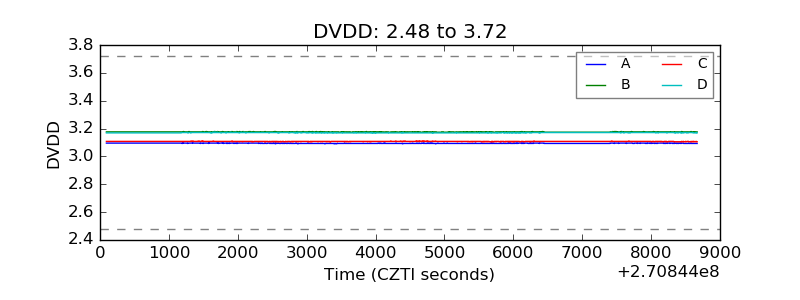 |
| Temperature 1 | 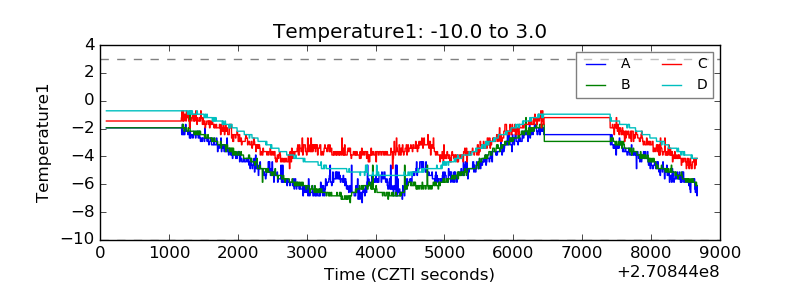 |
| Veto HV Monitor | 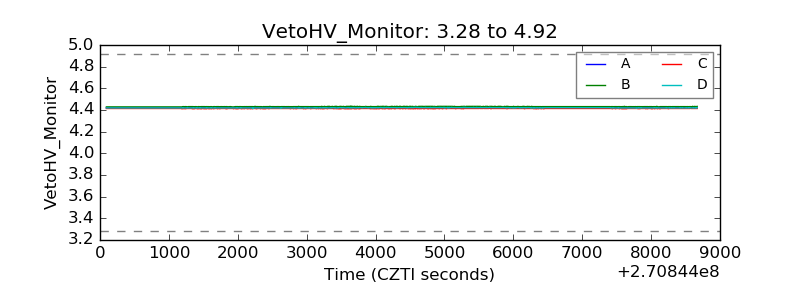 |
| Veto LLD | 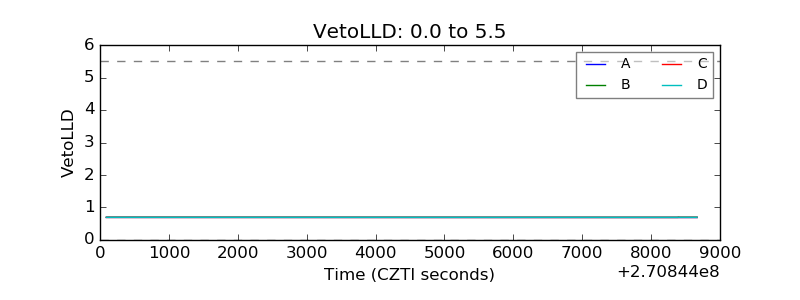 |
| Alpha Counter | 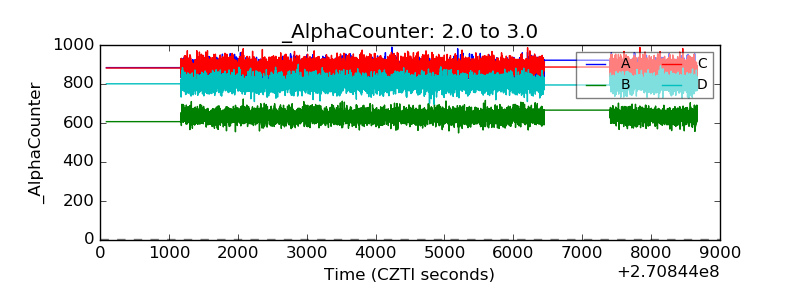 |
| _CPM_Rate | 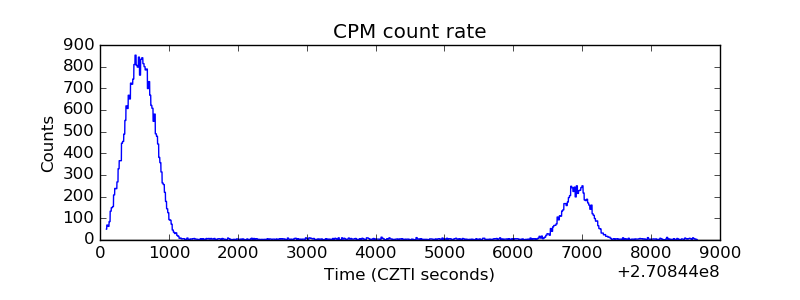 |
| CZT Counter | 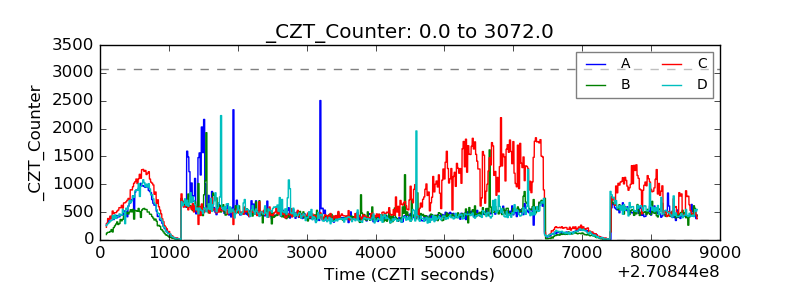 |
| +2.5 Volts monitor | 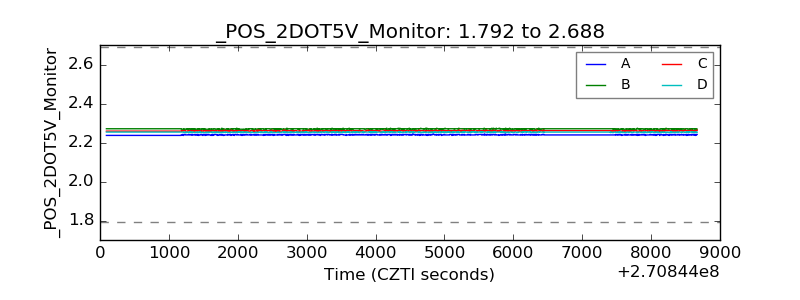 |
| +5 Volts monitor |  |
| _ROLL_ROT | 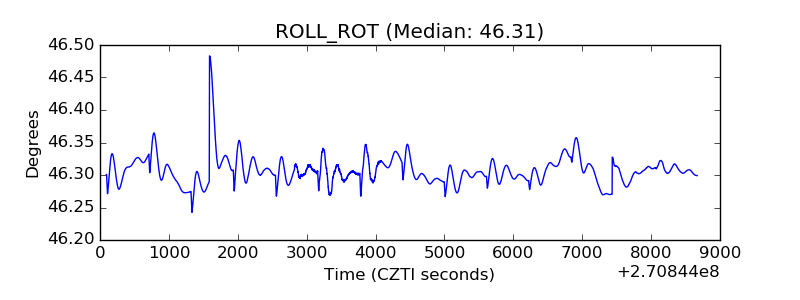 |
| _Roll_DEC | 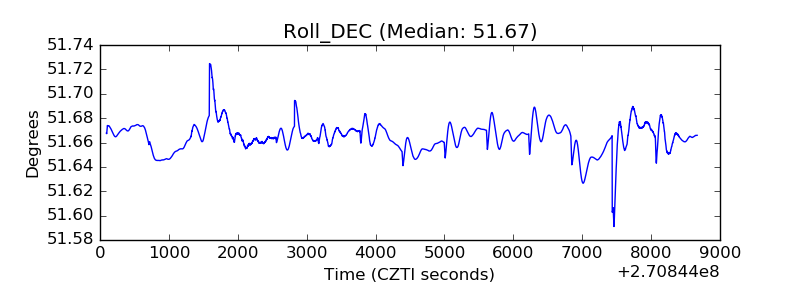 |
| _Roll_RA | 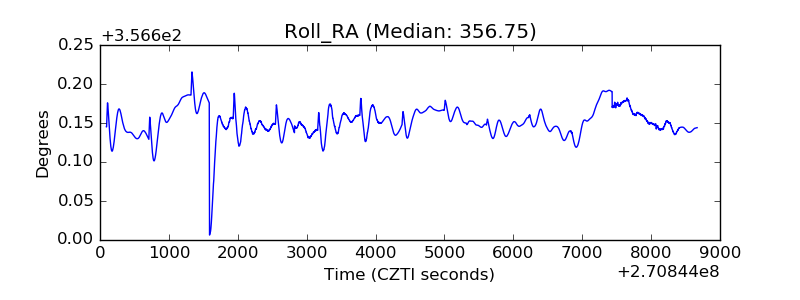 |
| Veto Counter | 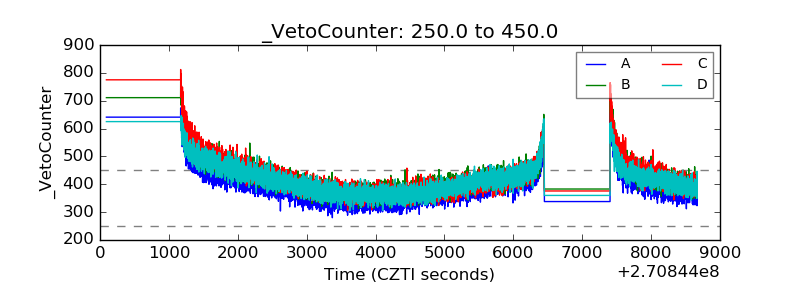 |