| Param | Original file | Final file |
|---|---|---|
| Filename | modeM0/AS1A04_049T01_9000002266_15375cztM0_level2.evt | modeM0/AS1A04_049T01_9000002266_15375cztM0_level2_quad_clean.evt |
| Size (bytes) | 567,267,840 | 98,081,280 |
| Size | 541.0 MB | 93.5 MB |
| Events in quadrant A | 3,291,300 | 629,962 |
| Events in quadrant B | 3,505,277 | 637,073 |
| Events in quadrant C | 6,410,076 | 611,895 |
| Events in quadrant D | 3,501,924 | 606,680 |
| Mode SS | |||
|---|---|---|---|
| Quadrant | BADHDUFLAG | Total packets | Discarded packets |
| A | 0 | 140 | 0 |
| B | 0 | 140 | 0 |
| C | 0 | 140 | 0 |
| D | 0 | 140 | 0 |
| Mode M0 | |||
|---|---|---|---|
| Quadrant | BADHDUFLAG | Total packets | Discarded packets |
| A | 0 | 14639 | 3 |
| B | 0 | 15042 | 2 |
| C | 0 | 23910 | 2 |
| D | 0 | 15478 | 2 |
| Mode M9 | |||
|---|---|---|---|
| Quadrant | BADHDUFLAG | Total packets | Discarded packets |
| A | 0 | 8 | 0 |
| B | 0 | 8 | 0 |
| C | 0 | 8 | 0 |
| D | 0 | 9 | 0 |
| Quadrant | Total seconds | Saturated seconds | Saturation percentage |
|---|---|---|---|
| A | 6963 | 28 | 0.402126% |
| B | 6963 | 45 | 0.646273% |
| C | 6963 | 246 | 3.532960% |
| D | 6963 | 52 | 0.746805% |
Noise dominated data is calculated using 1-second bins in cleaned event files. If a bin has >2000 counts, and if more than 50% of those come from <1% of pixels, then it is considered to be noise-dominated and hence unusable.
| Quadrant | # 1 sec bins | Bins with >0 counts | Bins with >2000 counts | High rate bins dominated by noise | Noise dominated (total time) | Noise dominated (detector-on time) | Marked lightcurve |
|---|---|---|---|---|---|---|---|
| A | 7569 | 6965 | 3 | 3 | 0.04% | 0.04% | 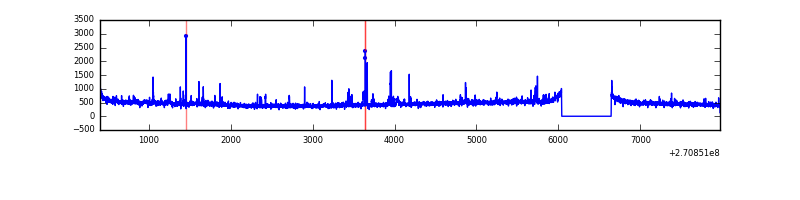 |
| B | 7569 | 6965 | 5 | 5 | 0.07% | 0.07% | 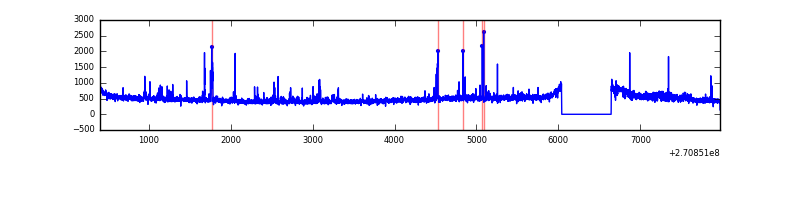 |
| C | 7569 | 6964 | 77 | 77 | 1.02% | 1.11% | 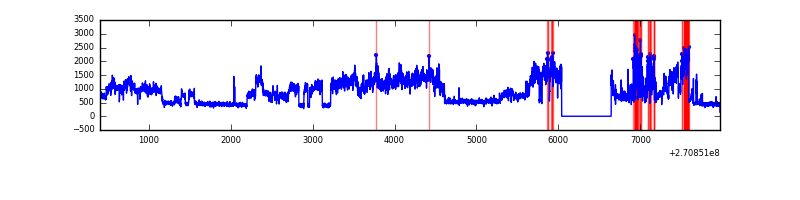 |
| D | 7569 | 6965 | 33 | 33 | 0.44% | 0.47% | 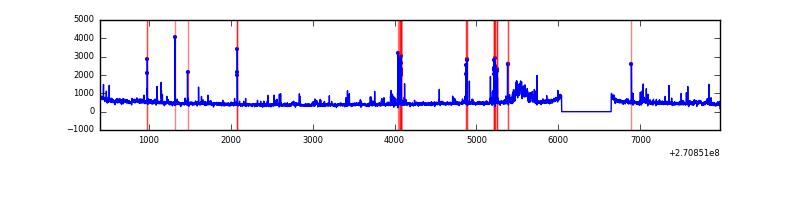 |
Top three noisy pixels from each quadrant. If the there are fewer than three noisy pixels in the level2.evt file, extra rows are filled as -1
| Pixel properties | Quadrant properties | ||||||
|---|---|---|---|---|---|---|---|
| Quadrant | DetID | PixID | Counts | Sigma | Mean | Median | Sigma |
| A | 3 | 80 | 72530 | 430.68 | 819 | 802 | 166.5 |
| A | 9 | 143 | 24588 | 142.82 | 819 | 802 | 166.5 |
| A | 15 | 239 | 24434 | 141.9 | 819 | 802 | 166.5 |
| B | 8 | 3 | 99068 | 628.38 | 822 | 801 | 156.4 |
| B | 4 | 173 | 73184 | 462.86 | 822 | 801 | 156.4 |
| B | 10 | 245 | 47431 | 298.18 | 822 | 801 | 156.4 |
| C | 3 | 233 | 3302896 | 18202.75 | 794 | 798 | 181.4 |
| C | 5 | 96 | 7171 | 35.13 | 794 | 798 | 181.4 |
| C | 13 | 61 | 5539 | 26.13 | 794 | 798 | 181.4 |
| D | 1 | 255 | 136112 | 686.39 | 802 | 776 | 197.2 |
| D | 10 | 70 | 91113 | 458.17 | 802 | 776 | 197.2 |
| D | 2 | 33 | 73803 | 370.38 | 802 | 776 | 197.2 |
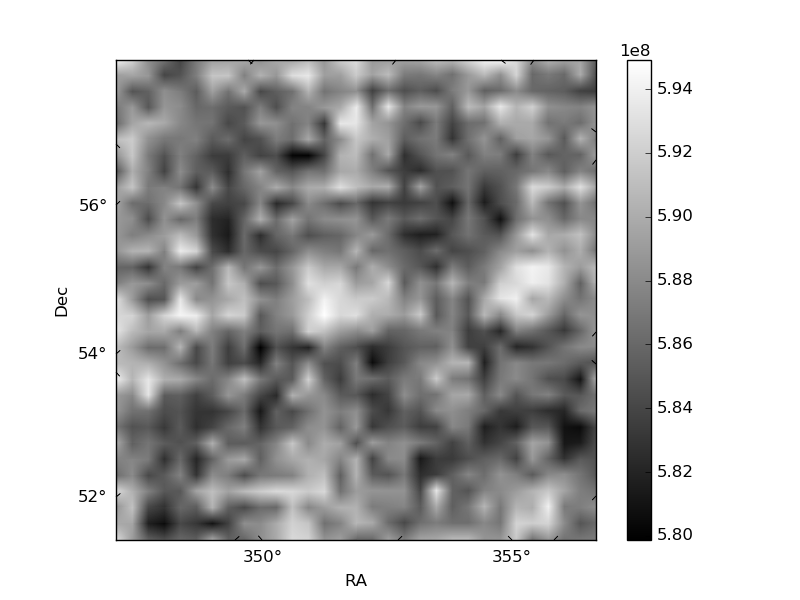
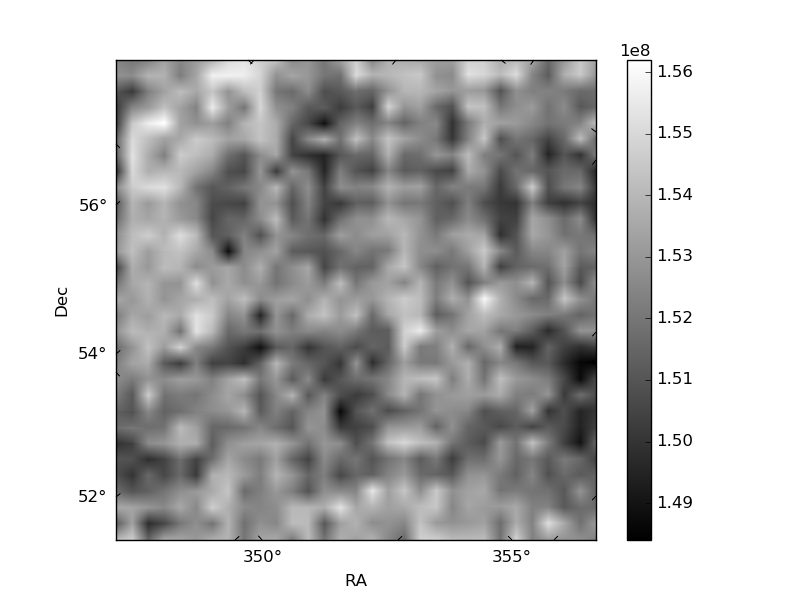
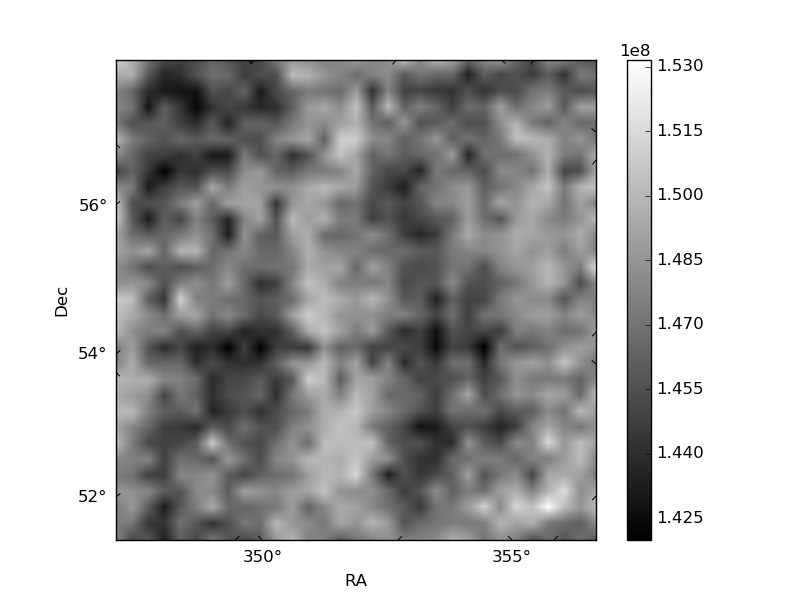
Histogram calculated using DETX and DETY for each event in the final _common_clean file
| Quadrant A | 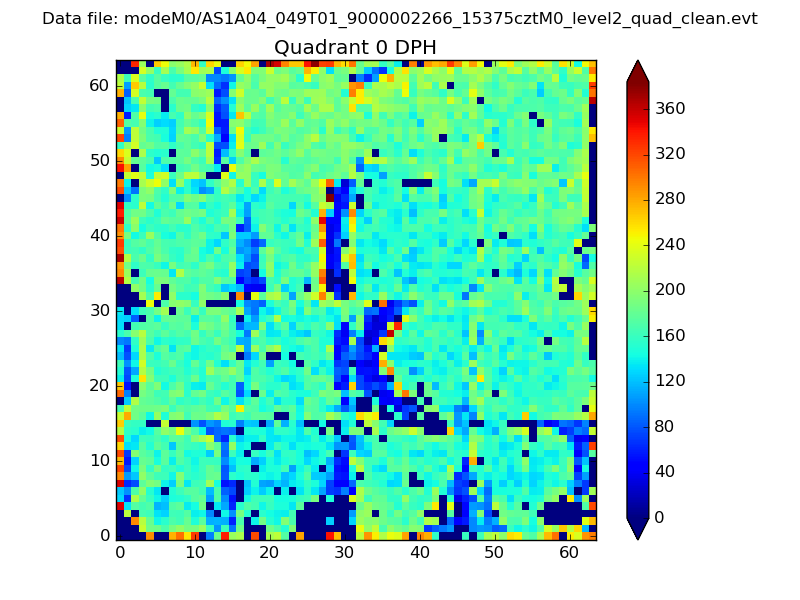 |
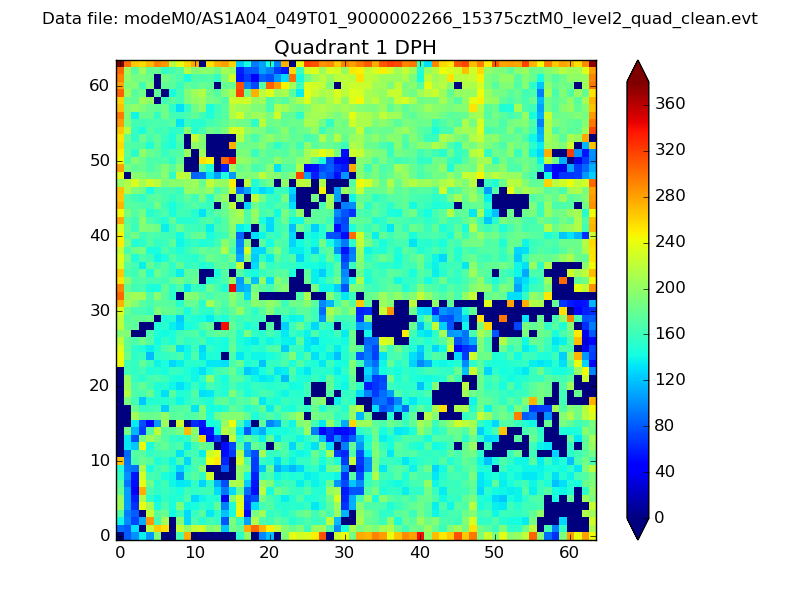 |
Quadrant B |
|---|---|---|---|
| Quadrant D | 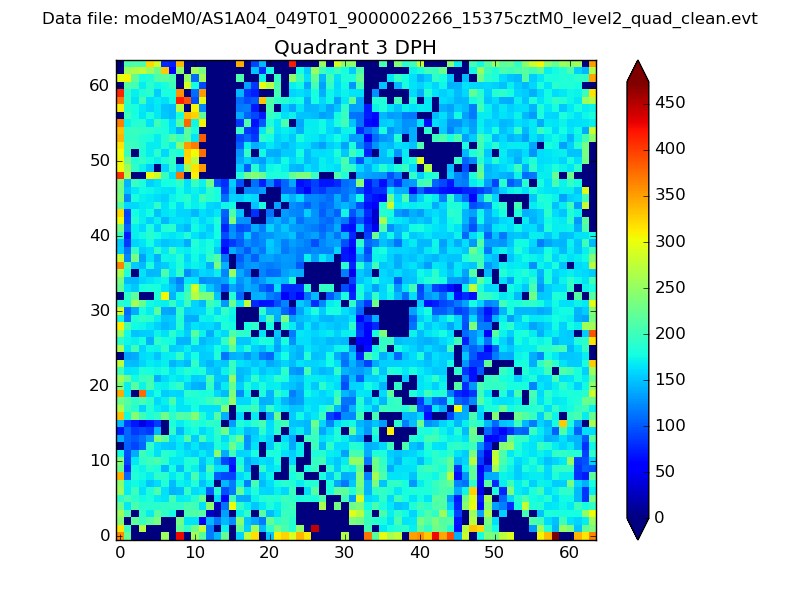 |
 |
Quadrant C |
| Plot type | Count rate plots | Images |
|---|---|---|
| Comparison with Poisson distribution Blue bars denote a histogram of data divided into 1 sec bins. Red curve is a Poisson curve with rate = median count rate of data. |
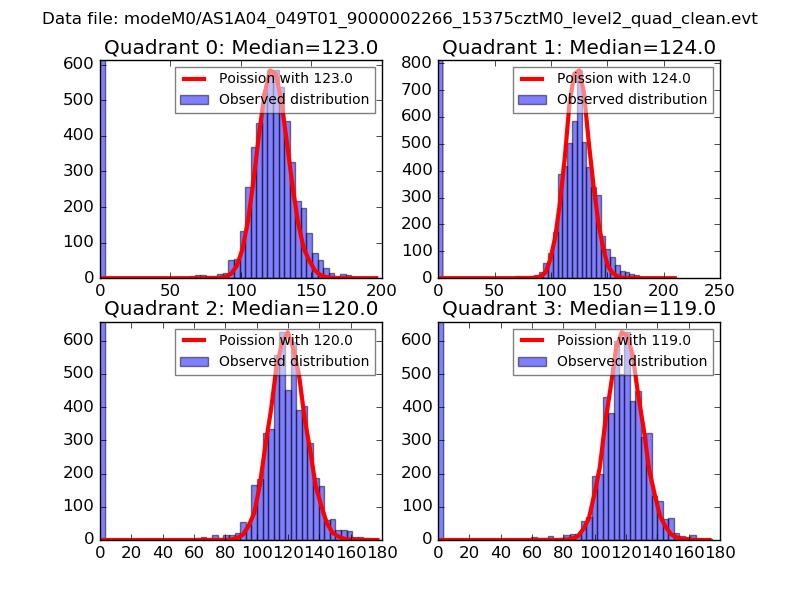 |
 |
| Quadrant-wise count rates Data is divided into 100 sec bins |
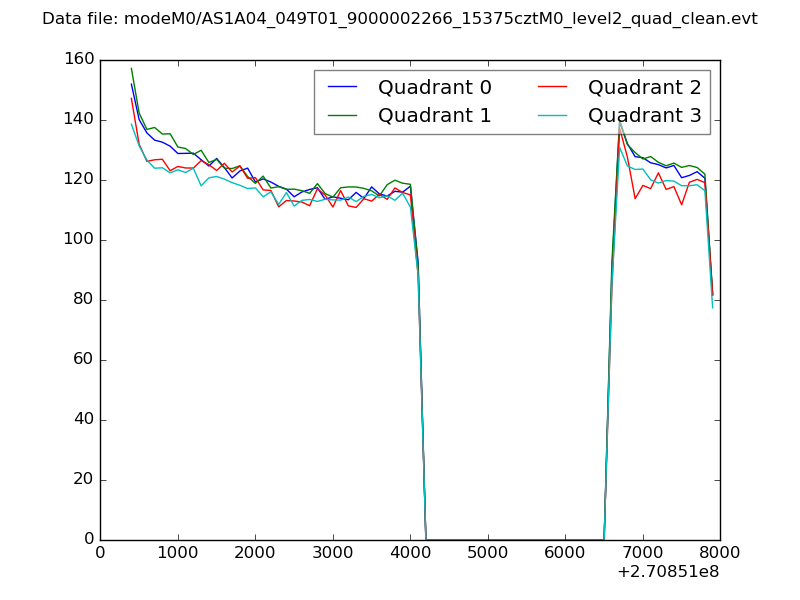 |
|
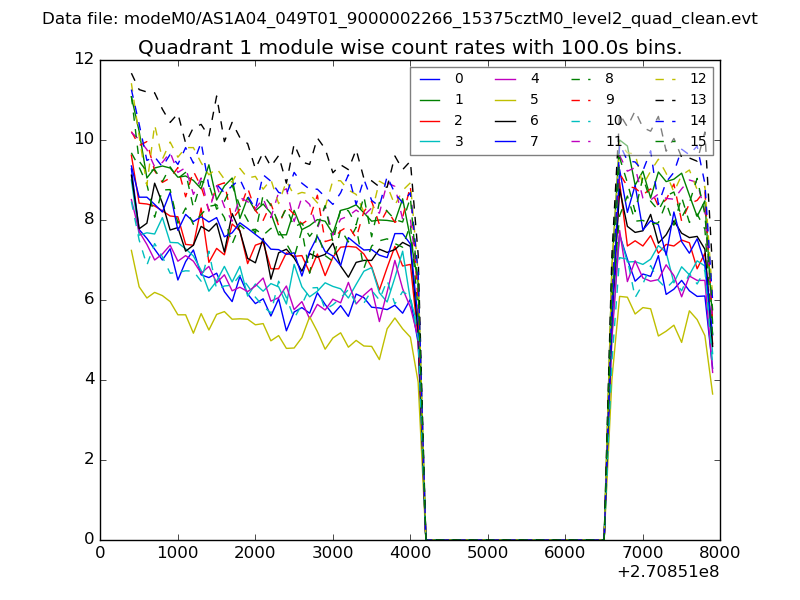
| Module-wise count rates for Quadrant A Data is divided into 100 sec bins |
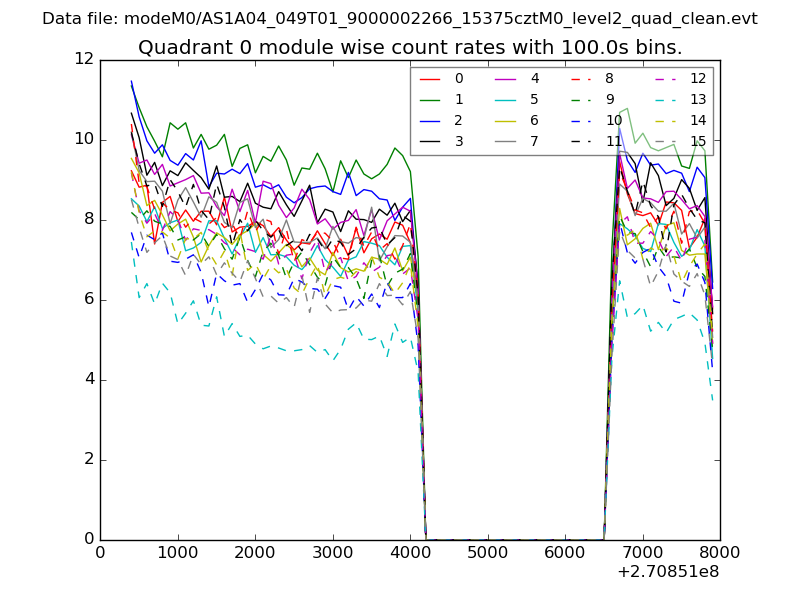 |
 |
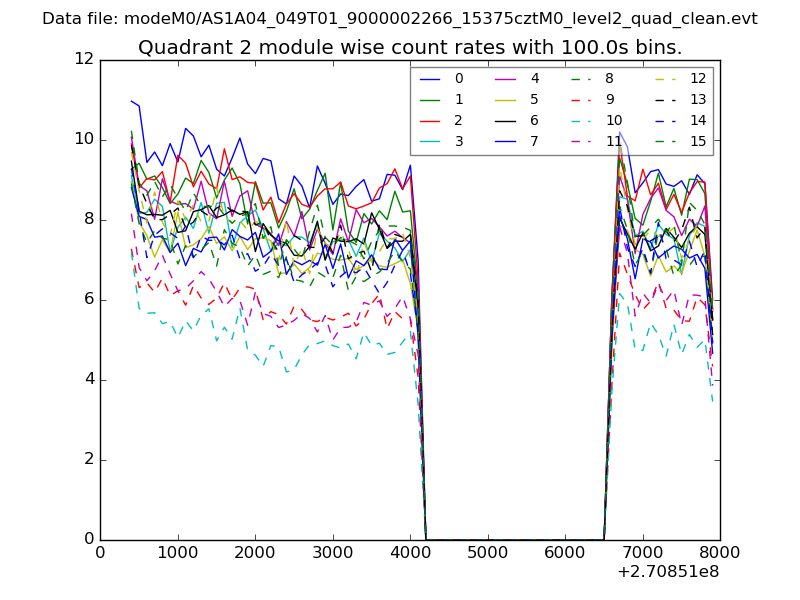
| Module-wise count rates for Quadrant B Data is divided into 100 sec bins |
 |
 |
| Module-wise count rates for Quadrant C Data is divided into 100 sec bins |
 |
 |
| Module-wise count rates for Quadrant D Data is divided into 100 sec bins |
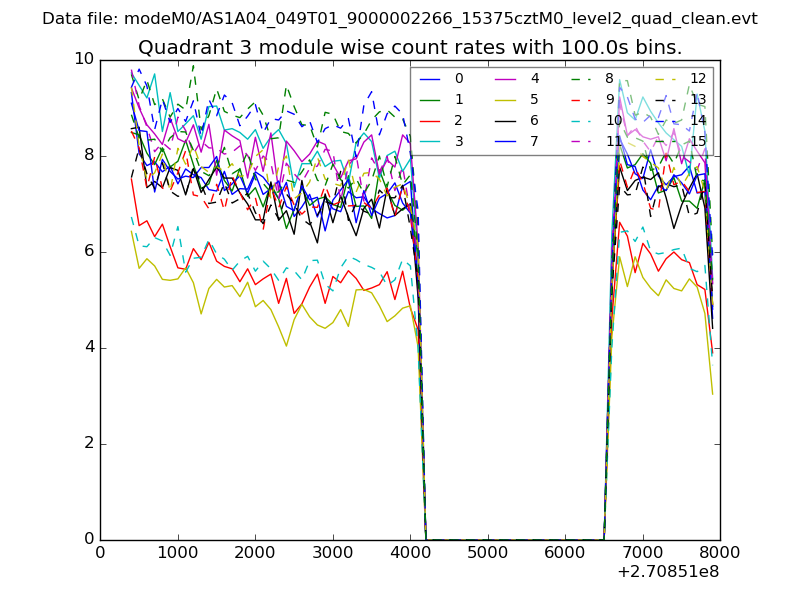 |
 |
| Parameter | Plot |
|---|---|
| CZT HV Monitor | 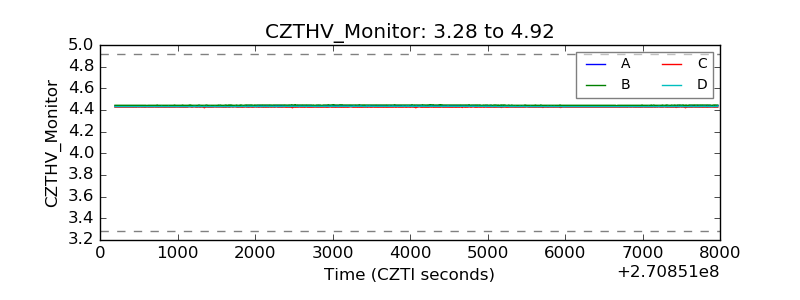 |
| D_VDD | 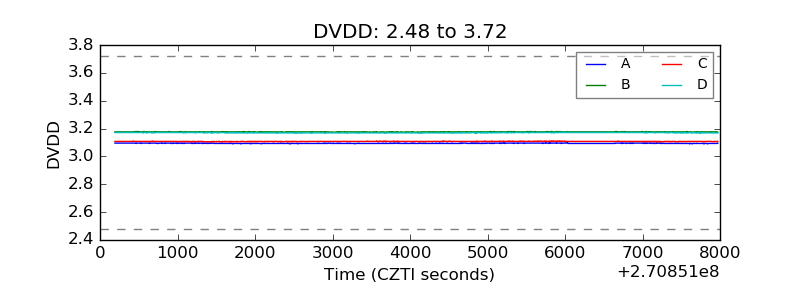 |
| Temperature 1 | 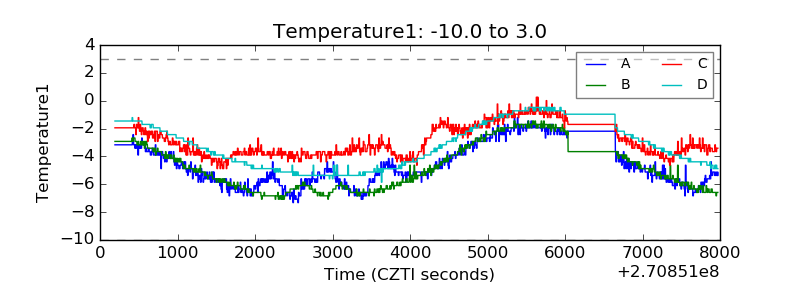 |
| Veto HV Monitor | 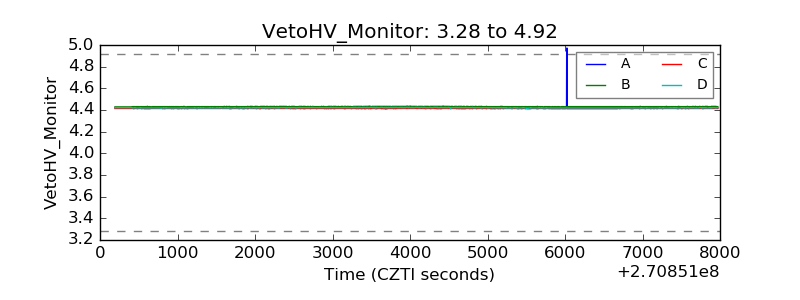 |
| Veto LLD | 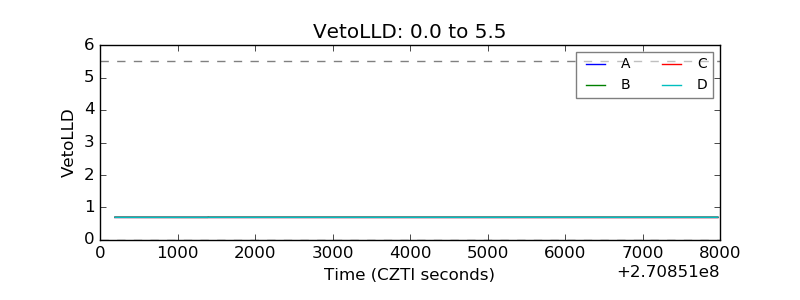 |
| Alpha Counter | 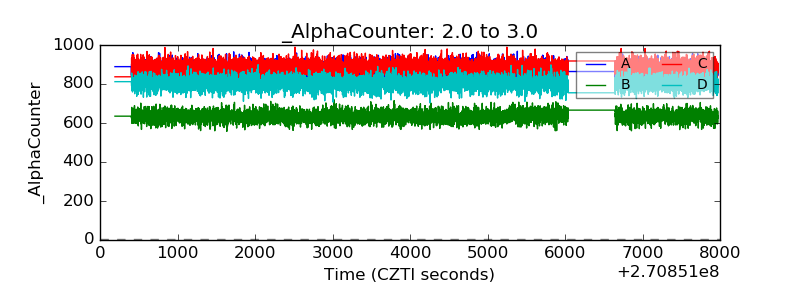 |
| _CPM_Rate | 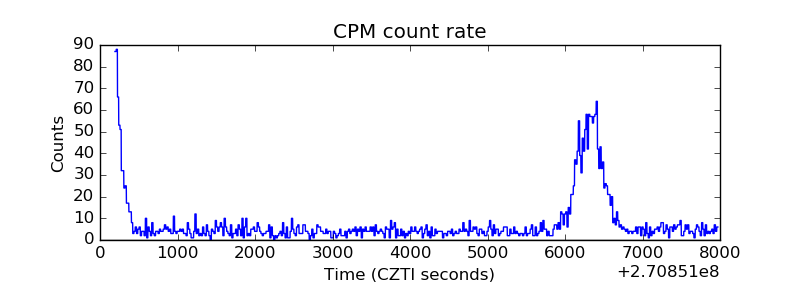 |
| CZT Counter | 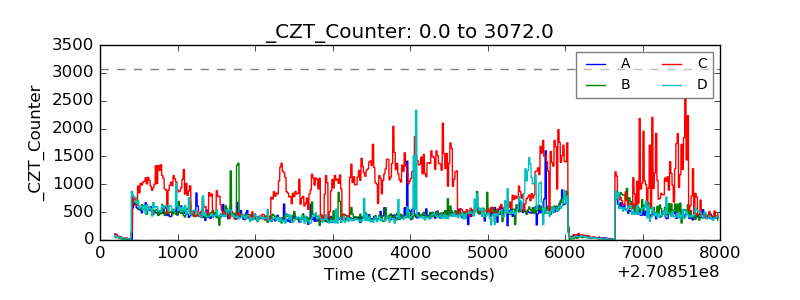 |
| +2.5 Volts monitor |  |
| +5 Volts monitor |  |
| _ROLL_ROT | 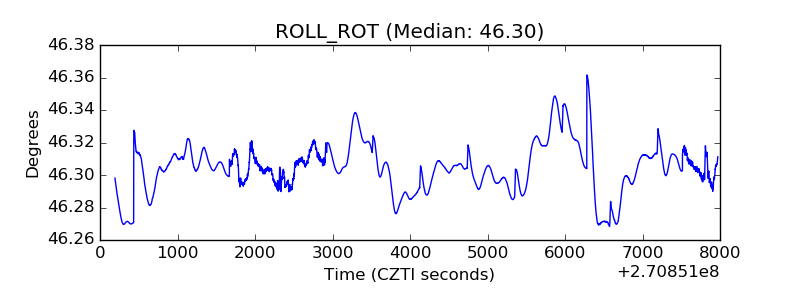 |
| _Roll_DEC | 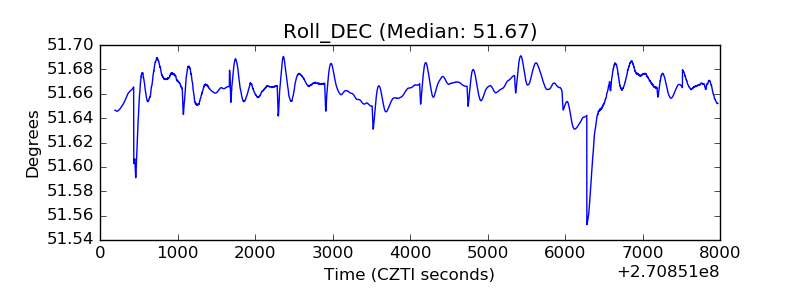 |
| _Roll_RA | 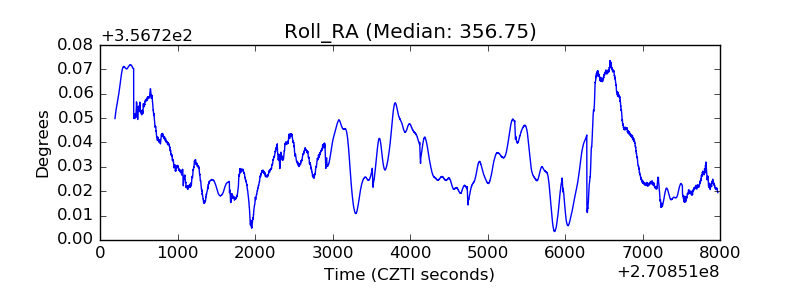 |
| Veto Counter | 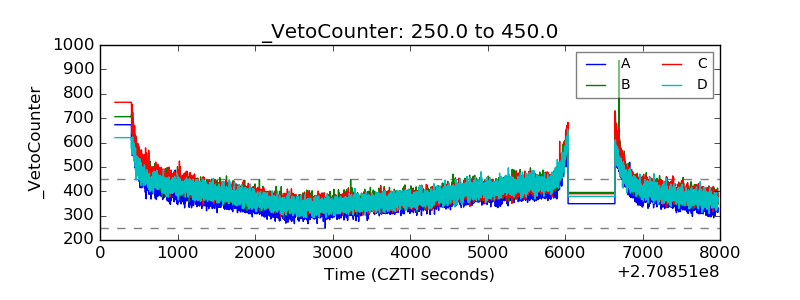 |