| Param | Original file | Final file |
|---|---|---|
| Filename | modeM0/AS1A04_049T01_9000002266_15376cztM0_level2.evt | modeM0/AS1A04_049T01_9000002266_15376cztM0_level2_quad_clean.evt |
| Size (bytes) | 207,815,040 | 53,432,640 |
| Size | 198.2 MB | 51.0 MB |
| Events in quadrant A | 1,248,056 | 355,369 |
| Events in quadrant B | 1,425,713 | 358,141 |
| Events in quadrant C | 1,955,800 | 349,443 |
| Events in quadrant D | 1,460,418 | 343,342 |
| Mode SS | |||
|---|---|---|---|
| Quadrant | BADHDUFLAG | Total packets | Discarded packets |
| A | 0 | 60 | 0 |
| B | 0 | 60 | 0 |
| C | 0 | 60 | 0 |
| D | 0 | 60 | 0 |
| Mode M0 | |||
|---|---|---|---|
| Quadrant | BADHDUFLAG | Total packets | Discarded packets |
| A | 0 | 6047 | 1 |
| B | 0 | 6417 | 1 |
| C | 0 | 8119 | 1 |
| D | 0 | 6585 | 1 |
| Mode M9 | |||
|---|---|---|---|
| Quadrant | BADHDUFLAG | Total packets | Discarded packets |
| A | 0 | 4 | 0 |
| B | 0 | 4 | 0 |
| C | 0 | 4 | 0 |
| D | 0 | 5 | 0 |
| Quadrant | Total seconds | Saturated seconds | Saturation percentage |
|---|---|---|---|
| A | 2965 | 6 | 0.202361% |
| B | 2965 | 11 | 0.370995% |
| C | 2965 | 94 | 3.170320% |
| D | 2965 | 16 | 0.539629% |
Noise dominated data is calculated using 1-second bins in cleaned event files. If a bin has >2000 counts, and if more than 50% of those come from <1% of pixels, then it is considered to be noise-dominated and hence unusable.
| Quadrant | # 1 sec bins | Bins with >0 counts | Bins with >2000 counts | High rate bins dominated by noise | Noise dominated (total time) | Noise dominated (detector-on time) | Marked lightcurve |
|---|---|---|---|---|---|---|---|
| A | 2966 | 2966 | 0 | 0 | 0.00% | 0.00% | 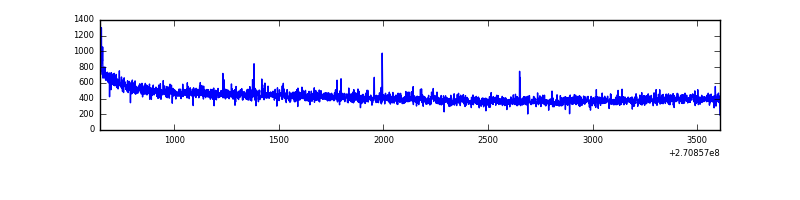 |
| B | 2966 | 2966 | 0 | 0 | 0.00% | 0.00% | 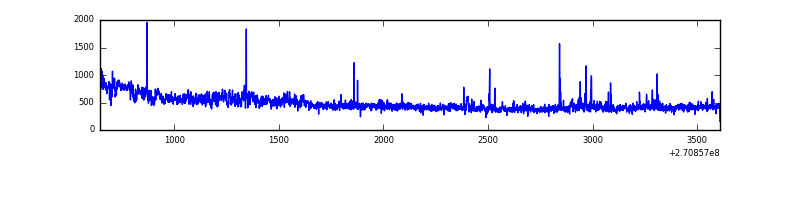 |
| C | 2966 | 2966 | 67 | 67 | 2.26% | 2.26% | 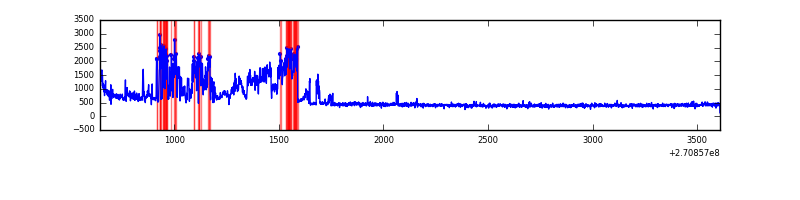 |
| D | 2966 | 2966 | 13 | 13 | 0.44% | 0.44% | 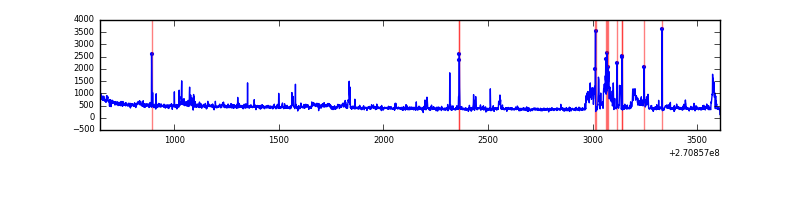 |
Top three noisy pixels from each quadrant. If the there are fewer than three noisy pixels in the level2.evt file, extra rows are filled as -1
| Pixel properties | Quadrant properties | ||||||
|---|---|---|---|---|---|---|---|
| Quadrant | DetID | PixID | Counts | Sigma | Mean | Median | Sigma |
| A | 9 | 143 | 6142 | 88.15 | 321 | 314 | 66.1 |
| A | 0 | 226 | 2791 | 37.46 | 321 | 314 | 66.1 |
| A | 12 | 194 | 2461 | 32.47 | 321 | 314 | 66.1 |
| B | 8 | 3 | 94841 | 1488.75 | 325 | 315 | 63.5 |
| B | 10 | 245 | 35230 | 549.89 | 325 | 315 | 63.5 |
| B | 0 | 214 | 8284 | 125.5 | 325 | 315 | 63.5 |
| C | 3 | 233 | 712175 | 9520.16 | 318 | 319 | 74.8 |
| C | 5 | 96 | 3445 | 41.8 | 318 | 319 | 74.8 |
| C | 13 | 61 | 2246 | 25.76 | 318 | 319 | 74.8 |
| D | 9 | 68 | 94738 | 1204.88 | 316 | 305 | 78.4 |
| D | 2 | 33 | 74827 | 950.84 | 316 | 305 | 78.4 |
| D | 13 | 122 | 30449 | 384.61 | 316 | 305 | 78.4 |
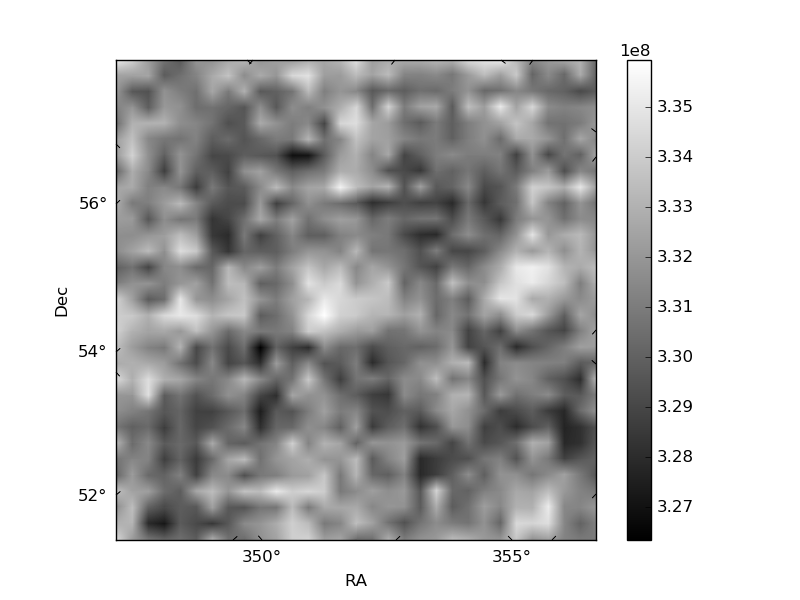
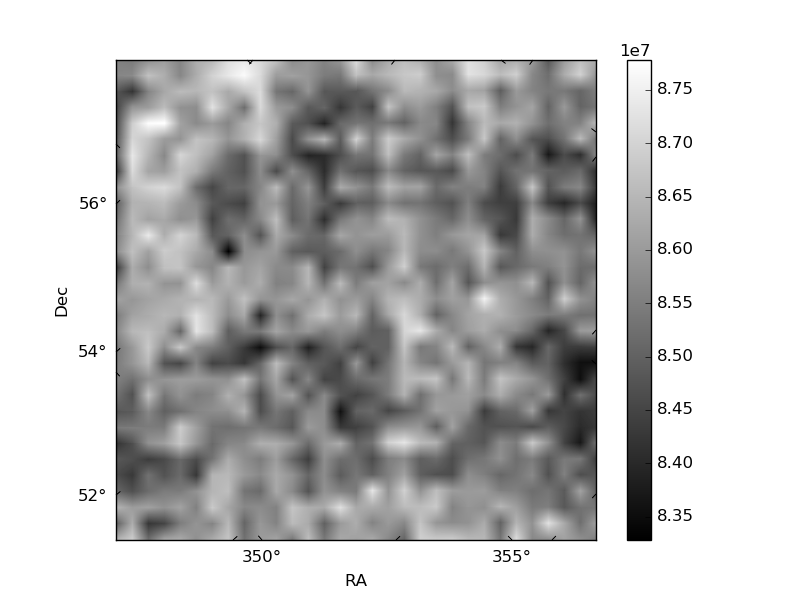
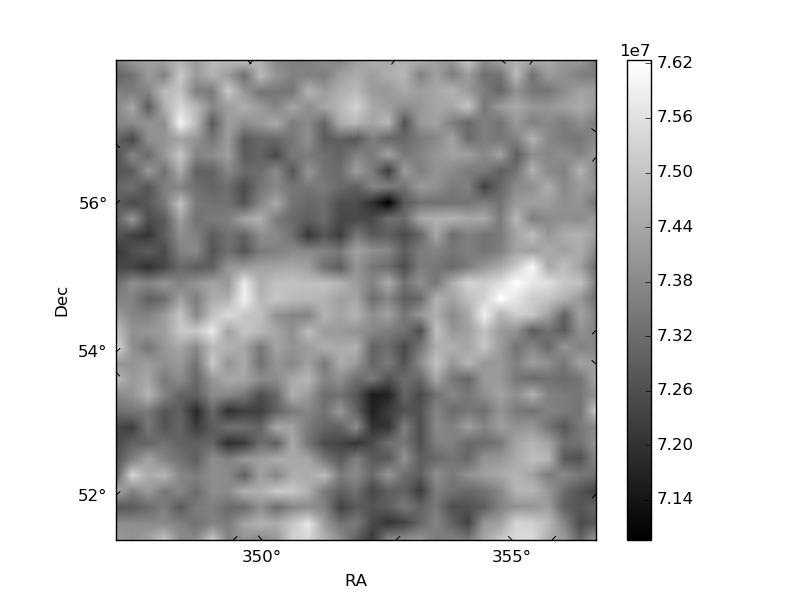
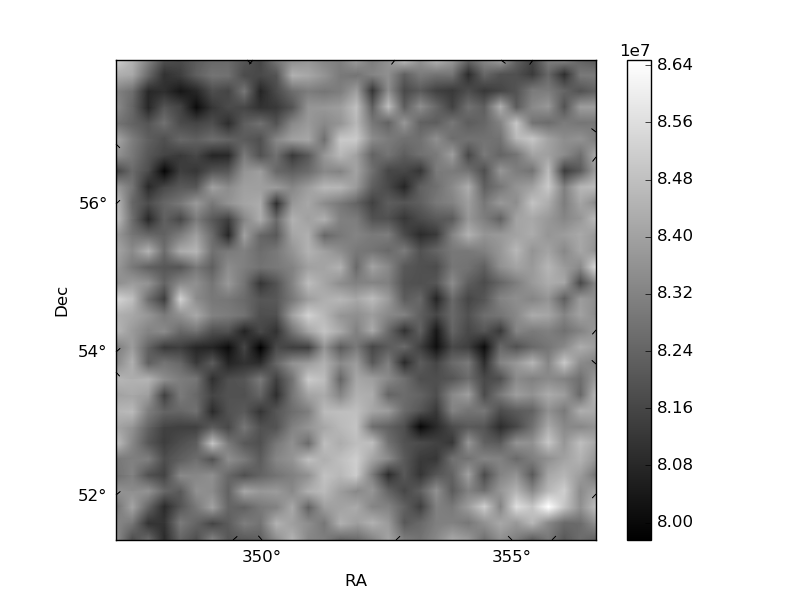
Histogram calculated using DETX and DETY for each event in the final _common_clean file
| Quadrant A | 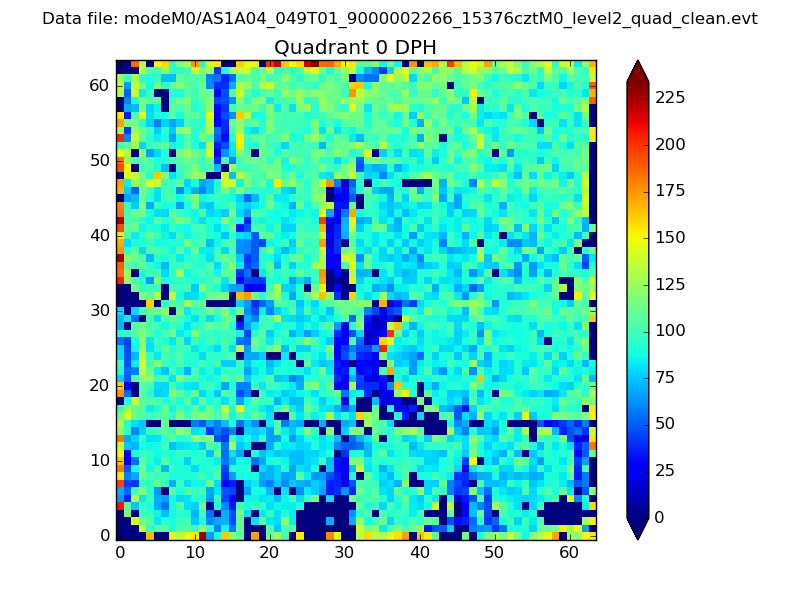 |
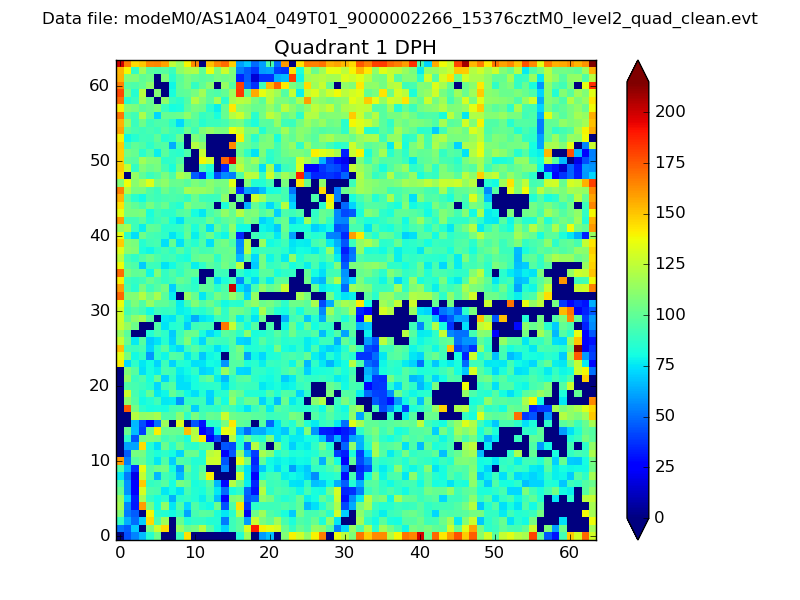 |
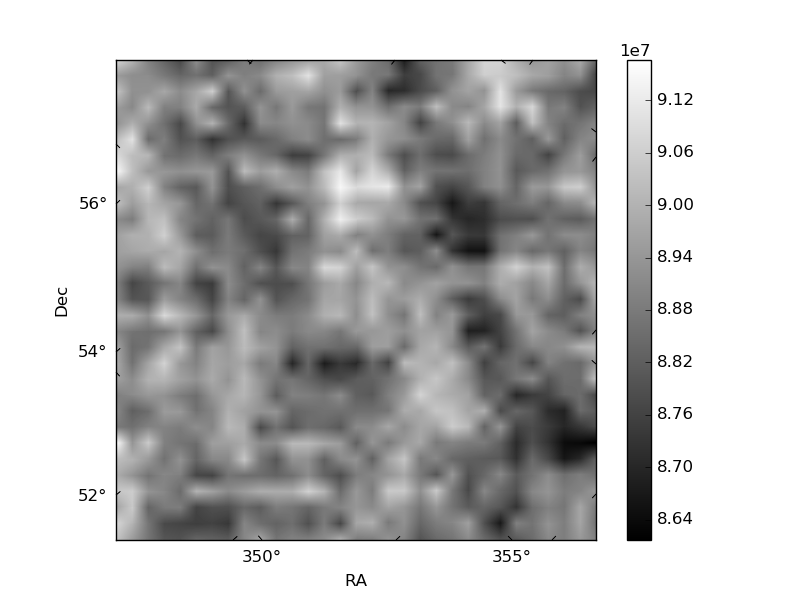
Quadrant B |
|---|---|---|---|
| Quadrant D | 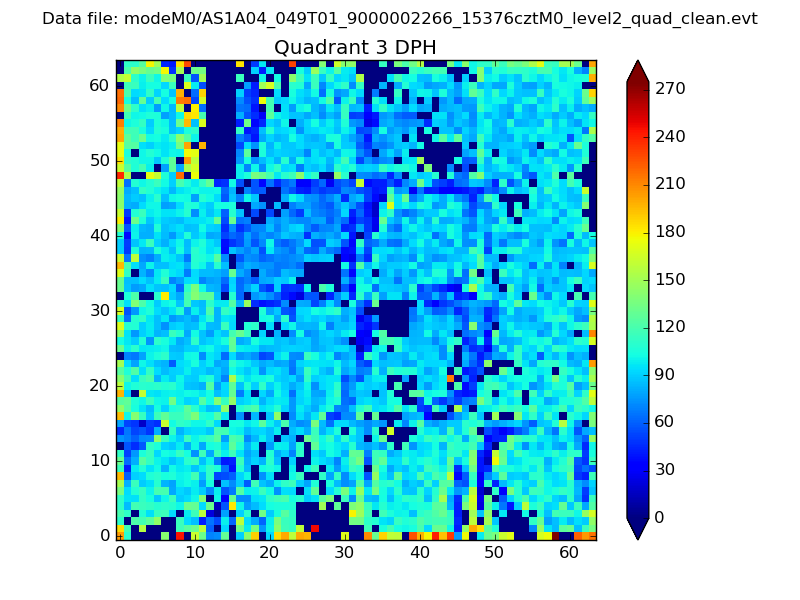 |
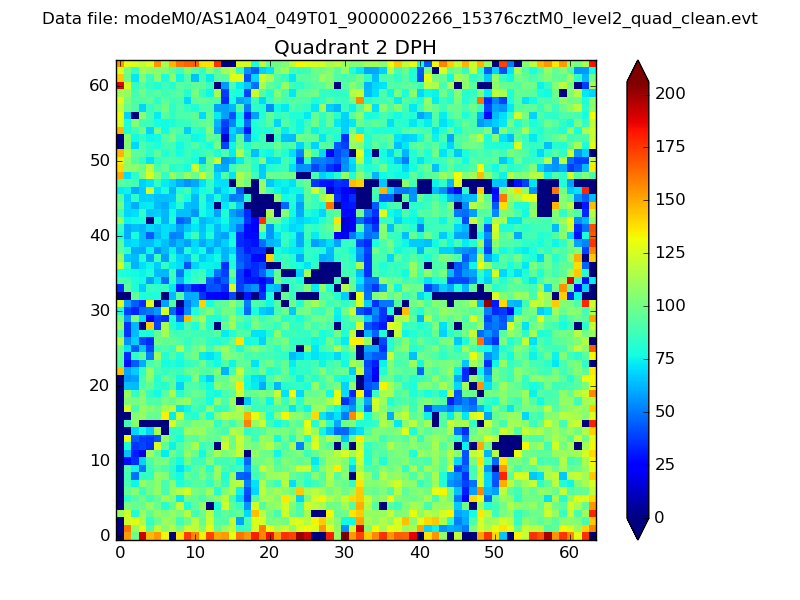 |
Quadrant C |
| Plot type | Count rate plots | Images |
|---|---|---|
| Comparison with Poisson distribution Blue bars denote a histogram of data divided into 1 sec bins. Red curve is a Poisson curve with rate = median count rate of data. |
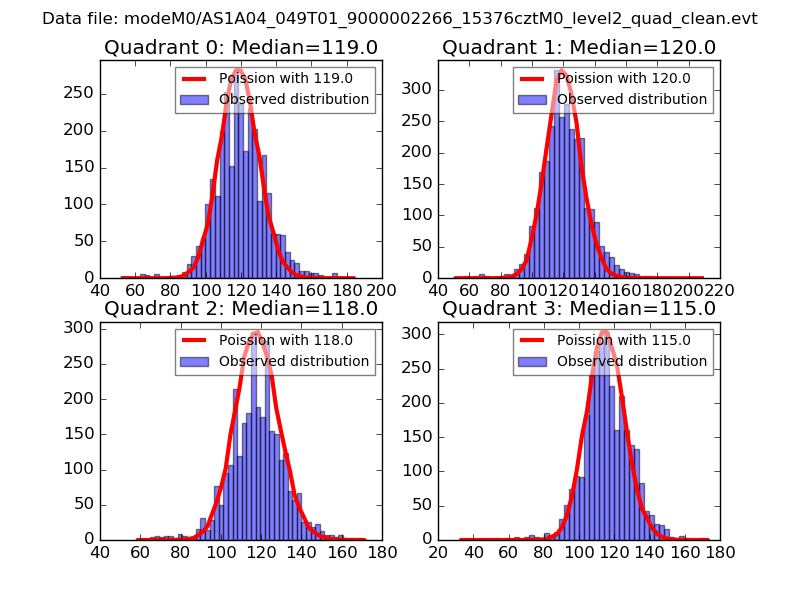 |
 |
| Quadrant-wise count rates Data is divided into 100 sec bins |
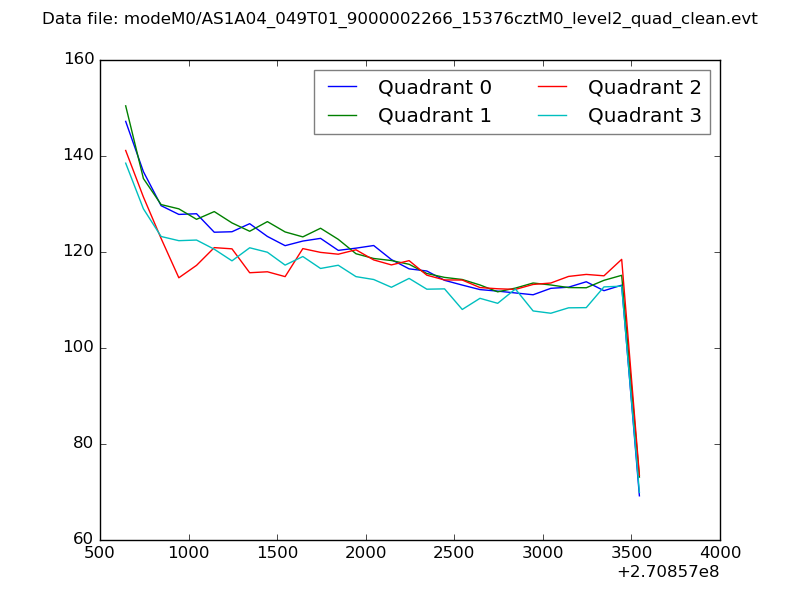 |
|
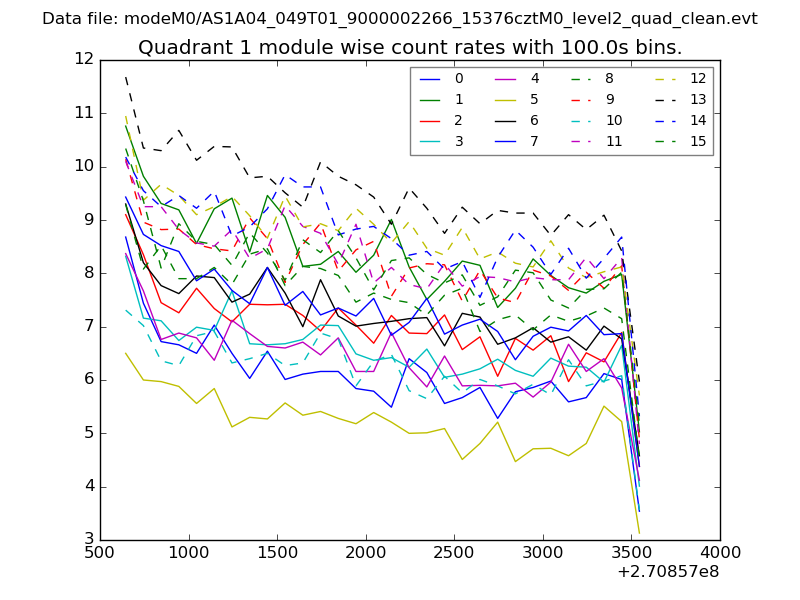
| Module-wise count rates for Quadrant A Data is divided into 100 sec bins |
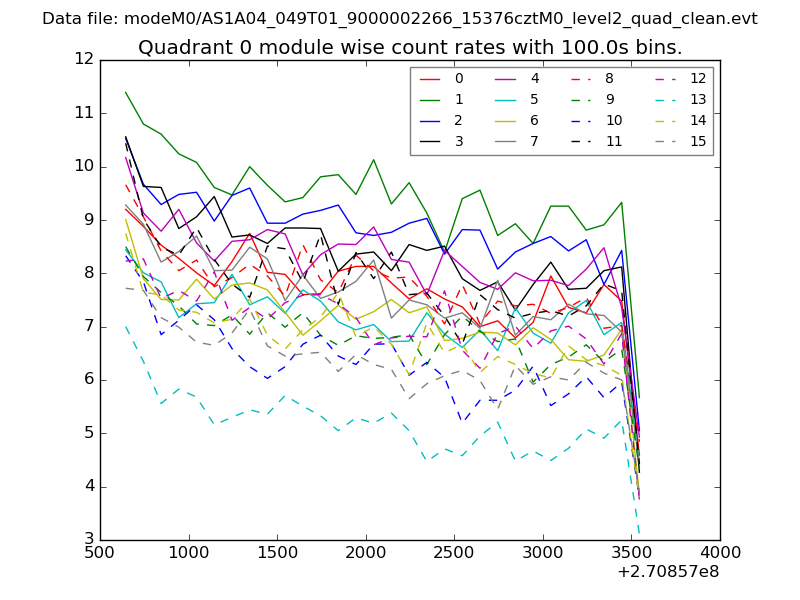 |
 |
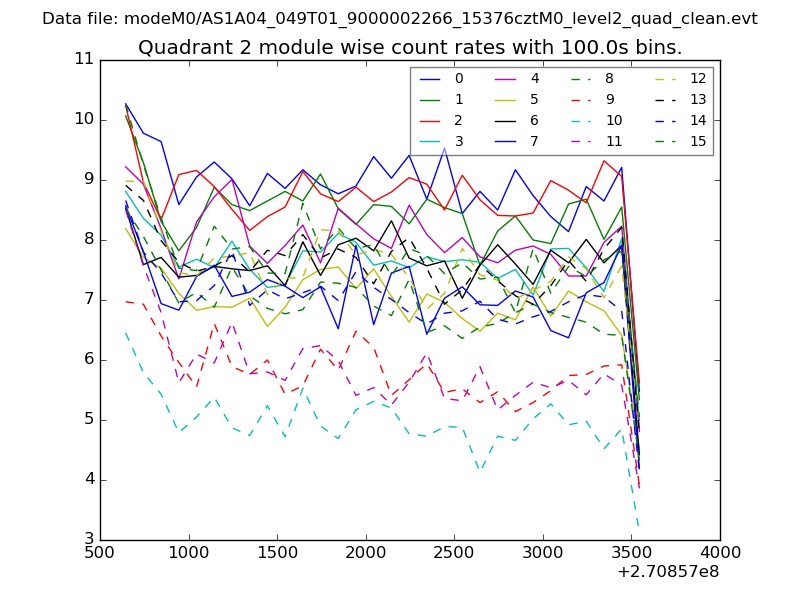
| Module-wise count rates for Quadrant B Data is divided into 100 sec bins |
 |
 |
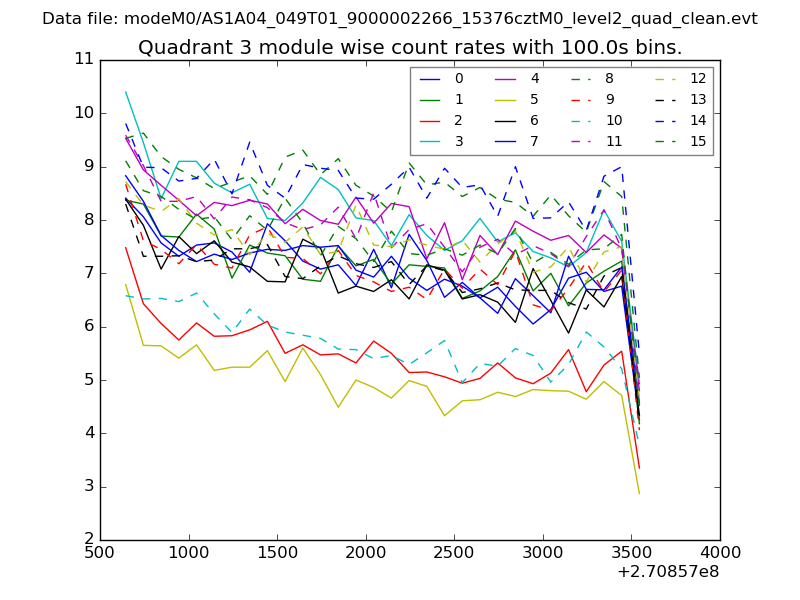
| Module-wise count rates for Quadrant C Data is divided into 100 sec bins |
 |
 |
| Module-wise count rates for Quadrant D Data is divided into 100 sec bins |
 |
 |
| Parameter | Plot |
|---|---|
| CZT HV Monitor | 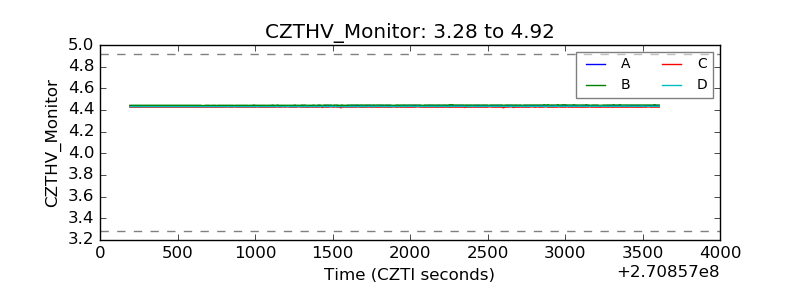 |
| D_VDD | 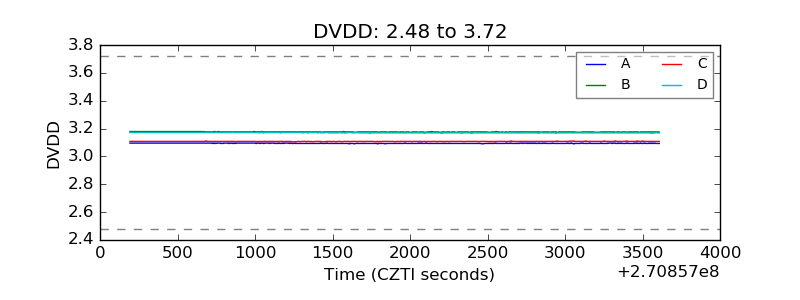 |
| Temperature 1 | 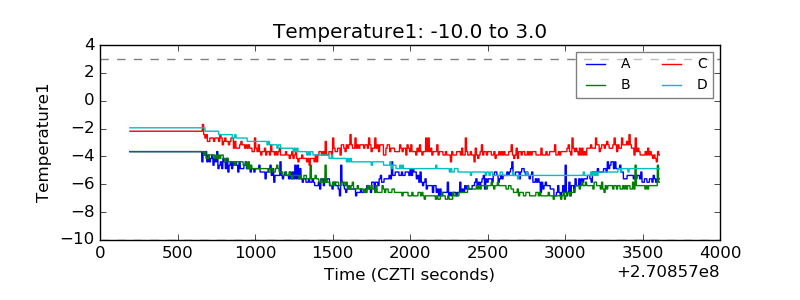 |
| Veto HV Monitor | 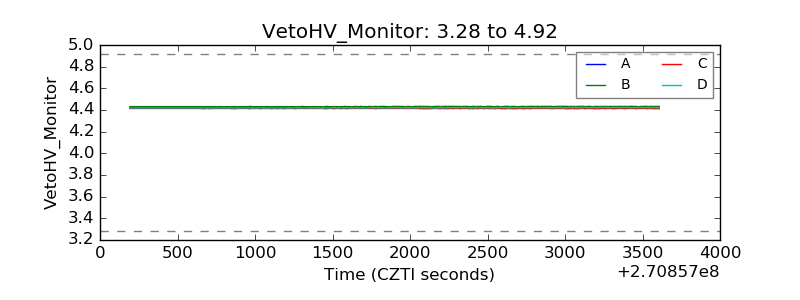 |
| Veto LLD | 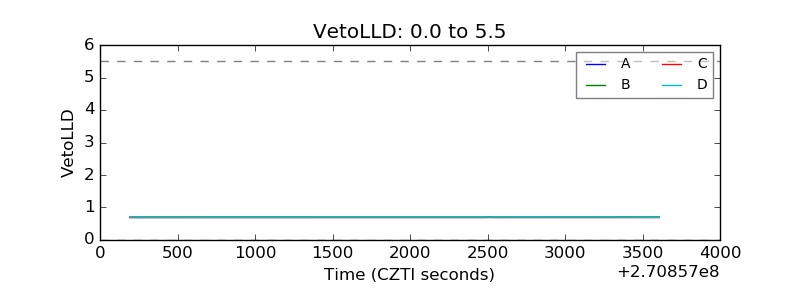 |
| Alpha Counter | 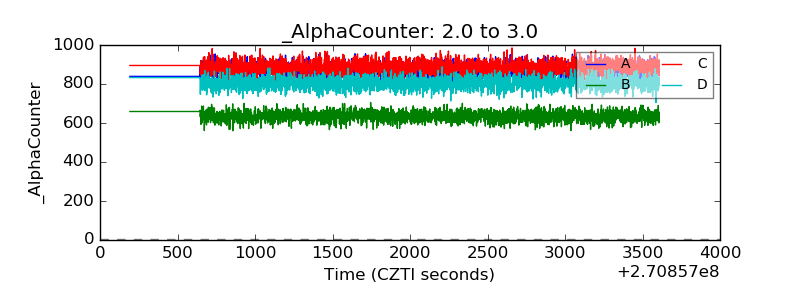 |
| _CPM_Rate | 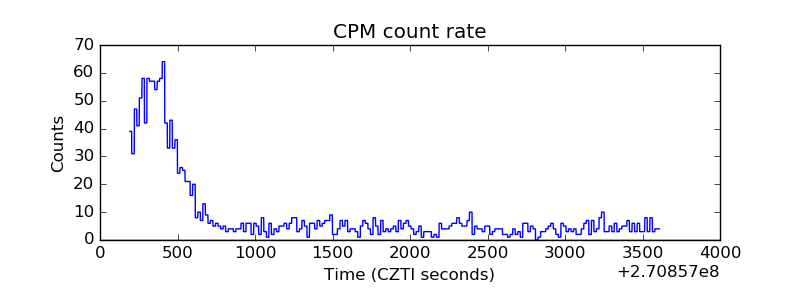 |
| CZT Counter | 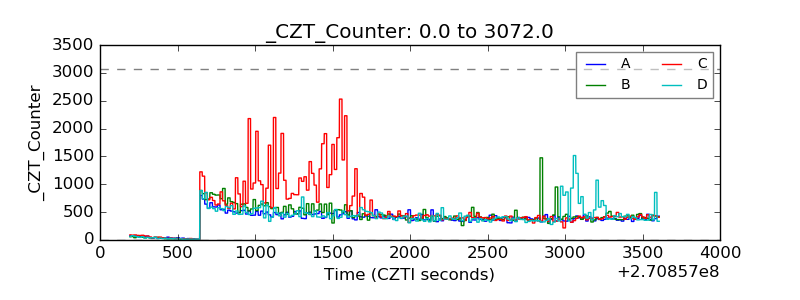 |
| +2.5 Volts monitor |  |
| +5 Volts monitor |  |
| _ROLL_ROT | 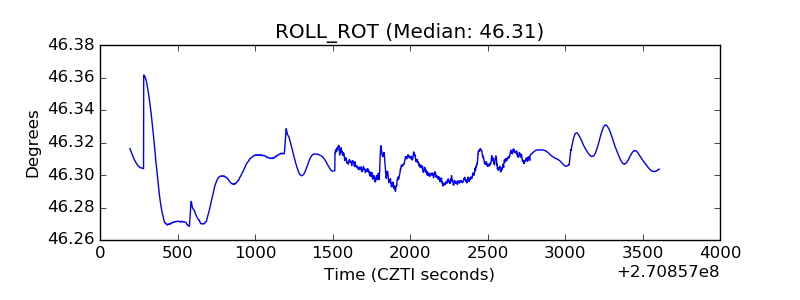 |
| _Roll_DEC | 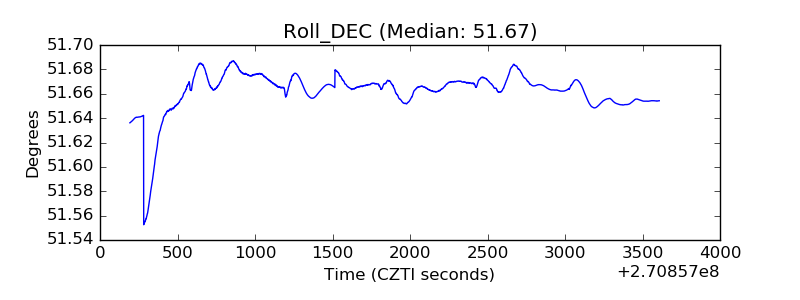 |
| _Roll_RA | 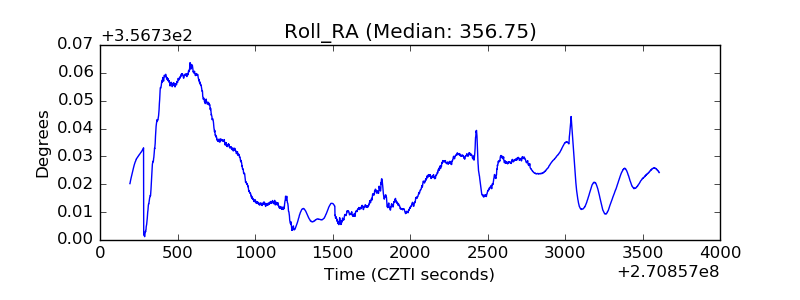 |
| Veto Counter | 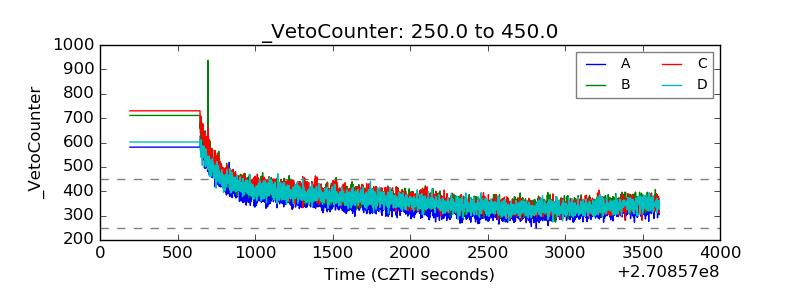 |