| Param | Original file | Final file |
|---|---|---|
| Filename | modeM0/AS1G08_035T01_9000002268cztM0_level2.fits | modeM0/AS1G08_035T01_9000002268cztM0_level2_quad_clean.evt |
| Size (bytes) | 197,703,360 | 169,292,160 |
| Size | 188.5 MB | 161.4 MB |
| Events in quadrant A | 1,150,724 | 917,723 |
| Events in quadrant B | 1,140,022 | 941,345 |
| Events in quadrant C | 1,185,770 | 941,202 |
| Events in quadrant D | 1,001,734 | 817,662 |
| Mode SS | |||
|---|---|---|---|
| Quadrant | BADHDUFLAG | Total packets | Discarded packets |
| A | 0 | 446 | 0 |
| B | 0 | 446 | 0 |
| C | 0 | 446 | 0 |
| D | 0 | 446 | 0 |
| Mode M9 | |||
|---|---|---|---|
| Quadrant | BADHDUFLAG | Total packets | Discarded packets |
| A | 0 | 19 | 0 |
| B | 0 | 19 | 0 |
| C | 0 | 19 | 0 |
| D | 0 | 19 | 0 |
| Mode M0 | |||
|---|---|---|---|
| Quadrant | BADHDUFLAG | Total packets | Discarded packets |
| A | 0 | 57466 | 0 |
| B | 0 | 57476 | 0 |
| C | 0 | 44703 | 0 |
| D | 0 | 54837 | 0 |
| Quadrant | Total seconds | Saturated seconds | Saturation percentage |
|---|---|---|---|
| A | 21906 | 1822 | 8.317356% |
| B | 21906 | 1049 | 4.788642% |
| C | 21906 | 111 | 0.506710% |
| D | 21906 | 932 | 4.254542% |
Noise dominated data is calculated using 1-second bins in cleaned event files. If a bin has >2000 counts, and if more than 50% of those come from <1% of pixels, then it is considered to be noise-dominated and hence unusable.
| Quadrant | # 1 sec bins | Bins with >0 counts | Bins with >2000 counts | High rate bins dominated by noise | Noise dominated (total time) | Noise dominated (detector-on time) | Marked lightcurve |
|---|---|---|---|---|---|---|---|
| A | 23881 | 21783 | 0 | 0 | 0.00% | 0.00% |  |
| B | 23881 | 21903 | 0 | 0 | 0.00% | 0.00% | 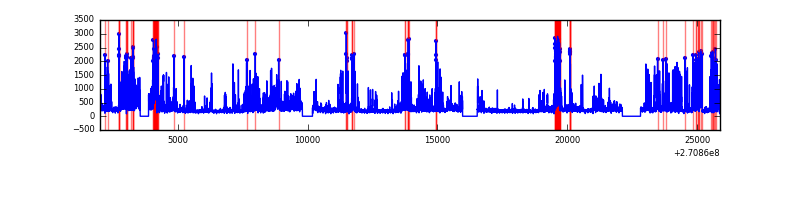 |
| C | 23881 | 21906 | 0 | 0 | 0.00% | 0.00% | 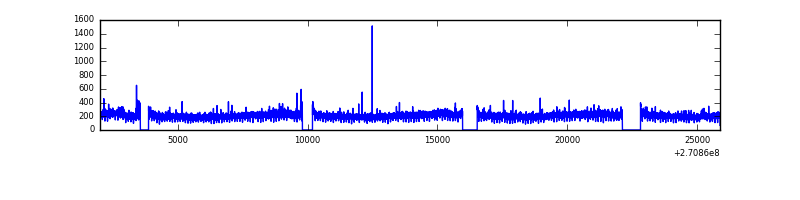 |
| D | 23881 | 21886 | 0 | 0 | 0.00% | 0.00% |  |
Top three noisy pixels from each quadrant. If the there are fewer than three noisy pixels in the level2.evt file, extra rows are filled as -1
| Pixel properties | Quadrant properties | ||||||
|---|---|---|---|---|---|---|---|
| Quadrant | DetID | PixID | Counts | Sigma | Mean | Median | Sigma |
| A | 0 | 29 | 1143 | 11.27 | 299 | 280 | 76.6 |
| A | 7 | 110 | 941 | 8.63 | 299 | 280 | 76.6 |
| A | 0 | 30 | 898 | 8.07 | 299 | 280 | 76.6 |
| B | 2 | 9 | 950 | 10.82 | 300 | 286 | 61.4 |
| B | 2 | 8 | 772 | 7.92 | 300 | 286 | 61.4 |
| B | 14 | 254 | 772 | 7.92 | 300 | 286 | 61.4 |
| C | 12 | 241 | 873 | 7.06 | 313 | 290 | 82.6 |
| C | 7 | 111 | 844 | 6.71 | 313 | 290 | 82.6 |
| C | 3 | 126 | 821 | 6.43 | 313 | 290 | 82.6 |
| D | 6 | 231 | 765 | 6.54 | 286 | 260 | 77.3 |
| D | 1 | 19 | 725 | 6.02 | 286 | 260 | 77.3 |
| D | 6 | 38 | 706 | 5.77 | 286 | 260 | 77.3 |
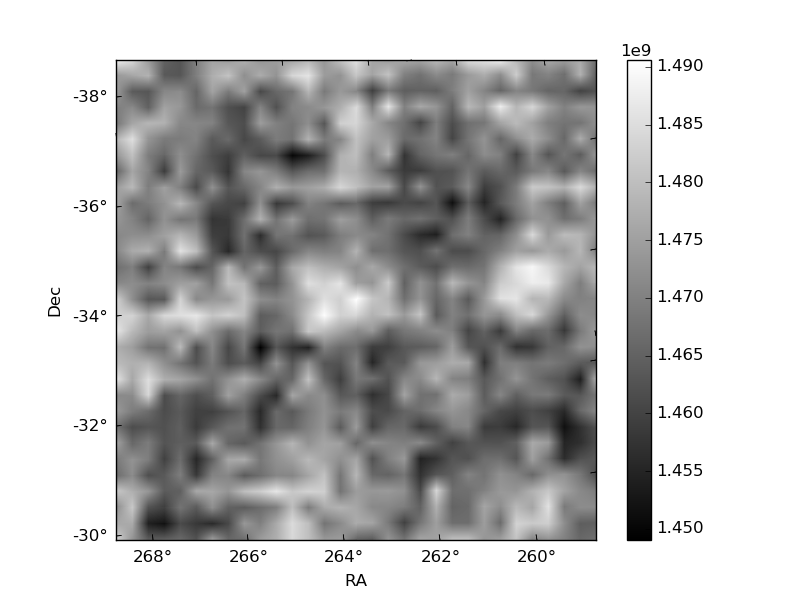
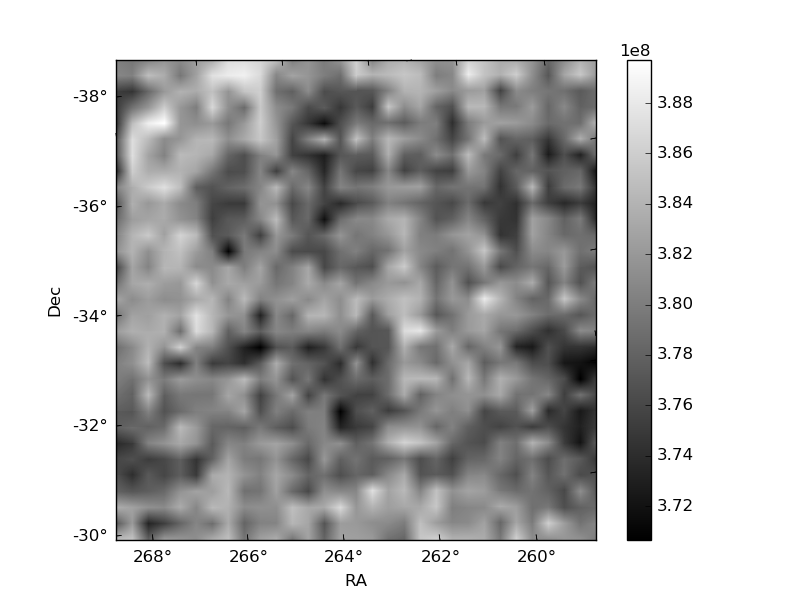
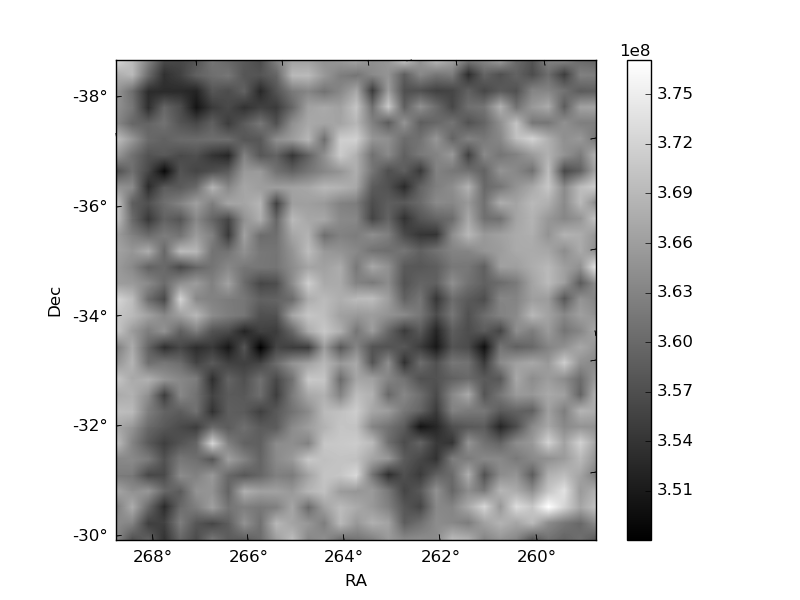
Histogram calculated using DETX and DETY for each event in the final _common_clean file
| Quadrant A |  |
 |
Quadrant B |
|---|---|---|---|
| Quadrant D |  |
 |
Quadrant C |
| Plot type | Count rate plots | Images |
|---|---|---|
| Comparison with Poisson distribution Blue bars denote a histogram of data divided into 1 sec bins. Red curve is a Poisson curve with rate = median count rate of data. |
 |
 |
| Quadrant-wise count rates Data is divided into 100 sec bins |
 |
|
| Module-wise count rates for Quadrant A Data is divided into 100 sec bins |
 |
 |
| Module-wise count rates for Quadrant B Data is divided into 100 sec bins |
 |
 |
| Module-wise count rates for Quadrant C Data is divided into 100 sec bins |
 |
 |
| Module-wise count rates for Quadrant D Data is divided into 100 sec bins |
 |
 |
| Parameter | Plot |
|---|---|
| CZT HV Monitor |  |
| D_VDD |  |
| Temperature 1 | 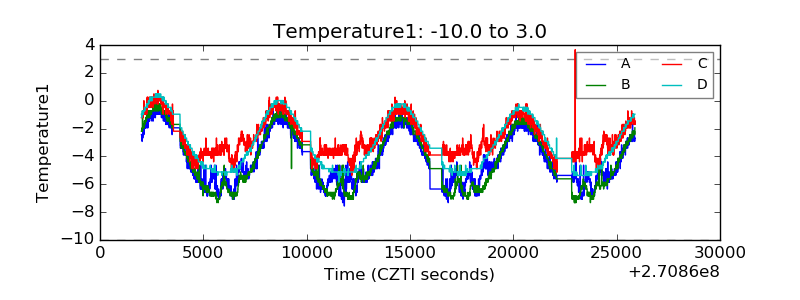 |
| Veto HV Monitor |  |
| Veto LLD | 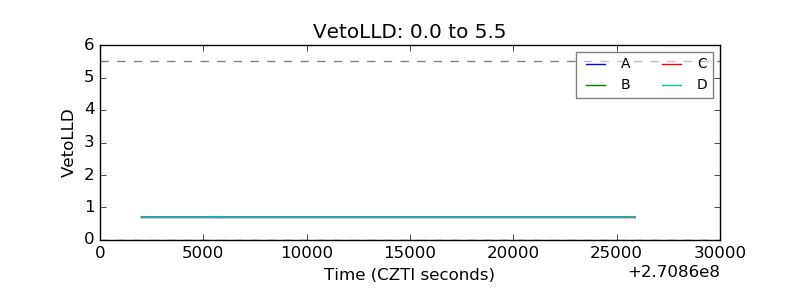 |
| Alpha Counter |  |
| _CPM_Rate | 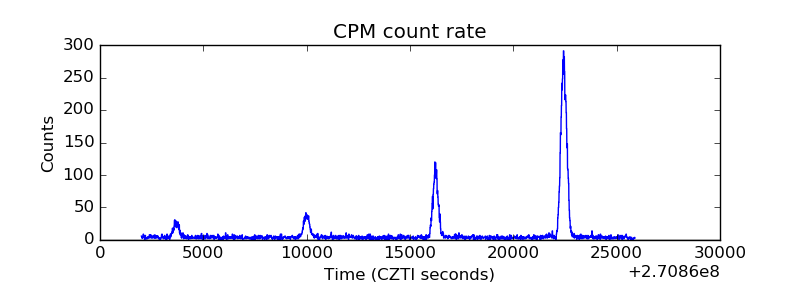 |
| CZT Counter | 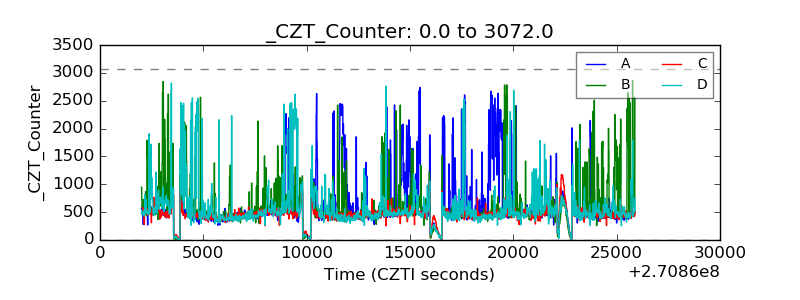 |
| +2.5 Volts monitor | 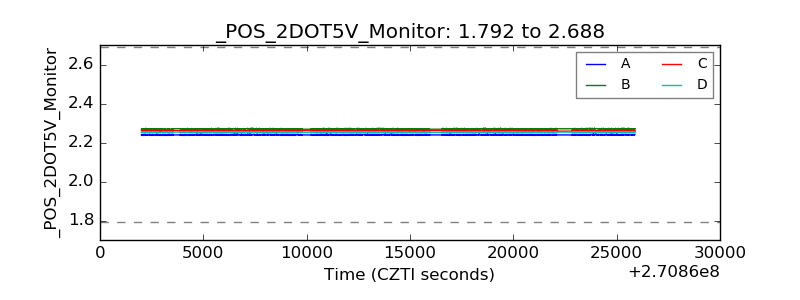 |
| +5 Volts monitor |  |
| _ROLL_ROT | 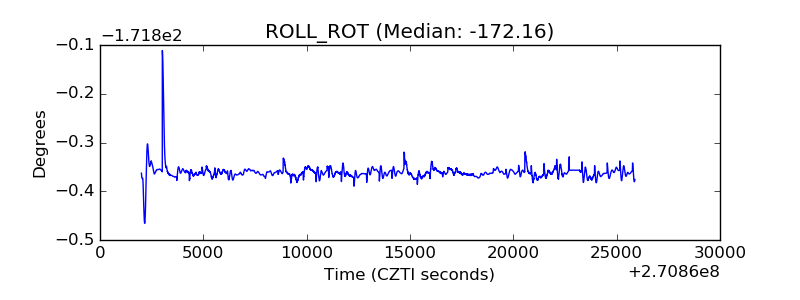 |
| _Roll_DEC |  |
| _Roll_RA | 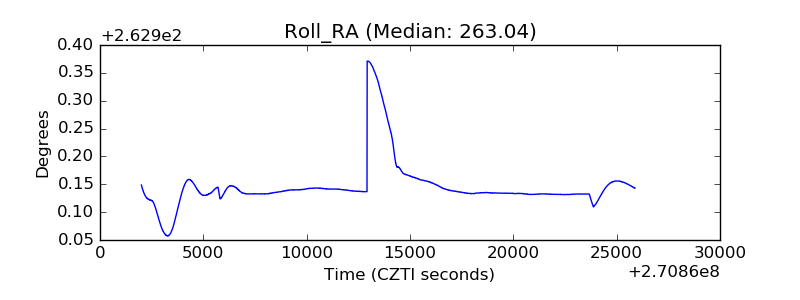 |
| Veto Counter |  |