| Param | Original file | Final file |
|---|---|---|
| Filename | modeM0/AS1G08_035T01_9000002268_15376cztM0_level2.evt | modeM0/AS1G08_035T01_9000002268_15376cztM0_level2_quad_clean.evt |
| Size (bytes) | 277,450,560 | 56,779,200 |
| Size | 264.6 MB | 54.1 MB |
| Events in quadrant A | 1,509,442 | 390,779 |
| Events in quadrant B | 2,530,005 | 379,145 |
| Events in quadrant C | 1,497,638 | 391,596 |
| Events in quadrant D | 2,654,657 | 338,075 |
| Mode SS | |||
|---|---|---|---|
| Quadrant | BADHDUFLAG | Total packets | Discarded packets |
| A | 0 | 64 | 0 |
| B | 0 | 64 | 0 |
| C | 0 | 64 | 0 |
| D | 0 | 64 | 0 |
| Mode M9 | |||
|---|---|---|---|
| Quadrant | BADHDUFLAG | Total packets | Discarded packets |
| A | 0 | 3 | 0 |
| B | 0 | 3 | 0 |
| C | 0 | 3 | 0 |
| D | 0 | 3 | 0 |
| Mode M0 | |||
|---|---|---|---|
| Quadrant | BADHDUFLAG | Total packets | Discarded packets |
| A | 0 | 6483 | 2 |
| B | 0 | 9539 | 1 |
| C | 0 | 6431 | 1 |
| D | 0 | 9987 | 1 |
| Quadrant | Total seconds | Saturated seconds | Saturation percentage |
|---|---|---|---|
| A | 3081 | 28 | 0.908796% |
| B | 3081 | 322 | 10.451152% |
| C | 3081 | 20 | 0.649140% |
| D | 3081 | 429 | 13.924051% |
Noise dominated data is calculated using 1-second bins in cleaned event files. If a bin has >2000 counts, and if more than 50% of those come from <1% of pixels, then it is considered to be noise-dominated and hence unusable.
| Quadrant | # 1 sec bins | Bins with >0 counts | Bins with >2000 counts | High rate bins dominated by noise | Noise dominated (total time) | Noise dominated (detector-on time) | Marked lightcurve |
|---|---|---|---|---|---|---|---|
| A | 3402 | 3083 | 0 | 0 | 0.00% | 0.00% | 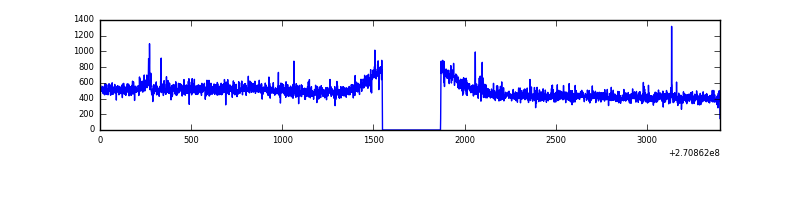 |
| B | 3402 | 3083 | 170 | 170 | 5.00% | 5.51% | 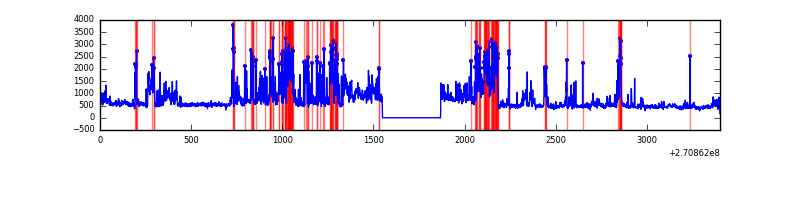 |
| C | 3402 | 3083 | 0 | 0 | 0.00% | 0.00% | 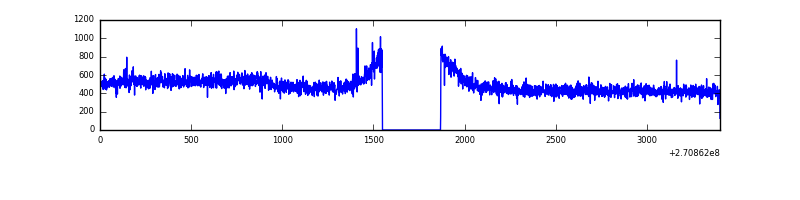 |
| D | 3402 | 3083 | 355 | 355 | 10.44% | 11.51% | 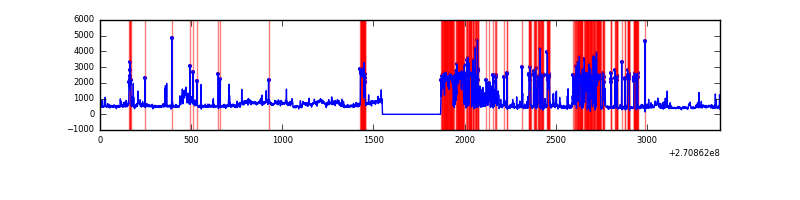 |
Top three noisy pixels from each quadrant. If the there are fewer than three noisy pixels in the level2.evt file, extra rows are filled as -1
| Pixel properties | Quadrant properties | ||||||
|---|---|---|---|---|---|---|---|
| Quadrant | DetID | PixID | Counts | Sigma | Mean | Median | Sigma |
| A | 9 | 143 | 8159 | 97.0 | 387 | 378 | 80.2 |
| A | 15 | 157 | 6700 | 78.81 | 387 | 378 | 80.2 |
| A | 0 | 226 | 3585 | 39.98 | 387 | 378 | 80.2 |
| B | 10 | 16 | 646212 | 8754.44 | 375 | 366 | 73.8 |
| B | 10 | 245 | 148866 | 2012.92 | 375 | 366 | 73.8 |
| B | 8 | 3 | 115995 | 1567.35 | 375 | 366 | 73.8 |
| C | 3 | 233 | 46670 | 527.09 | 370 | 370 | 87.8 |
| C | 8 | 128 | 3243 | 32.71 | 370 | 370 | 87.8 |
| C | 13 | 61 | 2756 | 27.16 | 370 | 370 | 87.8 |
| D | 9 | 68 | 796667 | 9272.54 | 342 | 331 | 85.9 |
| D | 13 | 122 | 171003 | 1987.3 | 342 | 331 | 85.9 |
| D | 7 | 38 | 133230 | 1547.48 | 342 | 331 | 85.9 |
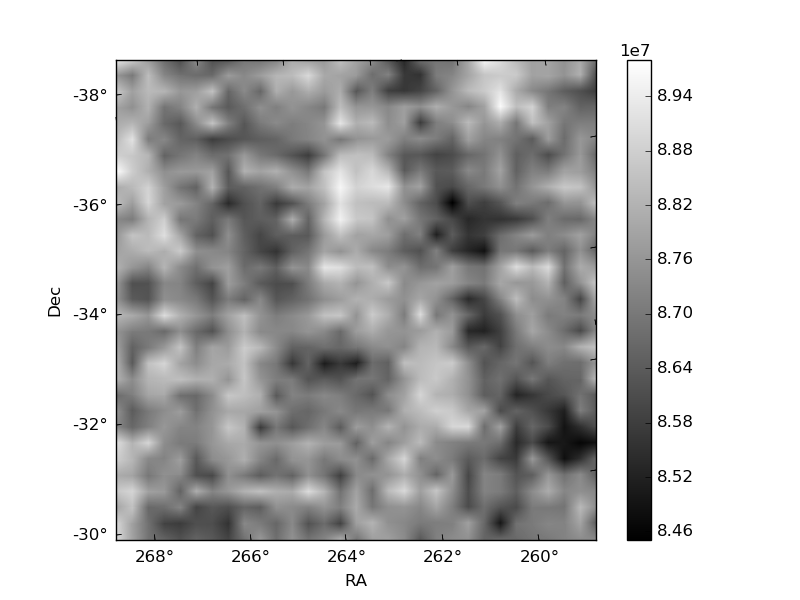
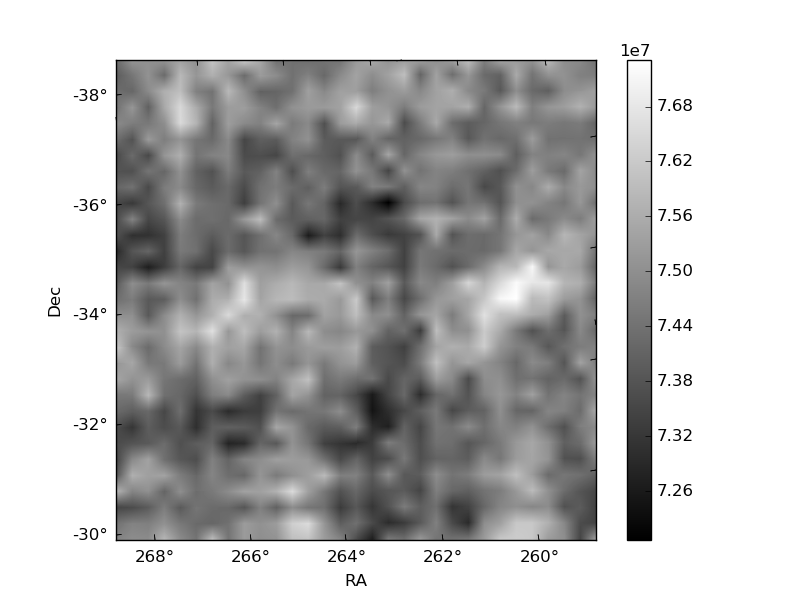
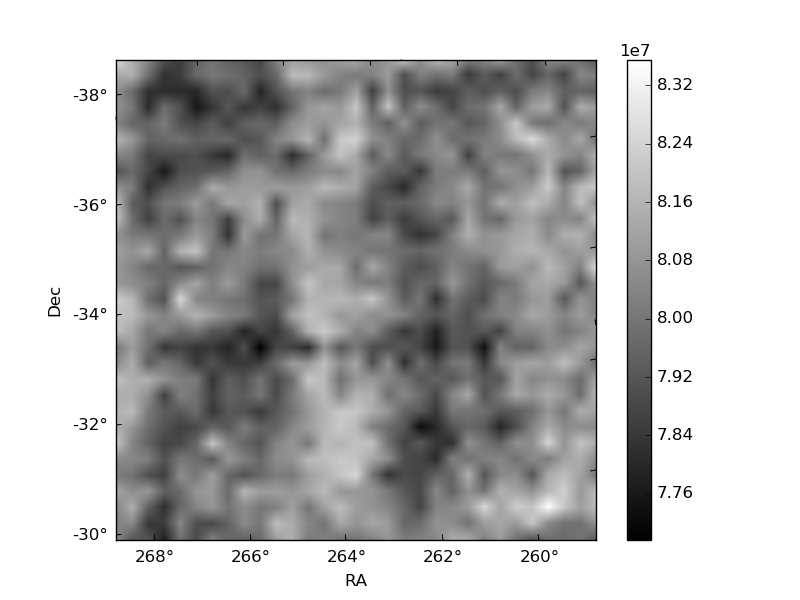
Histogram calculated using DETX and DETY for each event in the final _common_clean file
| Quadrant A |  |
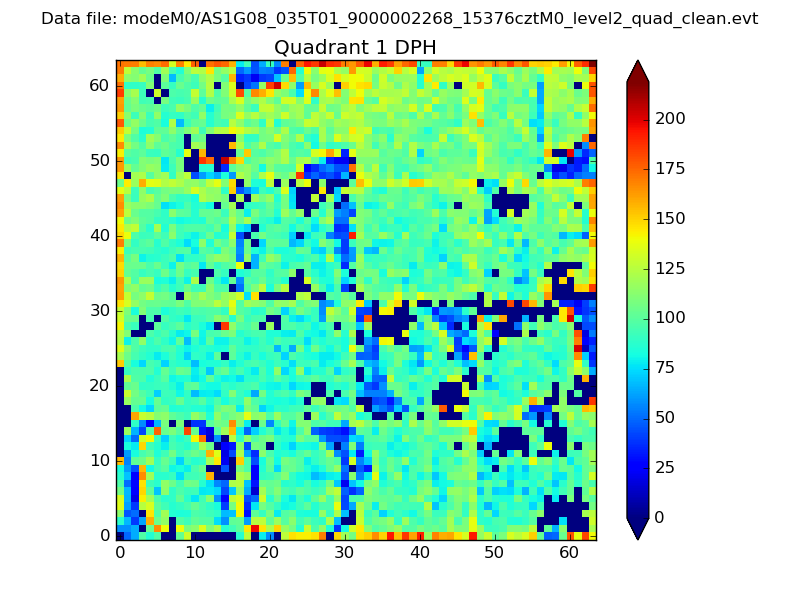 |
Quadrant B |
|---|---|---|---|
| Quadrant D | 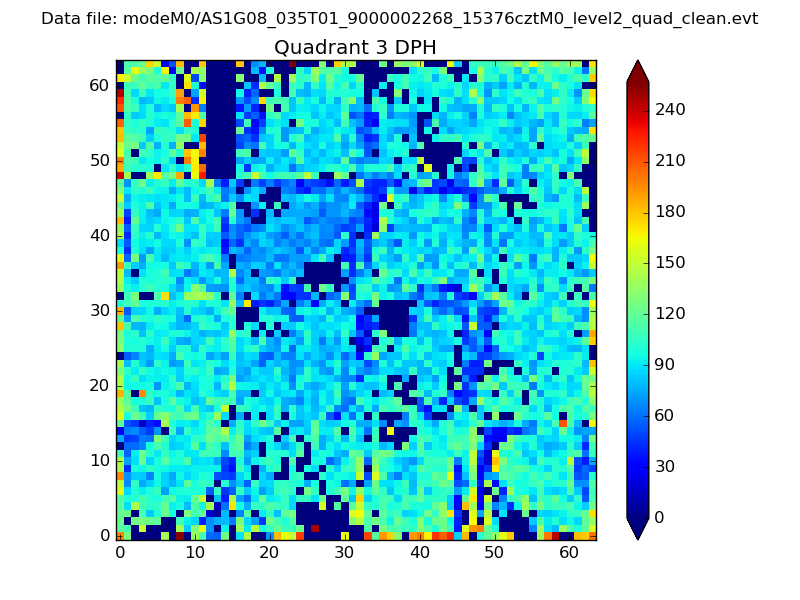 |
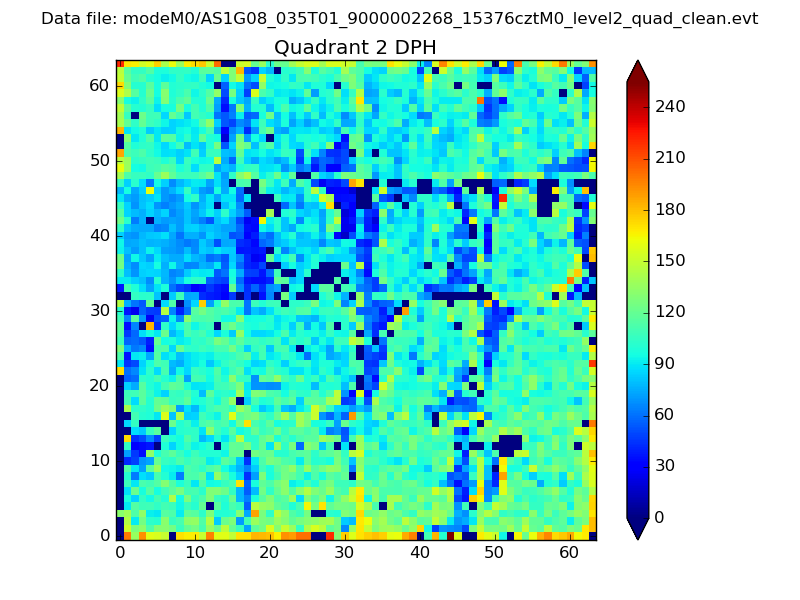 |
Quadrant C |
| Plot type | Count rate plots | Images |
|---|---|---|
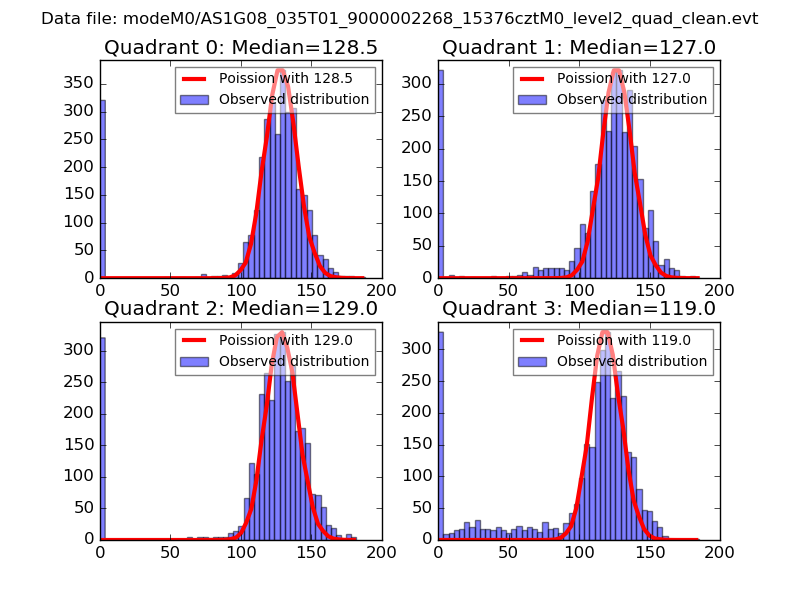
| Comparison with Poisson distribution Blue bars denote a histogram of data divided into 1 sec bins. Red curve is a Poisson curve with rate = median count rate of data. |
 |
 |
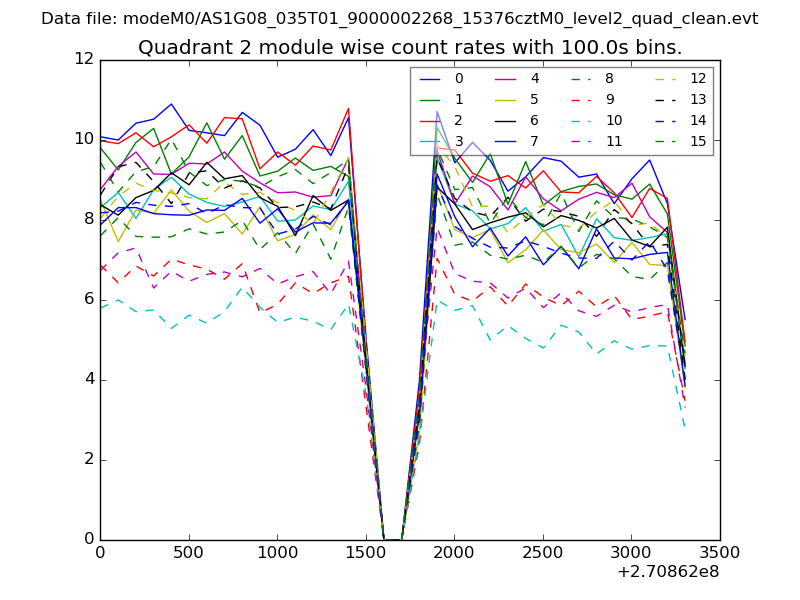
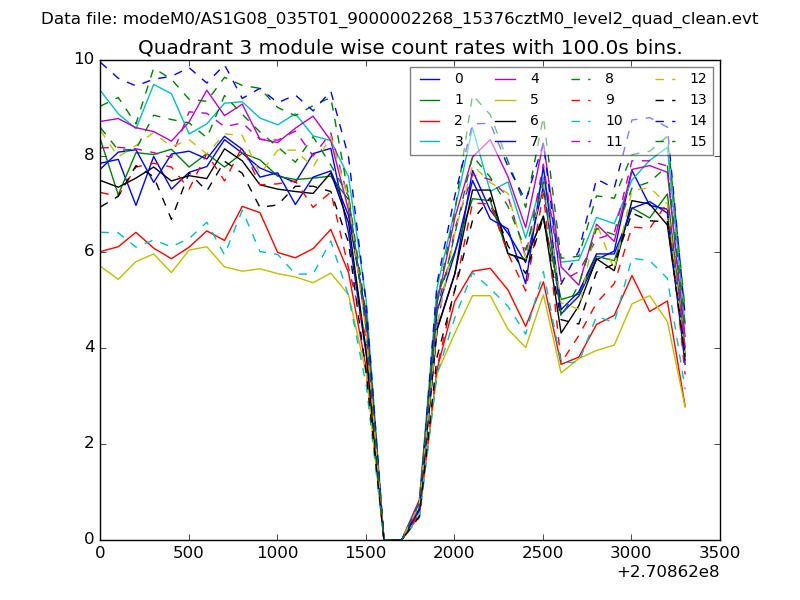
| Quadrant-wise count rates Data is divided into 100 sec bins |
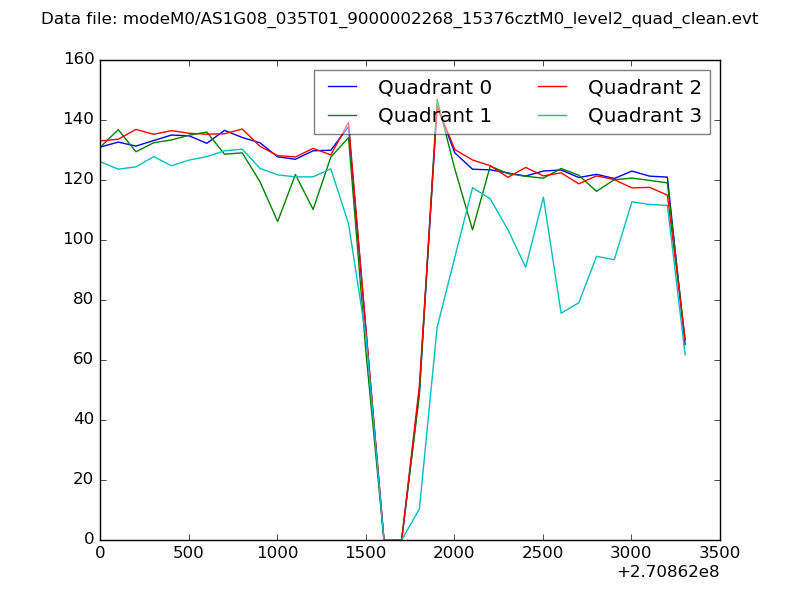 |
|
| Module-wise count rates for Quadrant A Data is divided into 100 sec bins |
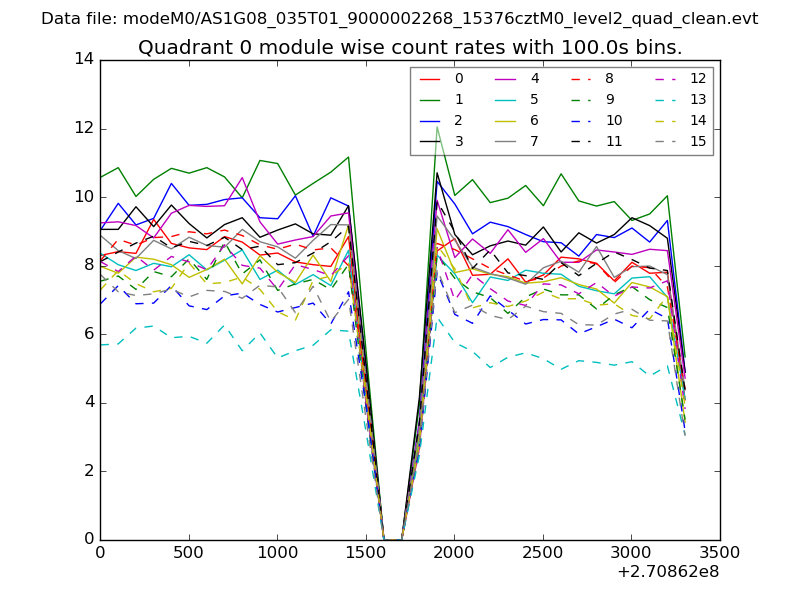 |
 |
| Module-wise count rates for Quadrant B Data is divided into 100 sec bins |
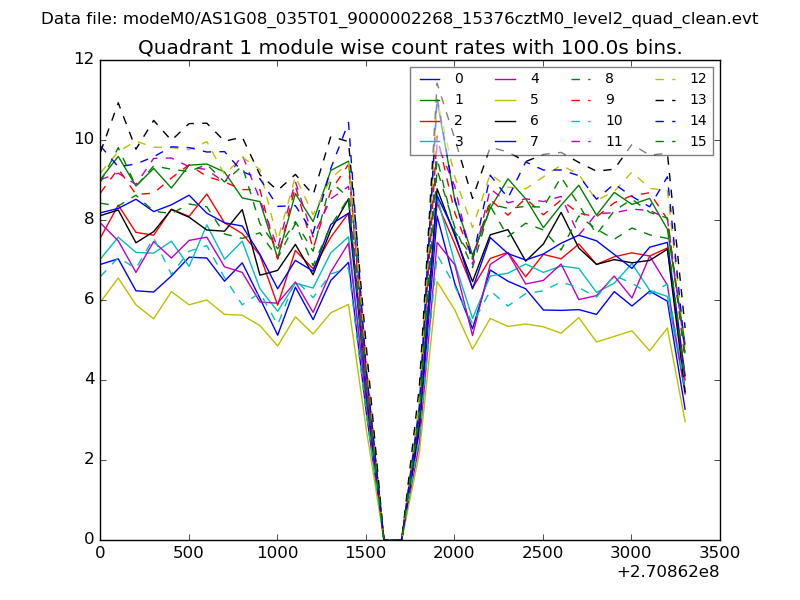 |
 |
| Module-wise count rates for Quadrant C Data is divided into 100 sec bins |
 |
 |
| Module-wise count rates for Quadrant D Data is divided into 100 sec bins |
 |
 |
| Parameter | Plot |
|---|---|
| CZT HV Monitor | 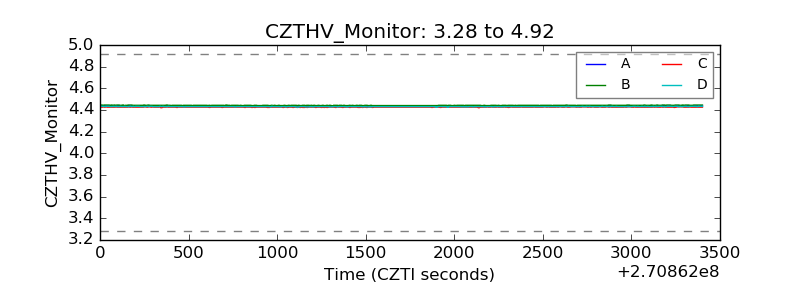 |
| D_VDD | 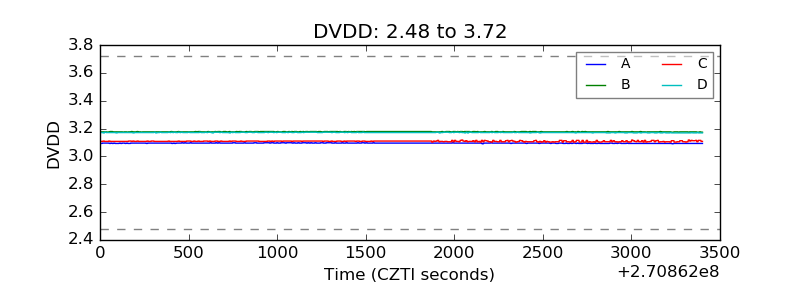 |
| Temperature 1 | 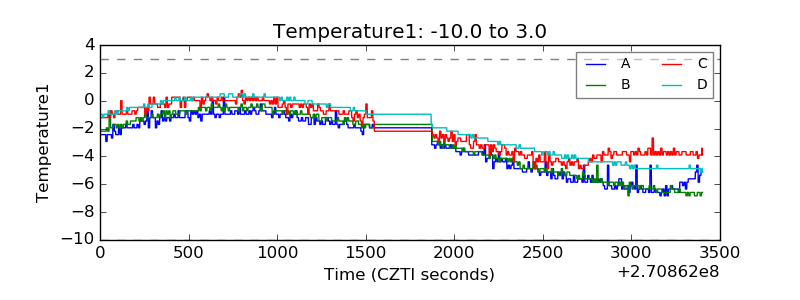 |
| Veto HV Monitor | 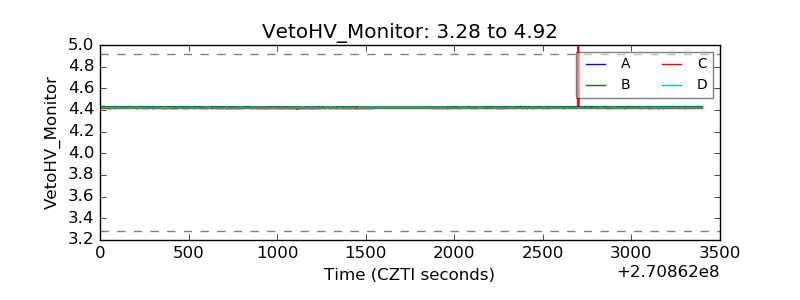 |
| Veto LLD | 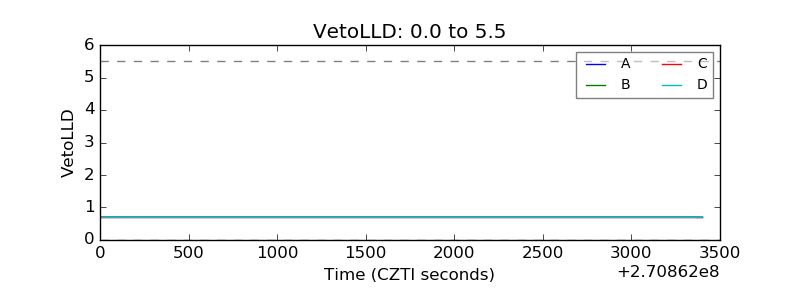 |
| Alpha Counter | 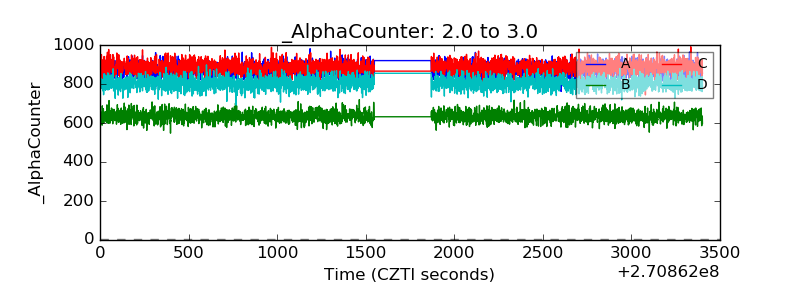 |
| _CPM_Rate | 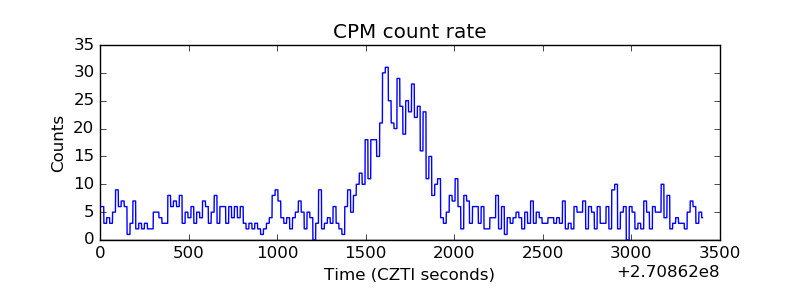 |
| CZT Counter |  |
| +2.5 Volts monitor |  |
| +5 Volts monitor |  |
| _ROLL_ROT | 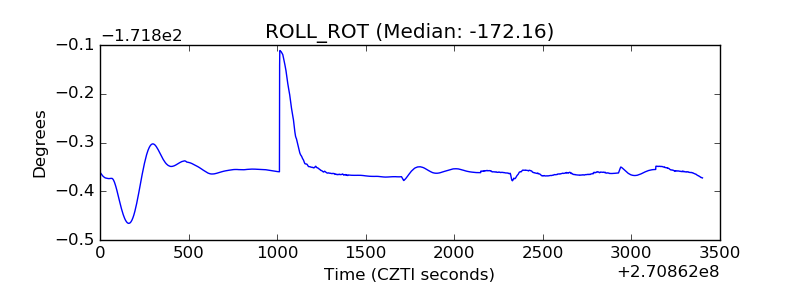 |
| _Roll_DEC |  |
| _Roll_RA | 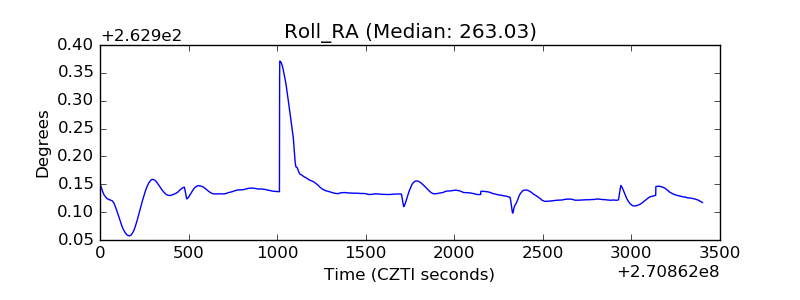 |
| Veto Counter | 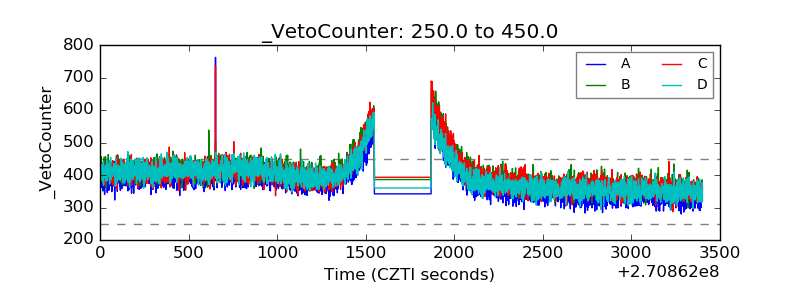 |