| Param | Original file | Final file |
|---|---|---|
| Filename | modeM0/AS1G08_035T01_9000002268_15377cztM0_level2.evt | modeM0/AS1G08_035T01_9000002268_15377cztM0_level2_quad_clean.evt |
| Size (bytes) | 701,337,600 | 112,916,160 |
| Size | 668.8 MB | 107.7 MB |
| Events in quadrant A | 5,163,672 | 715,707 |
| Events in quadrant B | 5,737,072 | 726,852 |
| Events in quadrant C | 3,949,700 | 737,084 |
| Events in quadrant D | 5,817,160 | 652,463 |
| Mode SS | |||
|---|---|---|---|
| Quadrant | BADHDUFLAG | Total packets | Discarded packets |
| A | 0 | 174 | 0 |
| B | 0 | 174 | 0 |
| C | 0 | 174 | 0 |
| D | 0 | 174 | 0 |
| Mode M9 | |||
|---|---|---|---|
| Quadrant | BADHDUFLAG | Total packets | Discarded packets |
| A | 0 | 6 | 0 |
| B | 0 | 6 | 0 |
| C | 0 | 6 | 0 |
| D | 0 | 6 | 0 |
| Mode M0 | |||
|---|---|---|---|
| Quadrant | BADHDUFLAG | Total packets | Discarded packets |
| A | 0 | 21180 | 3 |
| B | 0 | 22748 | 2 |
| C | 0 | 17399 | 2 |
| D | 0 | 23331 | 2 |
| Quadrant | Total seconds | Saturated seconds | Saturation percentage |
|---|---|---|---|
| A | 8448 | 611 | 7.232481% |
| B | 8448 | 447 | 5.291193% |
| C | 8448 | 55 | 0.651042% |
| D | 8448 | 694 | 8.214962% |
Noise dominated data is calculated using 1-second bins in cleaned event files. If a bin has >2000 counts, and if more than 50% of those come from <1% of pixels, then it is considered to be noise-dominated and hence unusable.
| Quadrant | # 1 sec bins | Bins with >0 counts | Bins with >2000 counts | High rate bins dominated by noise | Noise dominated (total time) | Noise dominated (detector-on time) | Marked lightcurve |
|---|---|---|---|---|---|---|---|
| A | 9159 | 8451 | 353 | 353 | 3.85% | 4.18% | 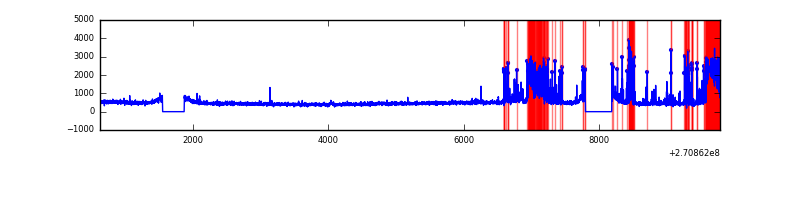 |
| B | 9158 | 8450 | 202 | 202 | 2.21% | 2.39% | 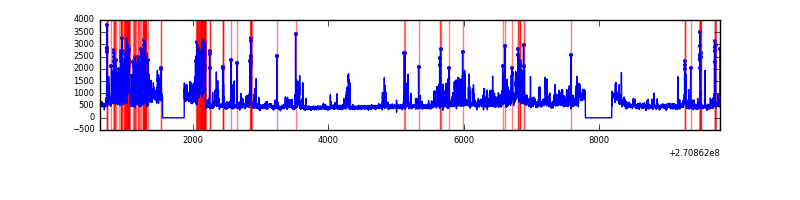 |
| C | 9159 | 8451 | 0 | 0 | 0.00% | 0.00% | 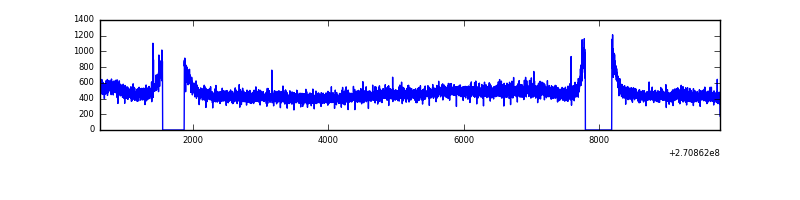 |
| D | 9159 | 8451 | 552 | 552 | 6.03% | 6.53% | 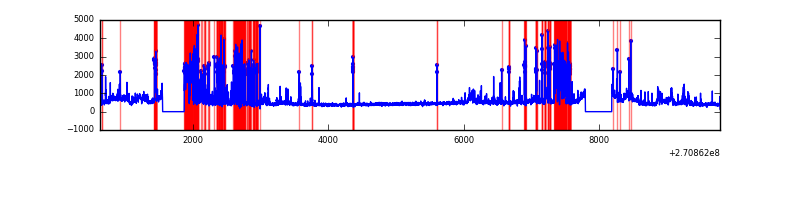 |
Top three noisy pixels from each quadrant. If the there are fewer than three noisy pixels in the level2.evt file, extra rows are filled as -1
| Pixel properties | Quadrant properties | ||||||
|---|---|---|---|---|---|---|---|
| Quadrant | DetID | PixID | Counts | Sigma | Mean | Median | Sigma |
| A | 14 | 238 | 1030564 | 5167.97 | 976 | 954 | 199.2 |
| A | 14 | 237 | 348031 | 1742.1 | 976 | 954 | 199.2 |
| A | 9 | 143 | 18228 | 86.7 | 976 | 954 | 199.2 |
| B | 10 | 16 | 940176 | 4905.3 | 998 | 973 | 191.5 |
| B | 10 | 245 | 285714 | 1487.15 | 998 | 973 | 191.5 |
| B | 8 | 3 | 252104 | 1311.61 | 998 | 973 | 191.5 |
| C | 3 | 233 | 128771 | 562.87 | 974 | 977 | 227.0 |
| C | 8 | 128 | 11237 | 45.19 | 974 | 977 | 227.0 |
| C | 7 | 247 | 7442 | 28.47 | 974 | 977 | 227.0 |
| D | 9 | 68 | 1368478 | 5963.18 | 931 | 901 | 229.3 |
| D | 1 | 255 | 372607 | 1620.79 | 931 | 901 | 229.3 |
| D | 7 | 38 | 178430 | 774.1 | 931 | 901 | 229.3 |
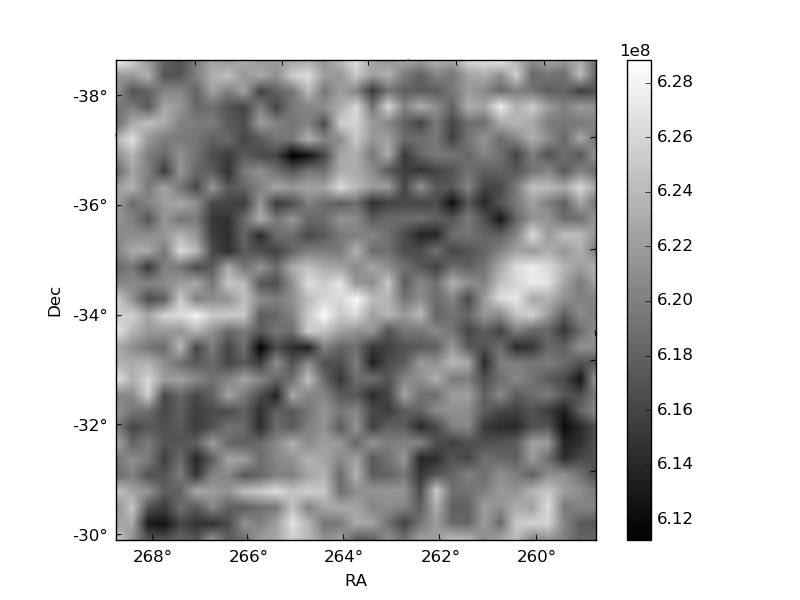
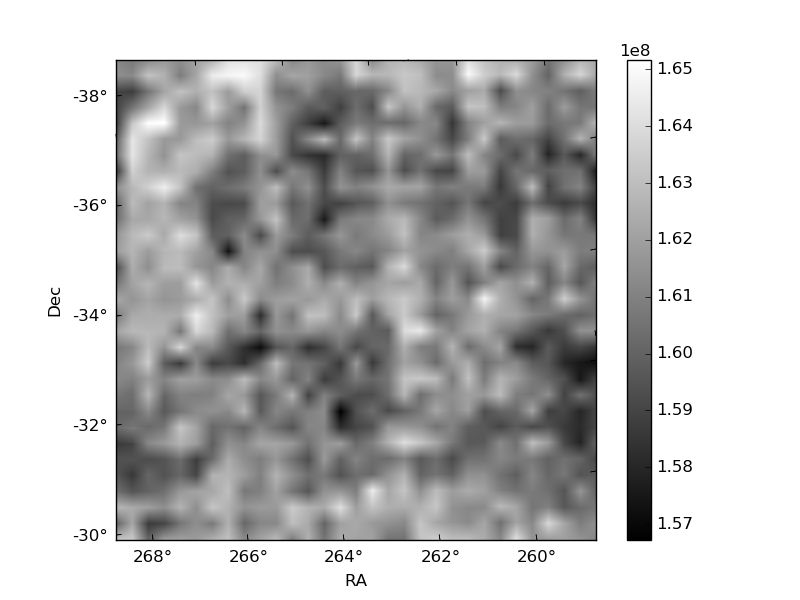
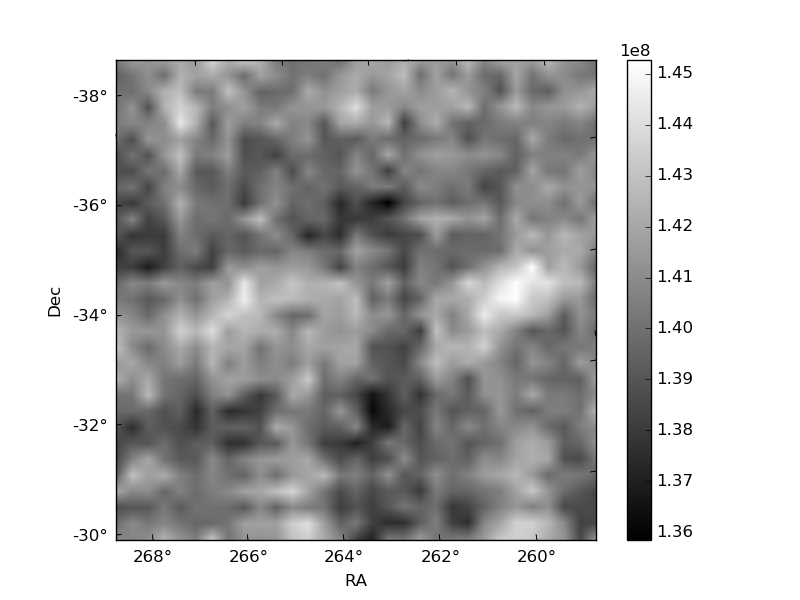
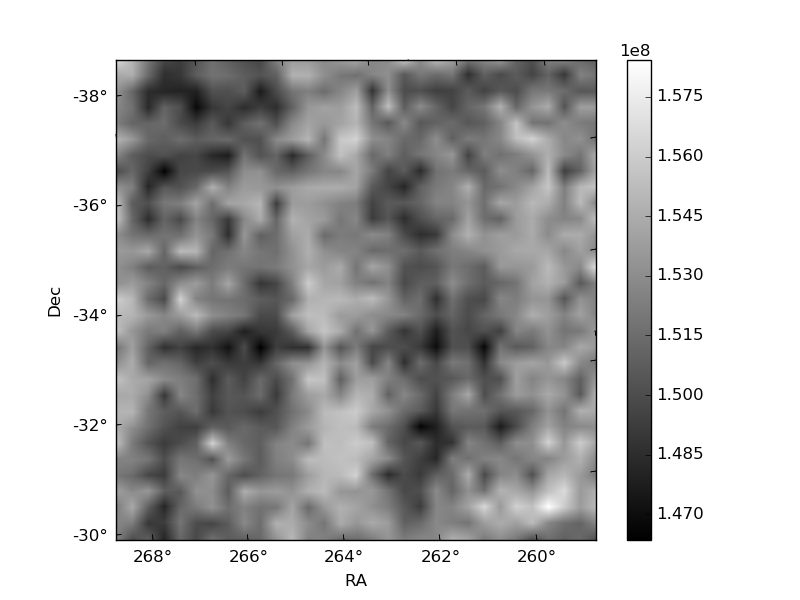
Histogram calculated using DETX and DETY for each event in the final _common_clean file
| Quadrant A | 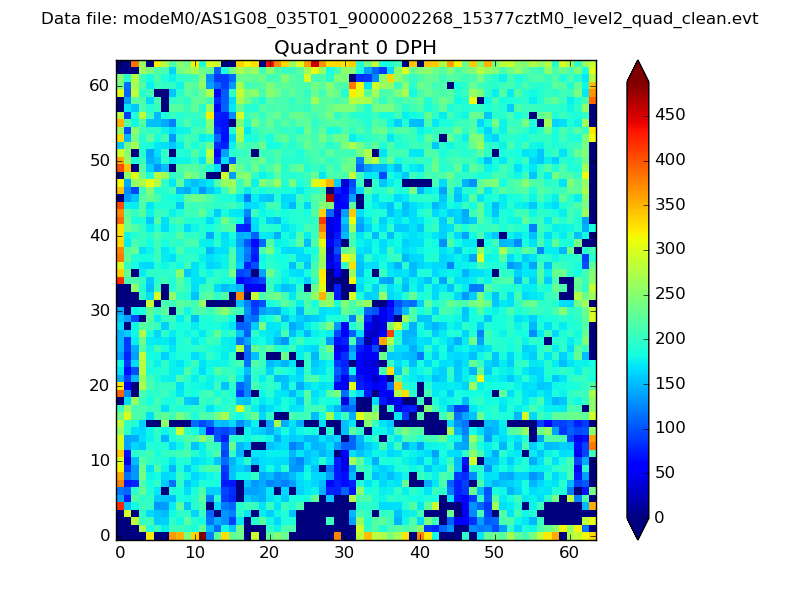 |
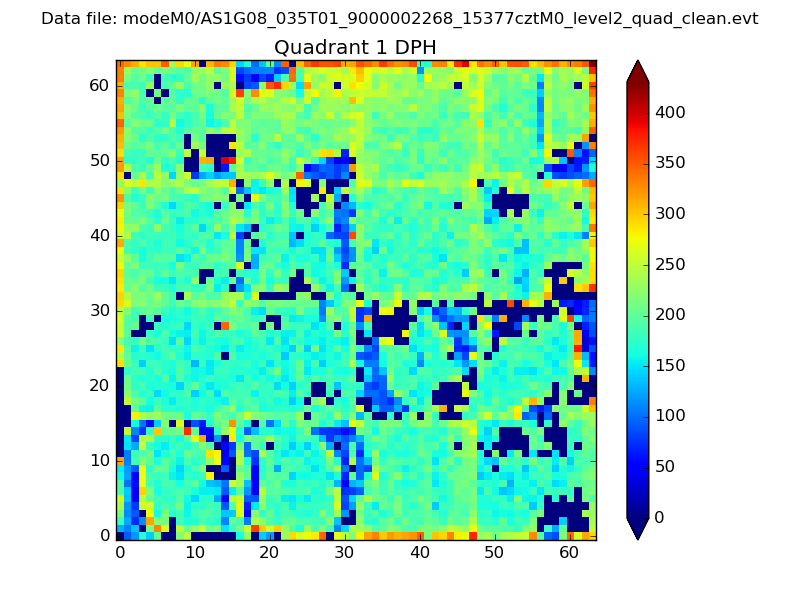 |
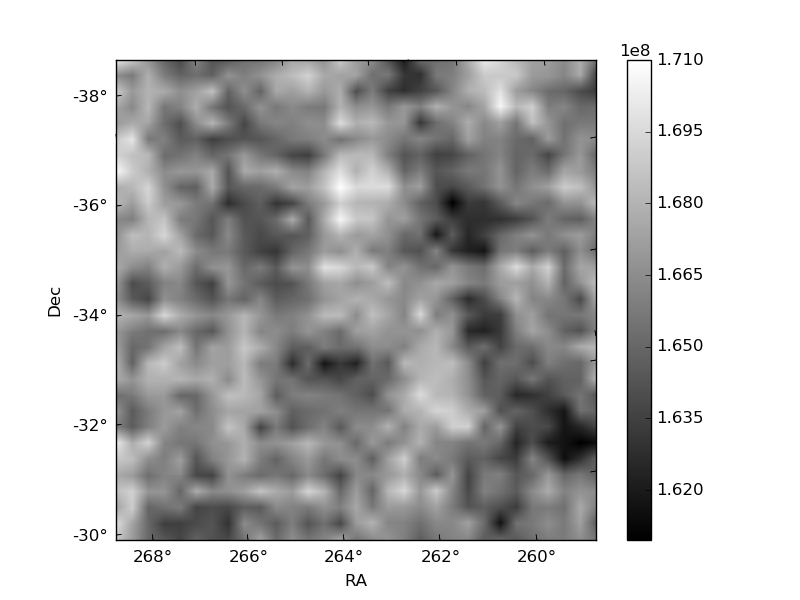
Quadrant B |
|---|---|---|---|
| Quadrant D | 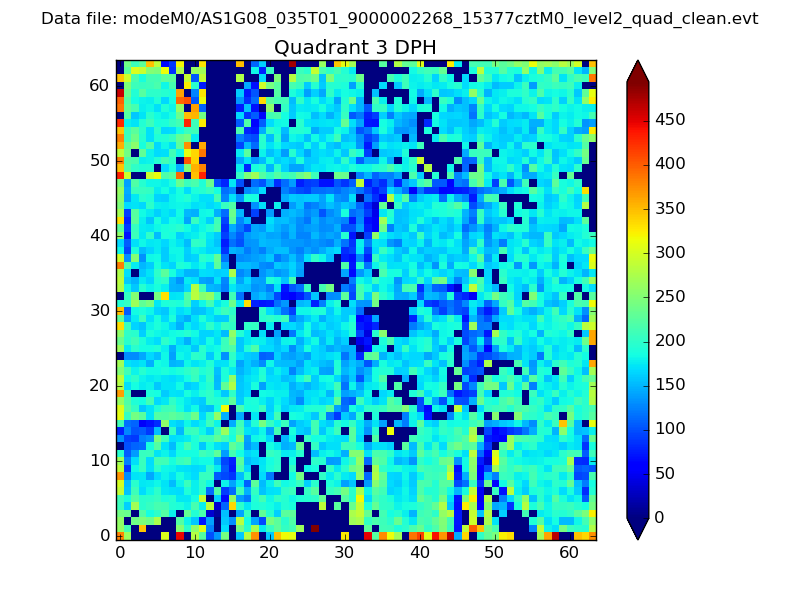 |
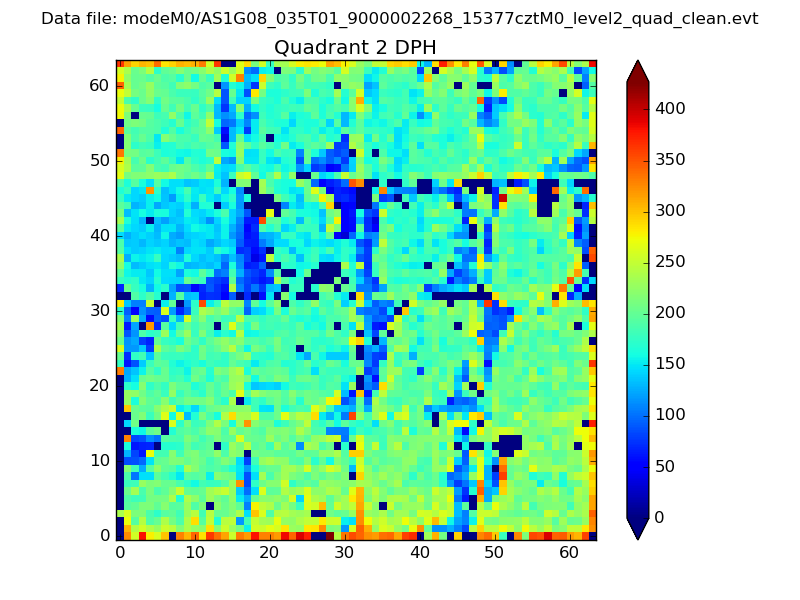 |
Quadrant C |
| Plot type | Count rate plots | Images |
|---|---|---|
| Comparison with Poisson distribution Blue bars denote a histogram of data divided into 1 sec bins. Red curve is a Poisson curve with rate = median count rate of data. |
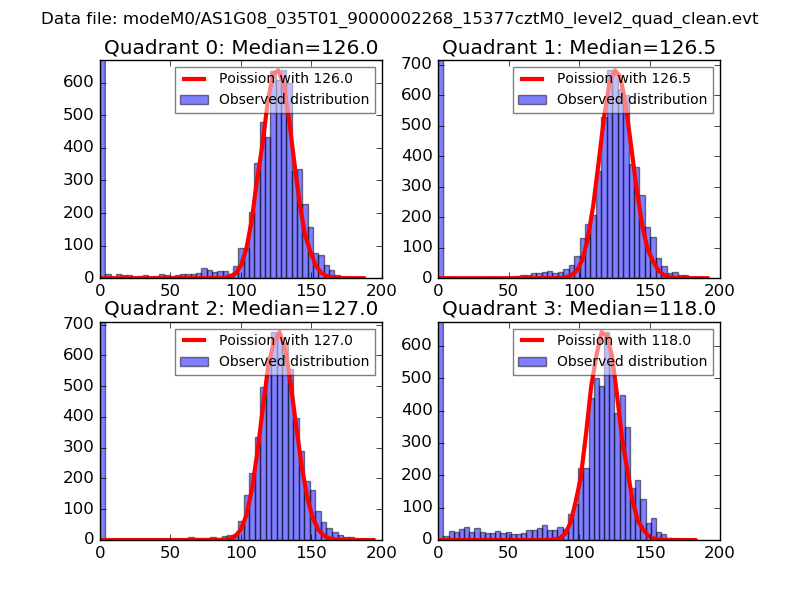 |
 |
| Quadrant-wise count rates Data is divided into 100 sec bins |
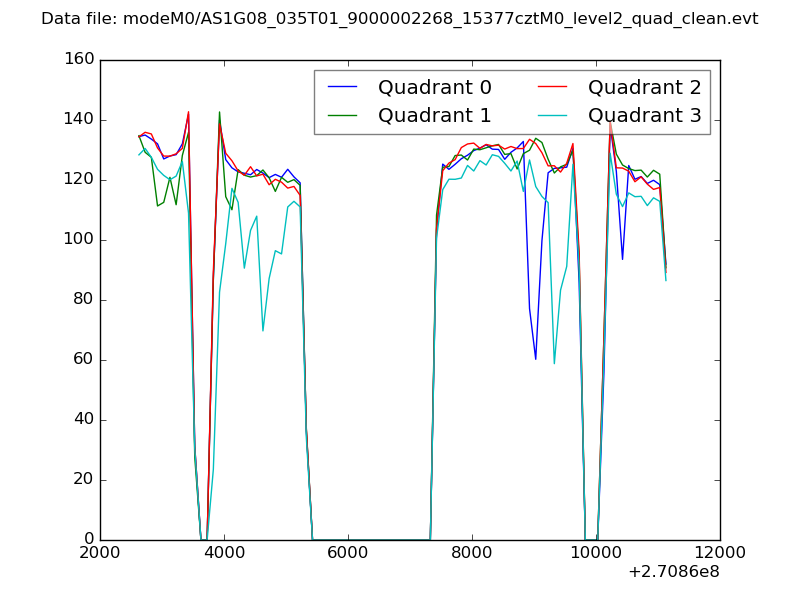 |
|
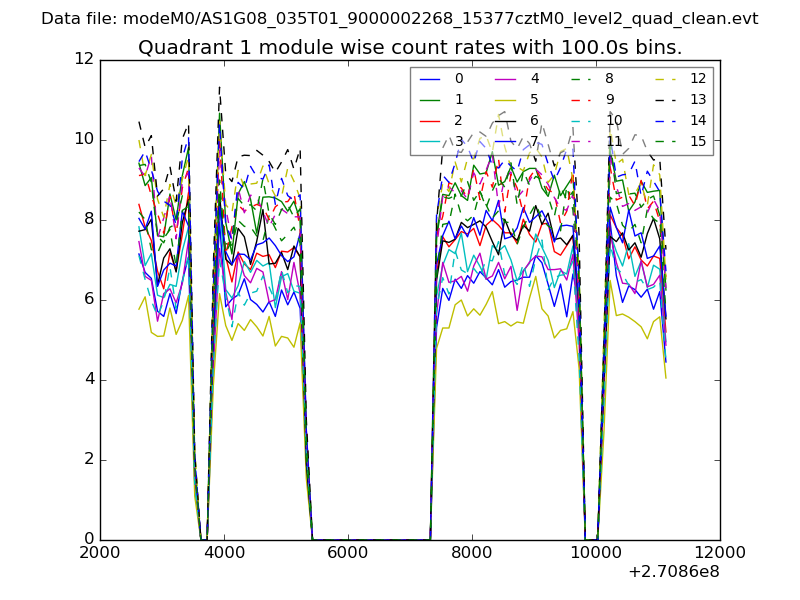
| Module-wise count rates for Quadrant A Data is divided into 100 sec bins |
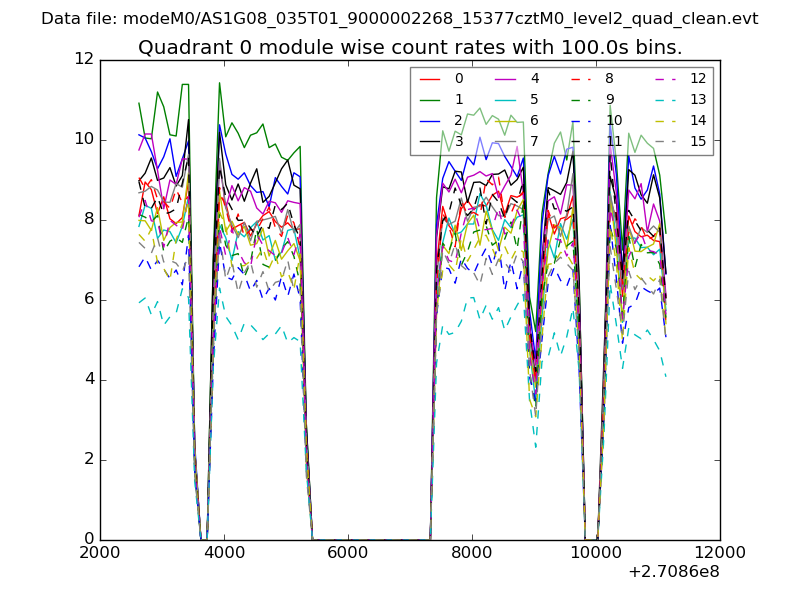 |
 |
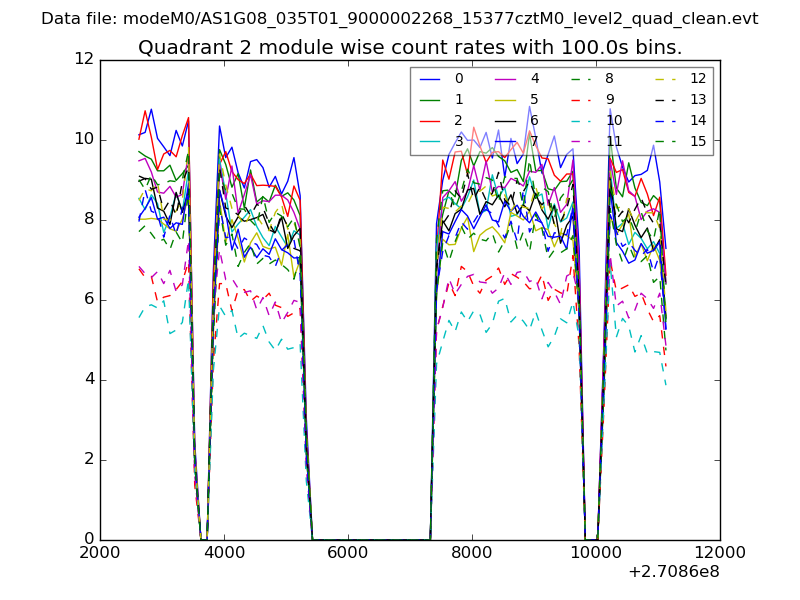
| Module-wise count rates for Quadrant B Data is divided into 100 sec bins |
 |
 |
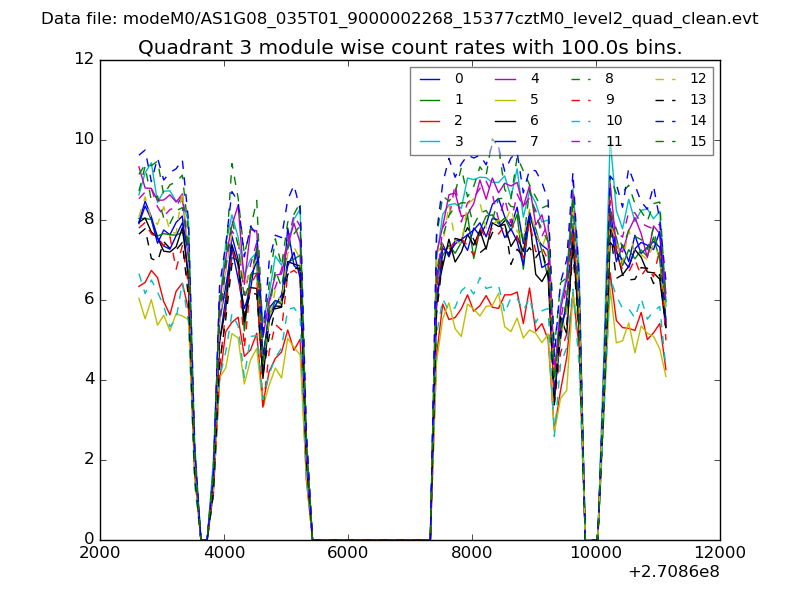
| Module-wise count rates for Quadrant C Data is divided into 100 sec bins |
 |
 |
| Module-wise count rates for Quadrant D Data is divided into 100 sec bins |
 |
 |
| Parameter | Plot |
|---|---|
| CZT HV Monitor | 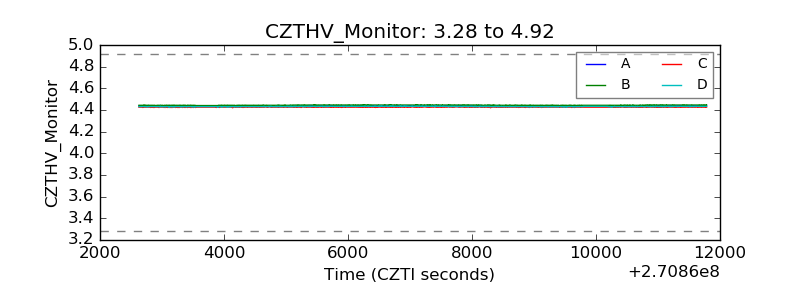 |
| D_VDD | 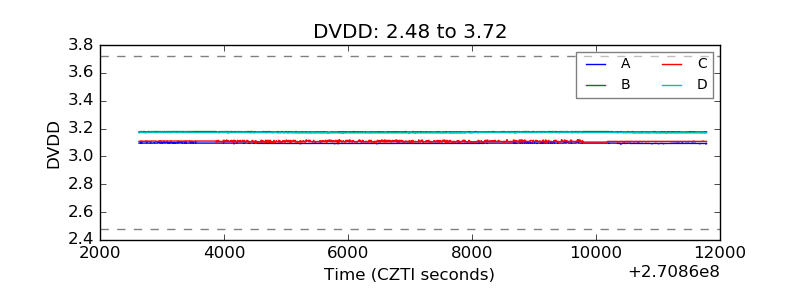 |
| Temperature 1 | 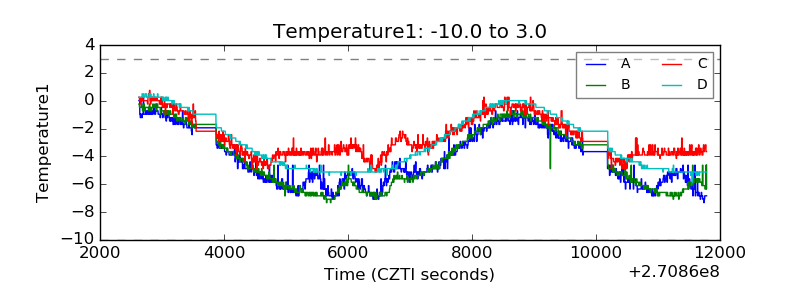 |
| Veto HV Monitor | 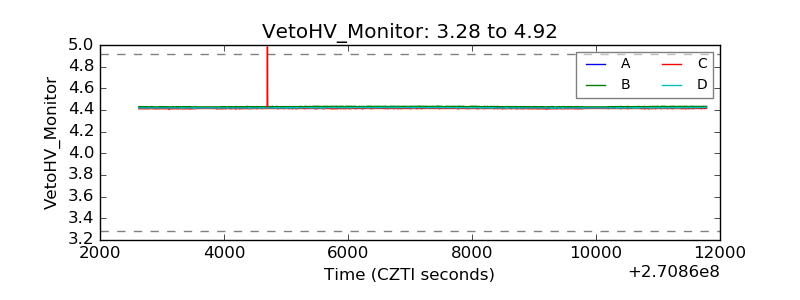 |
| Veto LLD |  |
| Alpha Counter | 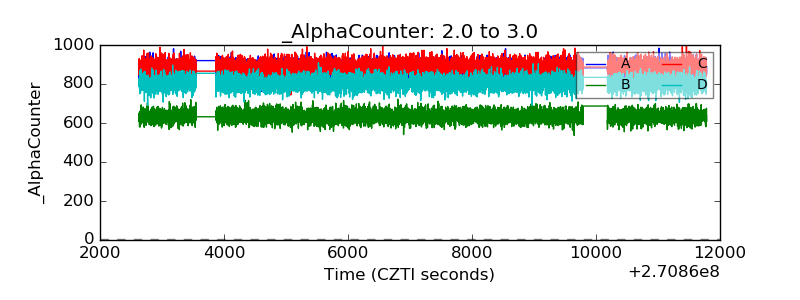 |
| _CPM_Rate | 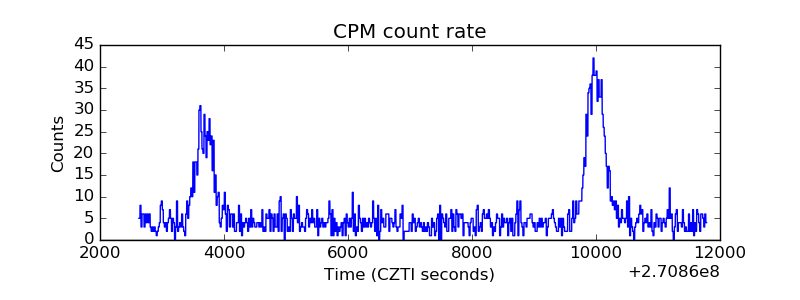 |
| CZT Counter | 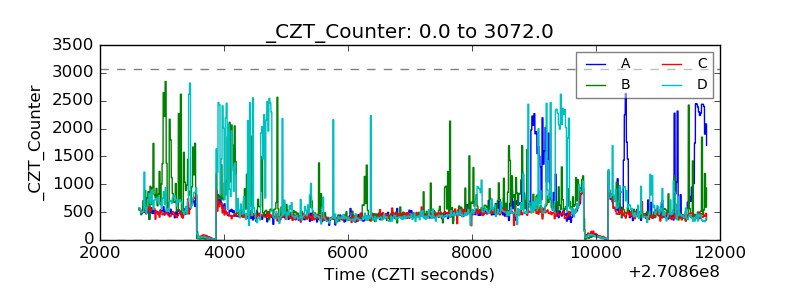 |
| +2.5 Volts monitor |  |
| +5 Volts monitor |  |
| _ROLL_ROT | 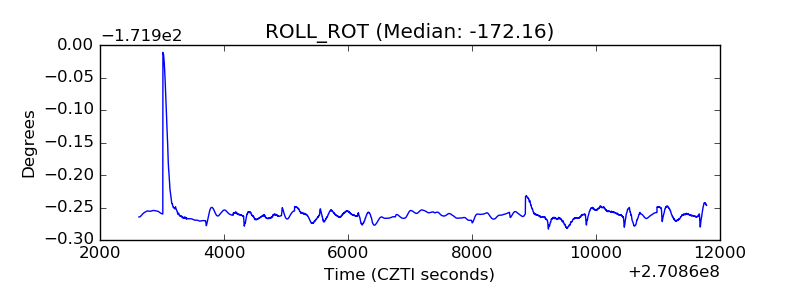 |
| _Roll_DEC | 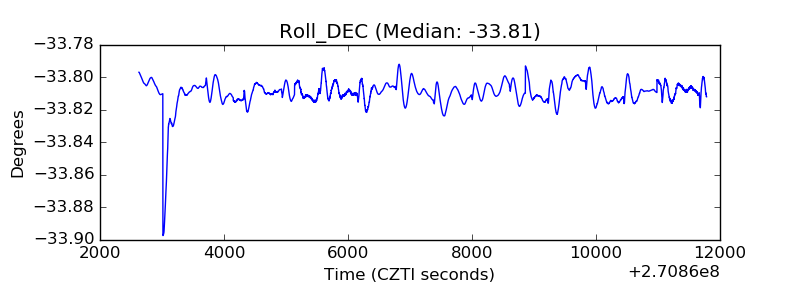 |
| _Roll_RA | 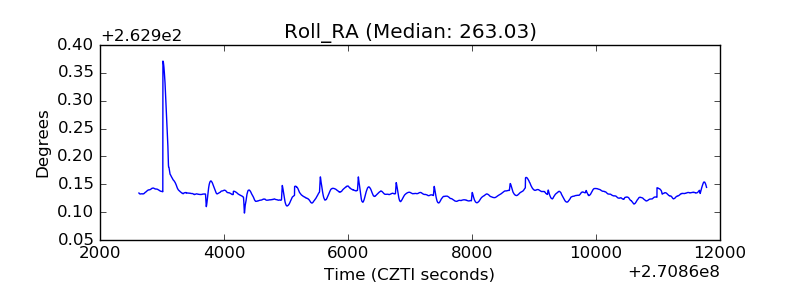 |
| Veto Counter | 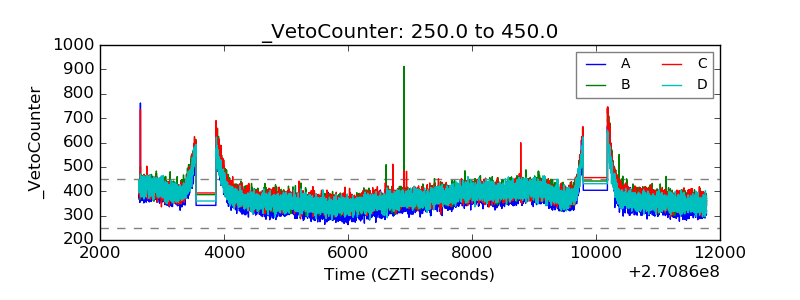 |