| Param | Original file | Final file |
|---|---|---|
| Filename | modeM0/AS1G08_035T01_9000002268_15380cztM0_level2.evt | modeM0/AS1G08_035T01_9000002268_15380cztM0_level2_quad_clean.evt |
| Size (bytes) | 1,141,539,840 | 159,324,480 |
| Size | 1.1 GB | 151.9 MB |
| Events in quadrant A | 10,149,140 | 928,614 |
| Events in quadrant B | 9,056,468 | 980,154 |
| Events in quadrant C | 6,587,334 | 995,013 |
| Events in quadrant D | 7,818,725 | 940,029 |
| Mode SS | |||
|---|---|---|---|
| Quadrant | BADHDUFLAG | Total packets | Discarded packets |
| A | 0 | 286 | 0 |
| B | 0 | 286 | 0 |
| C | 0 | 286 | 0 |
| D | 0 | 286 | 0 |
| Mode M9 | |||
|---|---|---|---|
| Quadrant | BADHDUFLAG | Total packets | Discarded packets |
| A | 0 | 13 | 0 |
| B | 0 | 13 | 0 |
| C | 0 | 13 | 0 |
| D | 0 | 13 | 0 |
| Mode M0 | |||
|---|---|---|---|
| Quadrant | BADHDUFLAG | Total packets | Discarded packets |
| A | 0 | 39719 | 2 |
| B | 0 | 36172 | 2 |
| C | 0 | 28780 | 2 |
| D | 0 | 33147 | 2 |
| Quadrant | Total seconds | Saturated seconds | Saturation percentage |
|---|---|---|---|
| A | 14211 | 1495 | 10.520020% |
| B | 14211 | 604 | 4.250229% |
| C | 14211 | 57 | 0.401098% |
| D | 14211 | 223 | 1.569207% |
Noise dominated data is calculated using 1-second bins in cleaned event files. If a bin has >2000 counts, and if more than 50% of those come from <1% of pixels, then it is considered to be noise-dominated and hence unusable.
| Quadrant | # 1 sec bins | Bins with >0 counts | Bins with >2000 counts | High rate bins dominated by noise | Noise dominated (total time) | Noise dominated (detector-on time) | Marked lightcurve |
|---|---|---|---|---|---|---|---|
| A | 15477 | 14213 | 916 | 916 | 5.92% | 6.44% | 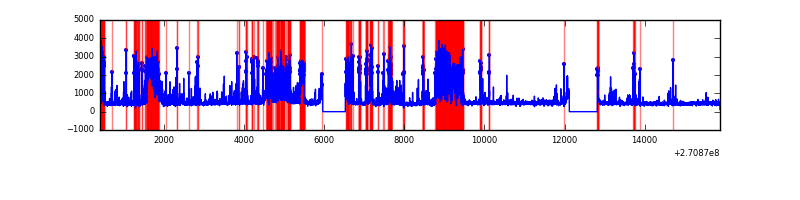 |
| B | 15477 | 14213 | 386 | 386 | 2.49% | 2.72% | 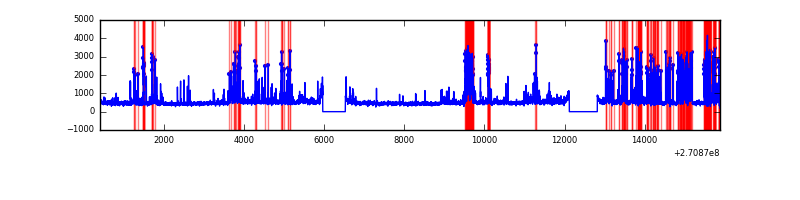 |
| C | 15477 | 14214 | 0 | 0 | 0.00% | 0.00% | 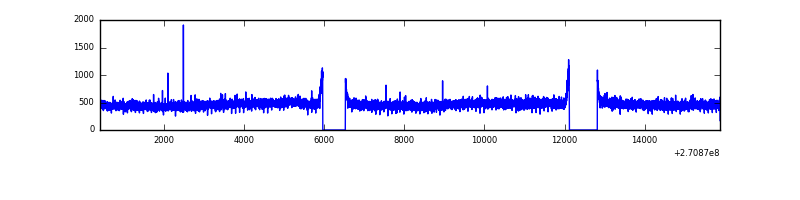 |
| D | 15477 | 14213 | 175 | 175 | 1.13% | 1.23% | 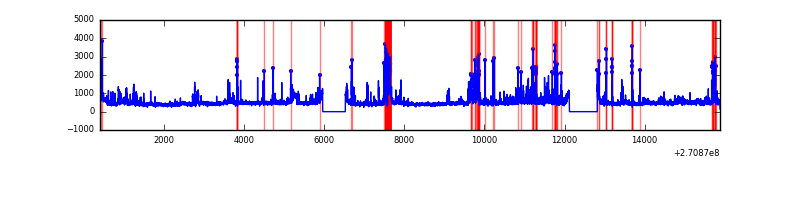 |
Top three noisy pixels from each quadrant. If the there are fewer than three noisy pixels in the level2.evt file, extra rows are filled as -1
| Pixel properties | Quadrant properties | ||||||
|---|---|---|---|---|---|---|---|
| Quadrant | DetID | PixID | Counts | Sigma | Mean | Median | Sigma |
| A | 14 | 238 | 3411815 | 10707.15 | 1567 | 1530 | 318.5 |
| A | 14 | 237 | 636087 | 1992.3 | 1567 | 1530 | 318.5 |
| A | 9 | 143 | 52105 | 158.79 | 1567 | 1530 | 318.5 |
| B | 10 | 245 | 1302788 | 4194.21 | 1633 | 1589 | 310.2 |
| B | 10 | 16 | 924654 | 2975.36 | 1633 | 1589 | 310.2 |
| B | 0 | 229 | 118882 | 378.08 | 1633 | 1589 | 310.2 |
| C | 3 | 233 | 326310 | 876.21 | 1605 | 1611 | 370.6 |
| C | 13 | 61 | 11547 | 26.81 | 1605 | 1611 | 370.6 |
| C | 7 | 247 | 4559 | 7.96 | 1605 | 1611 | 370.6 |
| D | 2 | 33 | 465662 | 1189.66 | 1594 | 1544 | 390.1 |
| D | 5 | 222 | 387398 | 989.05 | 1594 | 1544 | 390.1 |
| D | 1 | 255 | 336852 | 859.48 | 1594 | 1544 | 390.1 |
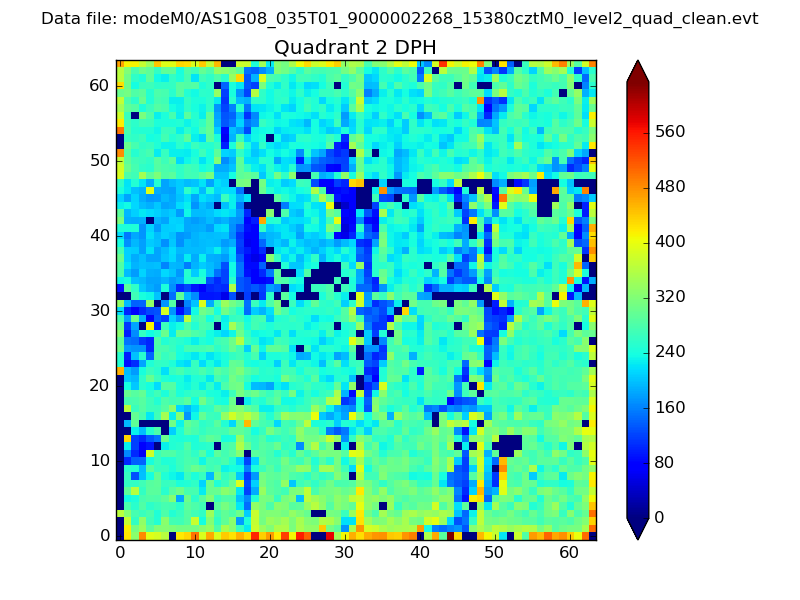
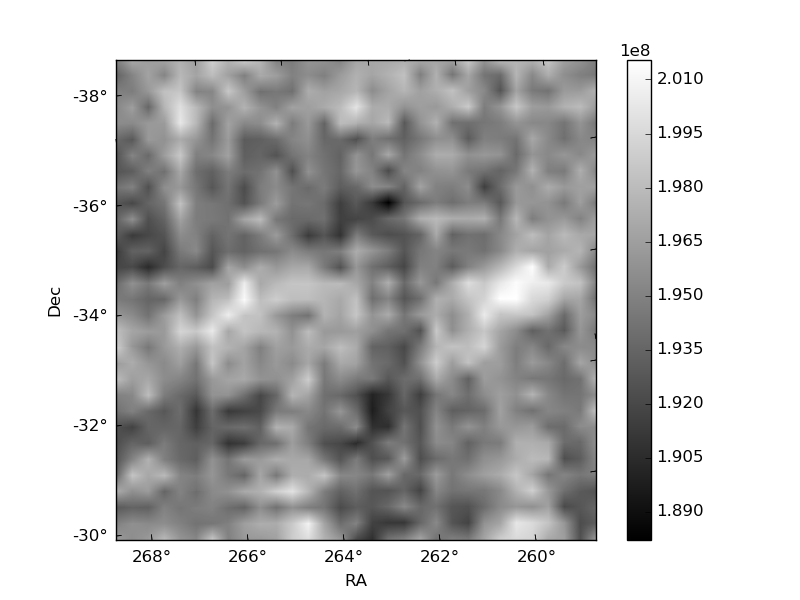
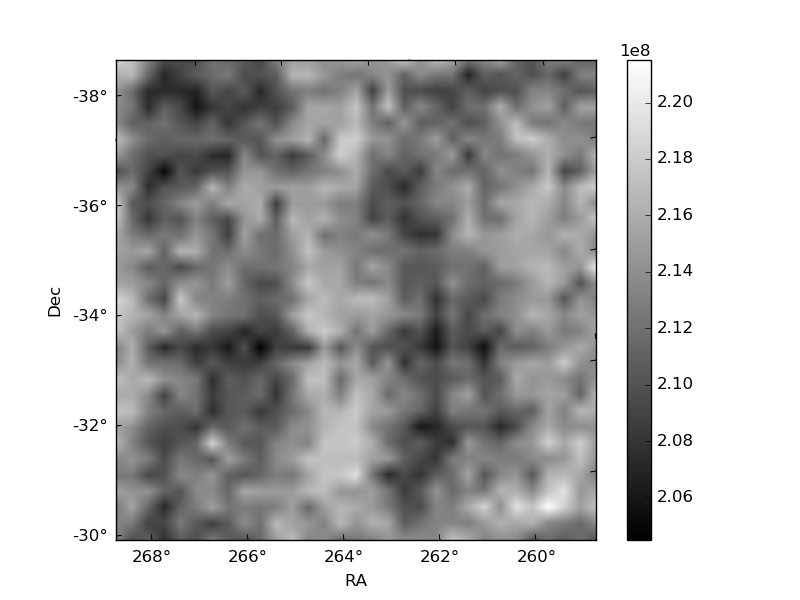
Histogram calculated using DETX and DETY for each event in the final _common_clean file
| Quadrant A | 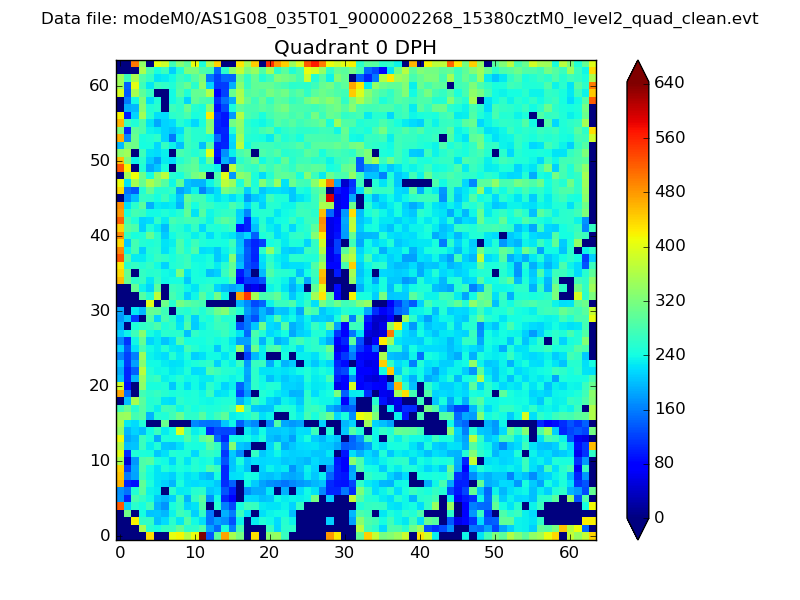 |
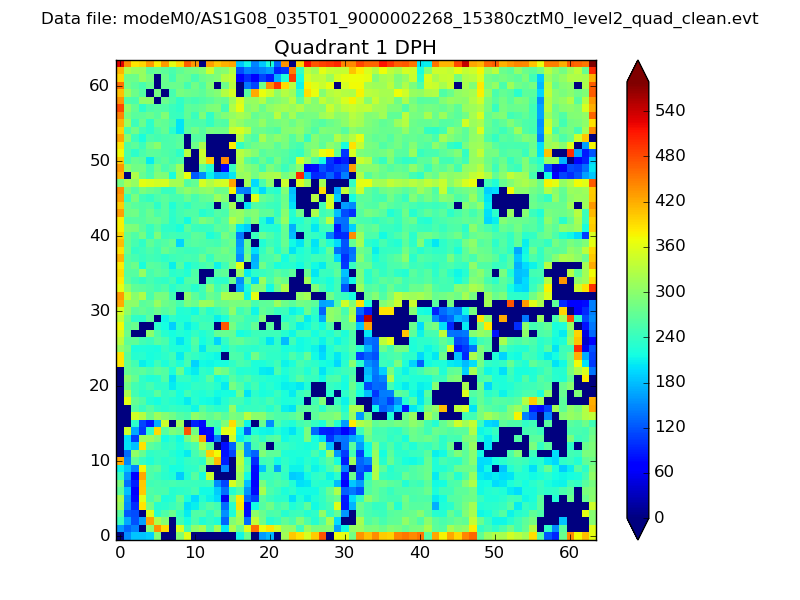 |
Quadrant B |
|---|---|---|---|
| Quadrant D | 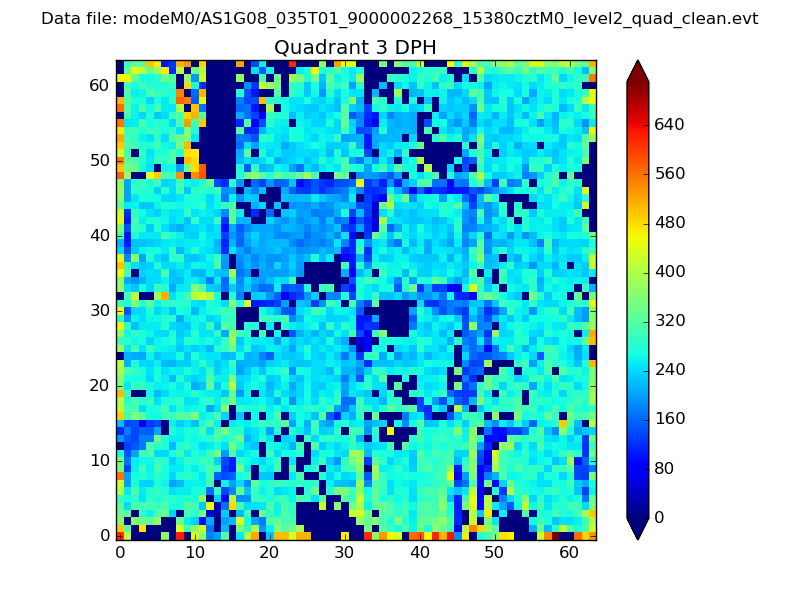 |
 |
Quadrant C |
| Plot type | Count rate plots | Images |
|---|---|---|
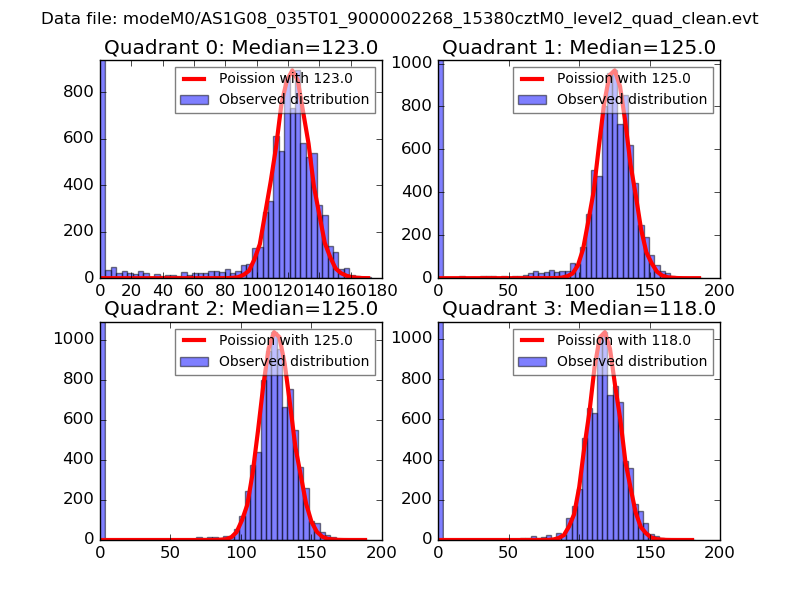
| Comparison with Poisson distribution Blue bars denote a histogram of data divided into 1 sec bins. Red curve is a Poisson curve with rate = median count rate of data. |
 |
 |
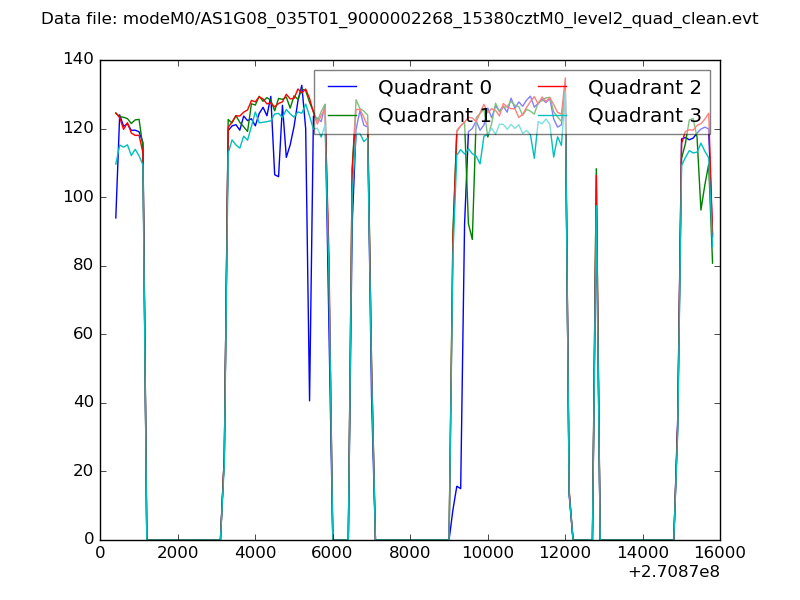
| Quadrant-wise count rates Data is divided into 100 sec bins |
 |
|
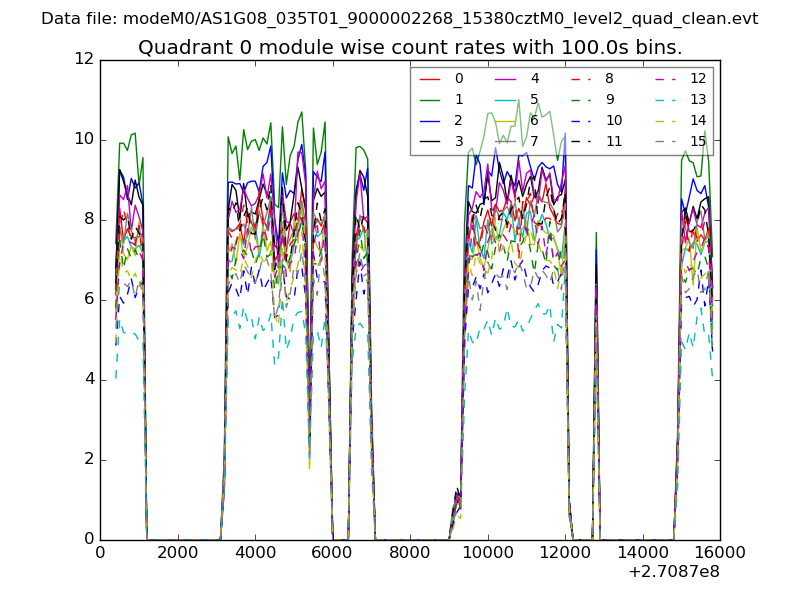
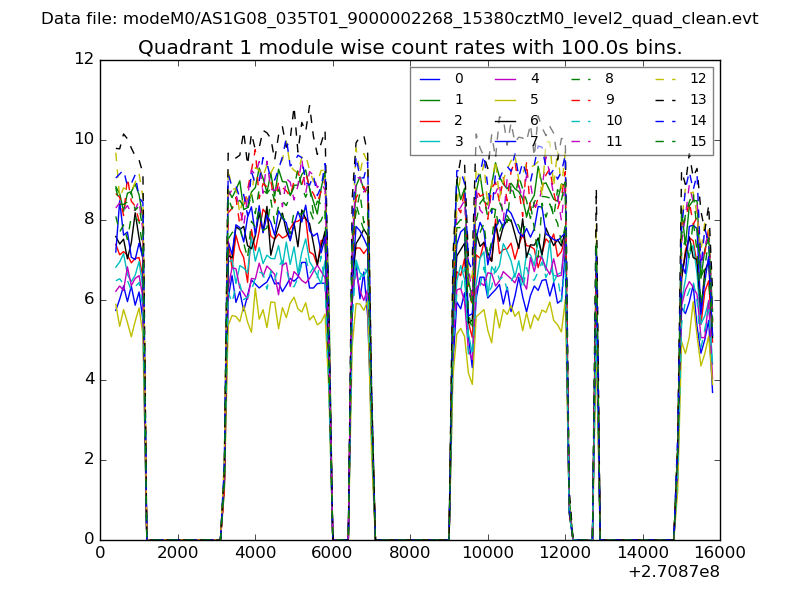
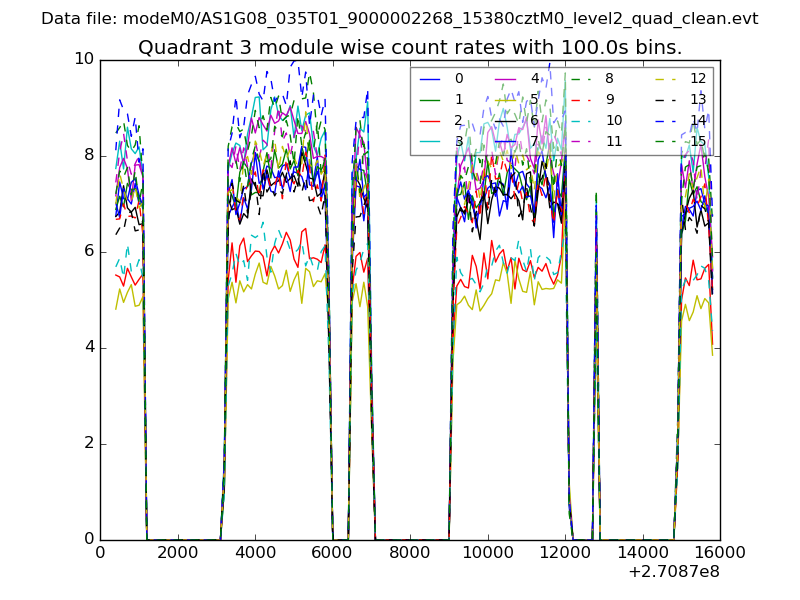
| Module-wise count rates for Quadrant A Data is divided into 100 sec bins |
 |
 |
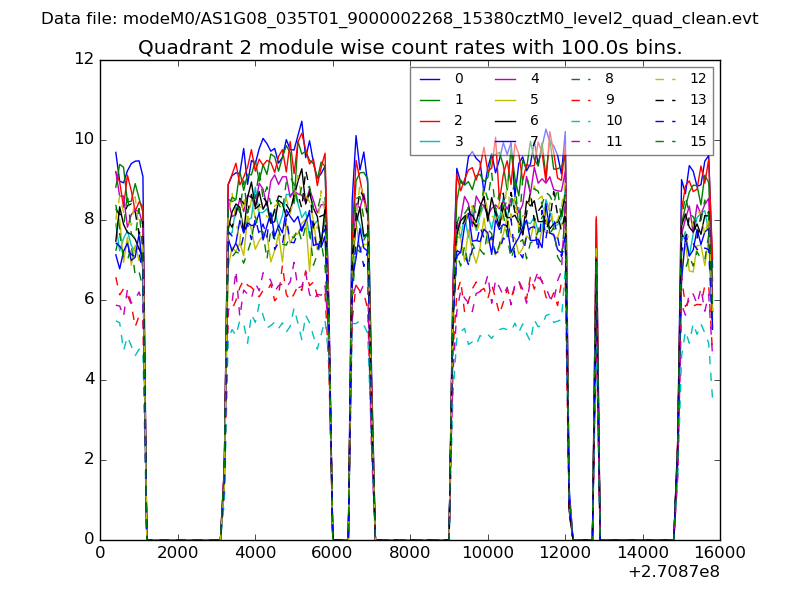
| Module-wise count rates for Quadrant B Data is divided into 100 sec bins |
 |
 |
| Module-wise count rates for Quadrant C Data is divided into 100 sec bins |
 |
 |
| Module-wise count rates for Quadrant D Data is divided into 100 sec bins |
 |
 |
| Parameter | Plot |
|---|---|
| CZT HV Monitor | 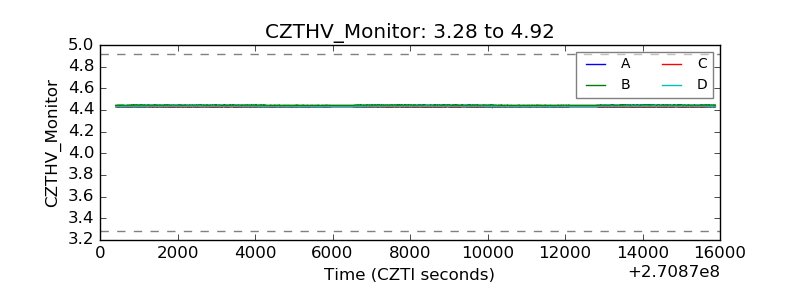 |
| D_VDD | 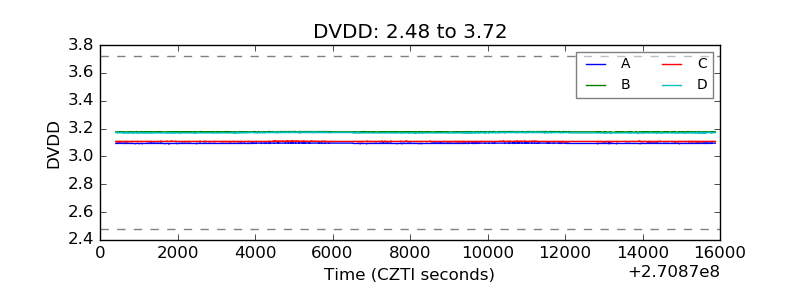 |
| Temperature 1 |  |
| Veto HV Monitor | 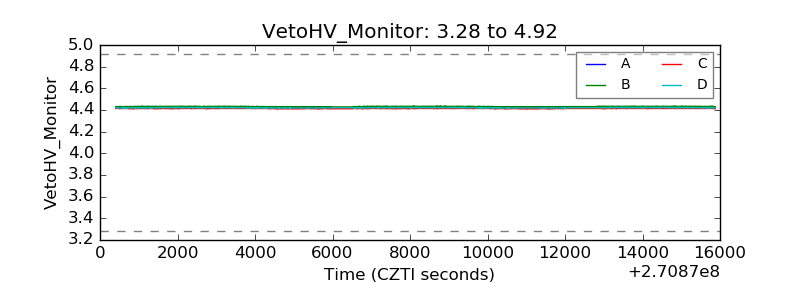 |
| Veto LLD |  |
| Alpha Counter | 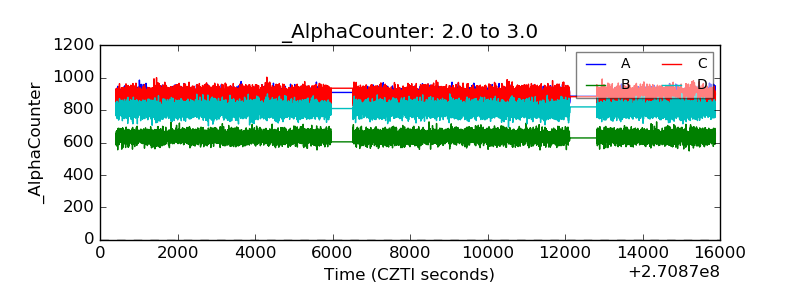 |
| _CPM_Rate | 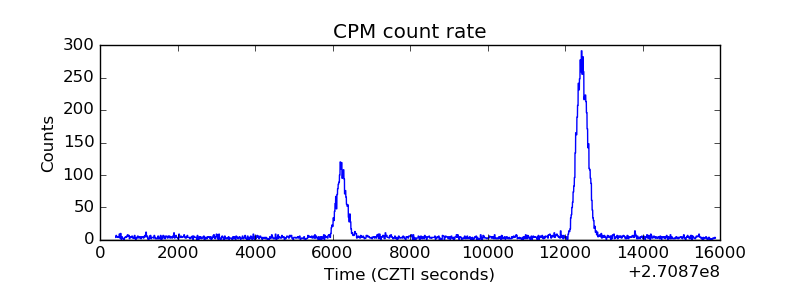 |
| CZT Counter | 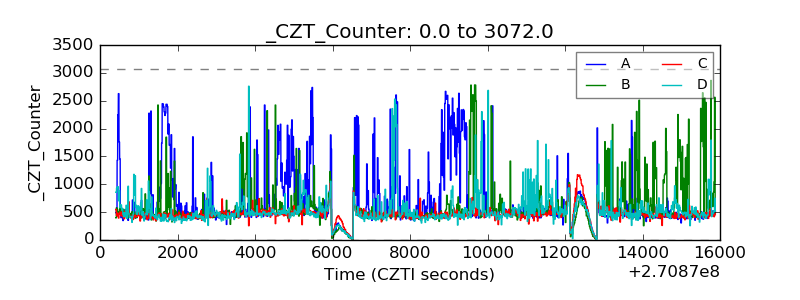 |
| +2.5 Volts monitor | 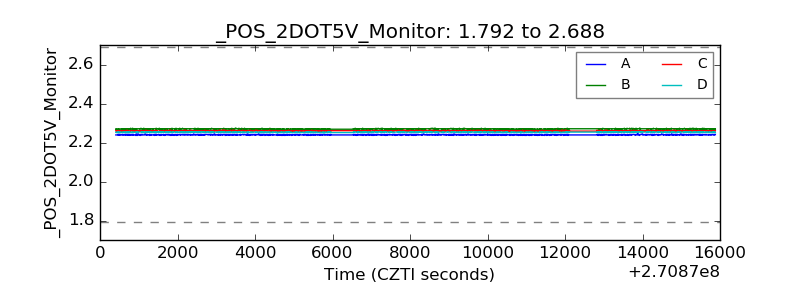 |
| +5 Volts monitor |  |
| _ROLL_ROT | 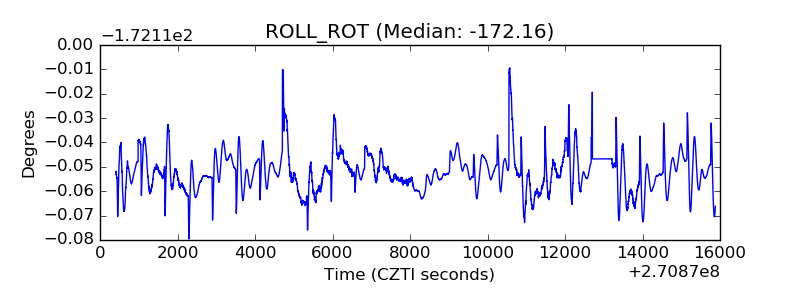 |
| _Roll_DEC | 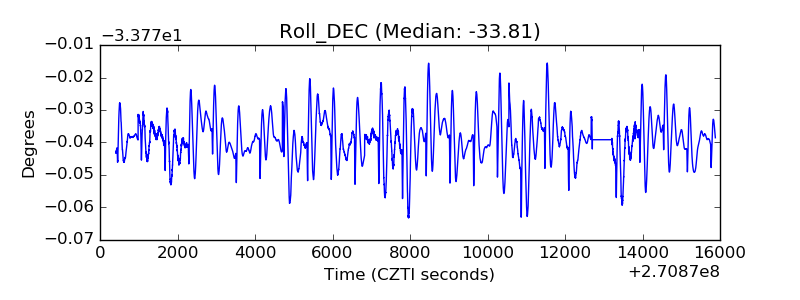 |
| _Roll_RA | 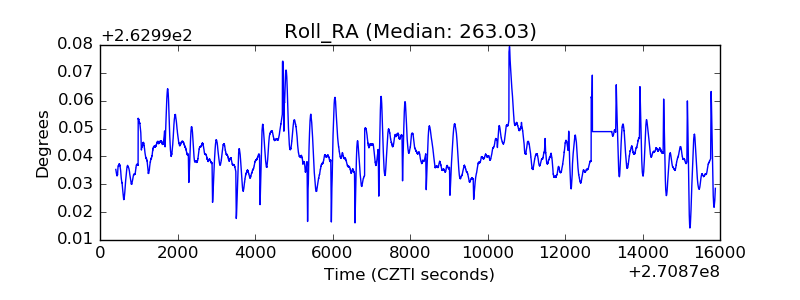 |
| Veto Counter | 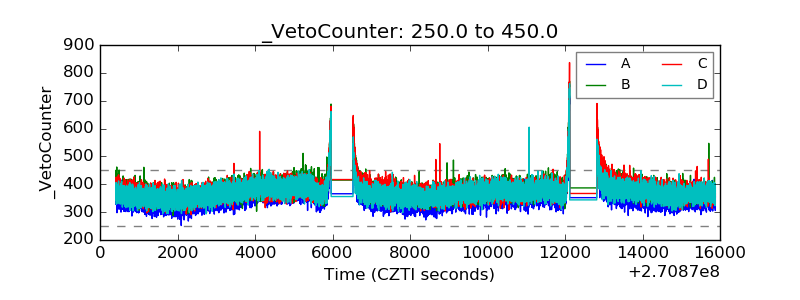 |