| Param | Original file | Final file |
|---|---|---|
| Filename | modeM0/AS1G08_037T01_9000002264cztM0_level2.fits | modeM0/AS1G08_037T01_9000002264cztM0_level2_quad_clean.evt |
| Size (bytes) | 321,926,400 | 300,441,600 |
| Size | 307.0 MB | 286.5 MB |
| Events in quadrant A | 2,028,762 | 1,831,785 |
| Events in quadrant B | 1,914,172 | 1,823,734 |
| Events in quadrant C | 1,950,834 | 1,725,418 |
| Events in quadrant D | 1,670,034 | 1,532,223 |
| Mode M9 | |||
|---|---|---|---|
| Quadrant | BADHDUFLAG | Total packets | Discarded packets |
| A | 0 | 76 | 0 |
| B | 0 | 76 | 0 |
| C | 0 | 76 | 0 |
| D | 0 | 76 | 0 |
| Mode M0 | |||
|---|---|---|---|
| Quadrant | BADHDUFLAG | Total packets | Discarded packets |
| A | 0 | 67467 | 0 |
| B | 0 | 70507 | 0 |
| C | 0 | 71796 | 0 |
| D | 0 | 82674 | 0 |
| Mode SS | |||
|---|---|---|---|
| Quadrant | BADHDUFLAG | Total packets | Discarded packets |
| A | 0 | 650 | 0 |
| B | 0 | 650 | 0 |
| C | 0 | 650 | 0 |
| D | 0 | 650 | 0 |
| Quadrant | Total seconds | Saturated seconds | Saturation percentage |
|---|---|---|---|
| A | 31801 | 492 | 1.547121% |
| B | 31801 | 692 | 2.176032% |
| C | 31801 | 415 | 1.304990% |
| D | 31801 | 1978 | 6.219930% |
Noise dominated data is calculated using 1-second bins in cleaned event files. If a bin has >2000 counts, and if more than 50% of those come from <1% of pixels, then it is considered to be noise-dominated and hence unusable.
| Quadrant | # 1 sec bins | Bins with >0 counts | Bins with >2000 counts | High rate bins dominated by noise | Noise dominated (total time) | Noise dominated (detector-on time) | Marked lightcurve |
|---|---|---|---|---|---|---|---|
| A | 39416 | 31795 | 0 | 0 | 0.00% | 0.00% | 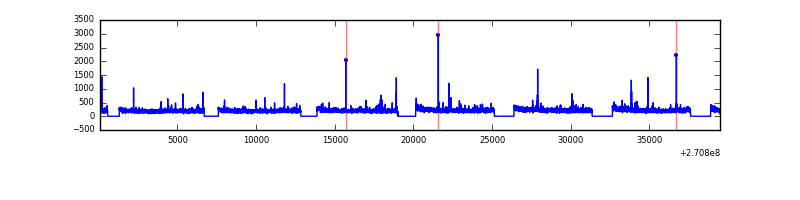 |
| B | 39416 | 31796 | 0 | 0 | 0.00% | 0.00% | 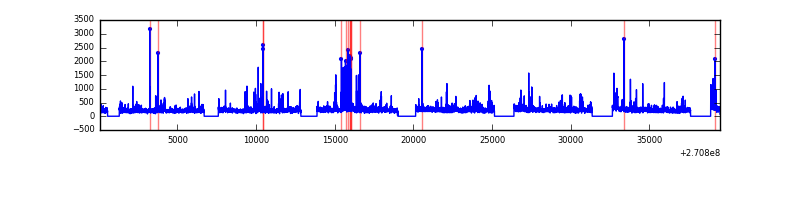 |
| C | 39416 | 31794 | 0 | 0 | 0.00% | 0.00% |  |
| D | 39416 | 31789 | 0 | 0 | 0.00% | 0.00% |  |
Top three noisy pixels from each quadrant. If the there are fewer than three noisy pixels in the level2.evt file, extra rows are filled as -1
| Pixel properties | Quadrant properties | ||||||
|---|---|---|---|---|---|---|---|
| Quadrant | DetID | PixID | Counts | Sigma | Mean | Median | Sigma |
| A | 0 | 29 | 1946 | 11.17 | 527 | 496 | 129.9 |
| A | 7 | 110 | 1663 | 8.99 | 527 | 496 | 129.9 |
| A | 0 | 30 | 1542 | 8.06 | 527 | 496 | 129.9 |
| B | 2 | 9 | 1589 | 11.05 | 506 | 486 | 99.8 |
| B | 2 | 8 | 1304 | 8.2 | 506 | 486 | 99.8 |
| B | 5 | 128 | 1298 | 8.14 | 506 | 486 | 99.8 |
| C | 12 | 241 | 1321 | 6.25 | 516 | 480 | 134.6 |
| C | 2 | 191 | 1299 | 6.08 | 516 | 480 | 134.6 |
| C | 9 | 188 | 1271 | 5.87 | 516 | 480 | 134.6 |
| D | 6 | 231 | 1270 | 6.52 | 477 | 435 | 128.0 |
| D | 7 | 3 | 1164 | 5.7 | 477 | 435 | 128.0 |
| D | 6 | 67 | 1164 | 5.7 | 477 | 435 | 128.0 |
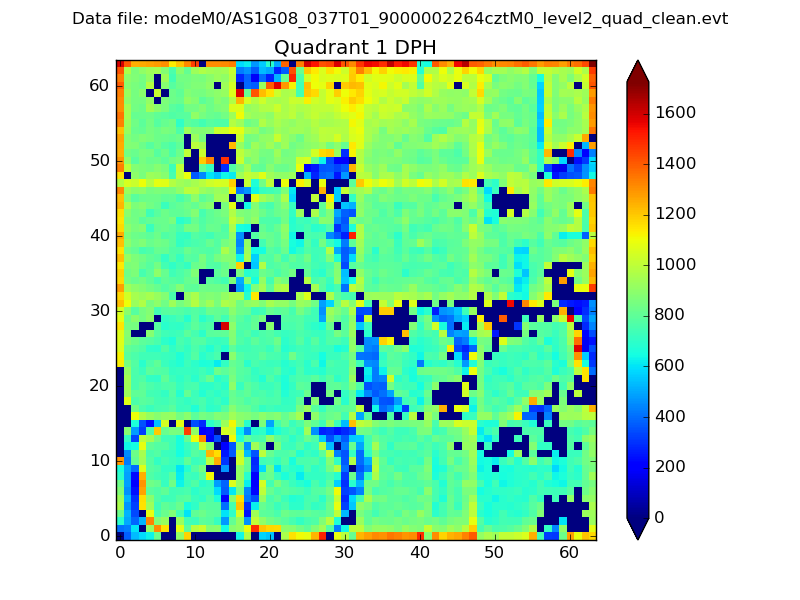
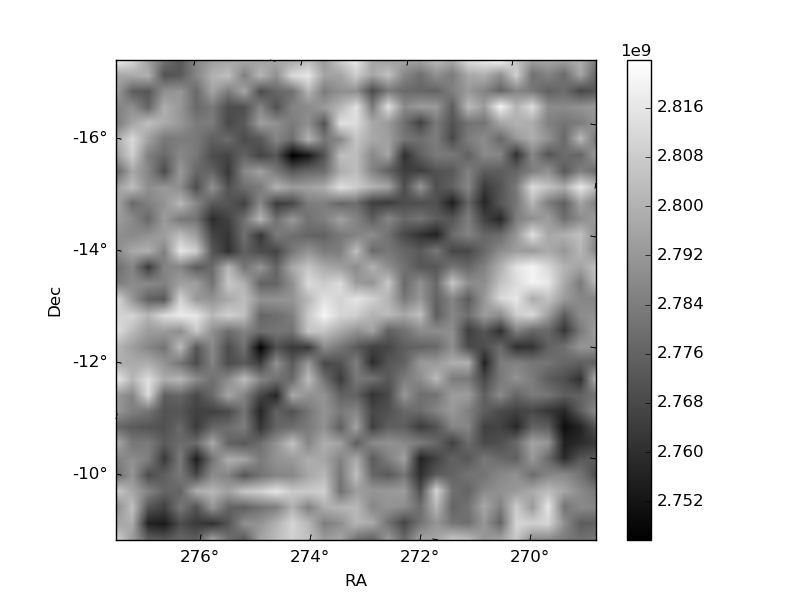
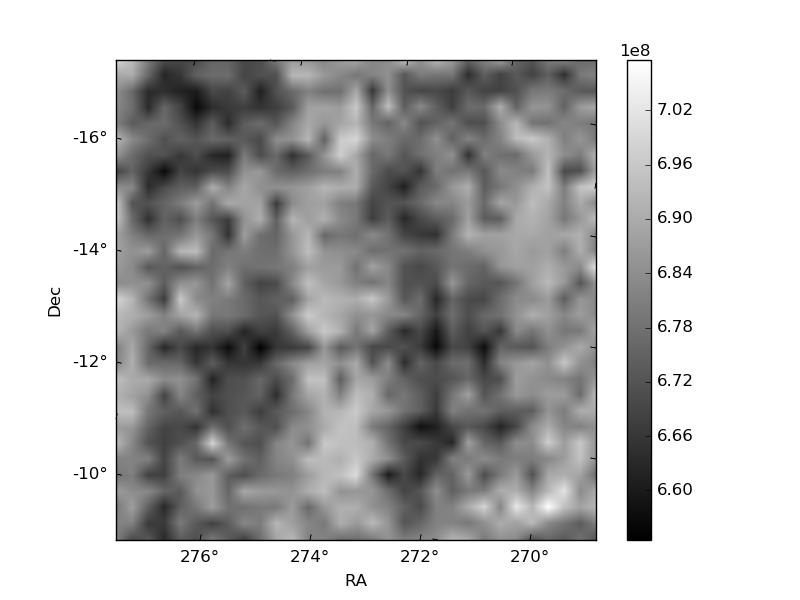
Histogram calculated using DETX and DETY for each event in the final _common_clean file
| Quadrant A |  |
 |
Quadrant B |
|---|---|---|---|
| Quadrant D | 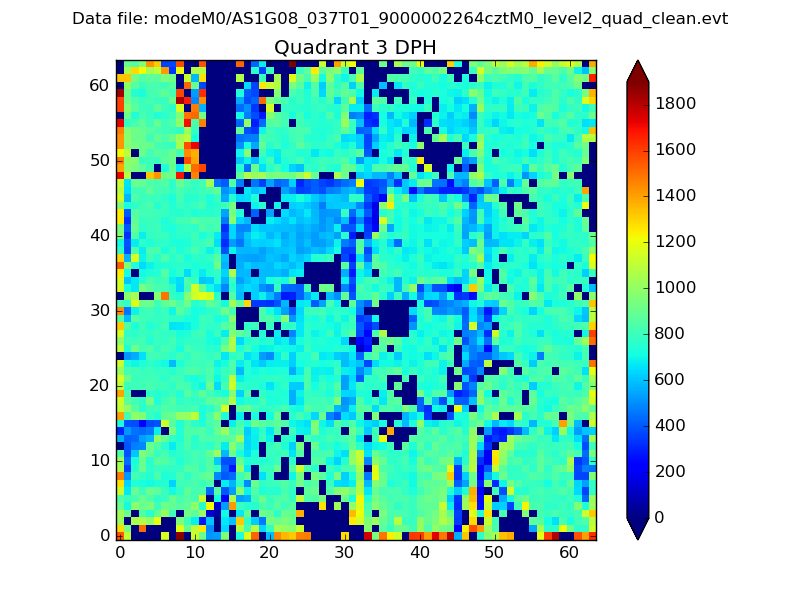 |
 |
Quadrant C |
| Plot type | Count rate plots | Images |
|---|---|---|
| Comparison with Poisson distribution Blue bars denote a histogram of data divided into 1 sec bins. Red curve is a Poisson curve with rate = median count rate of data. |
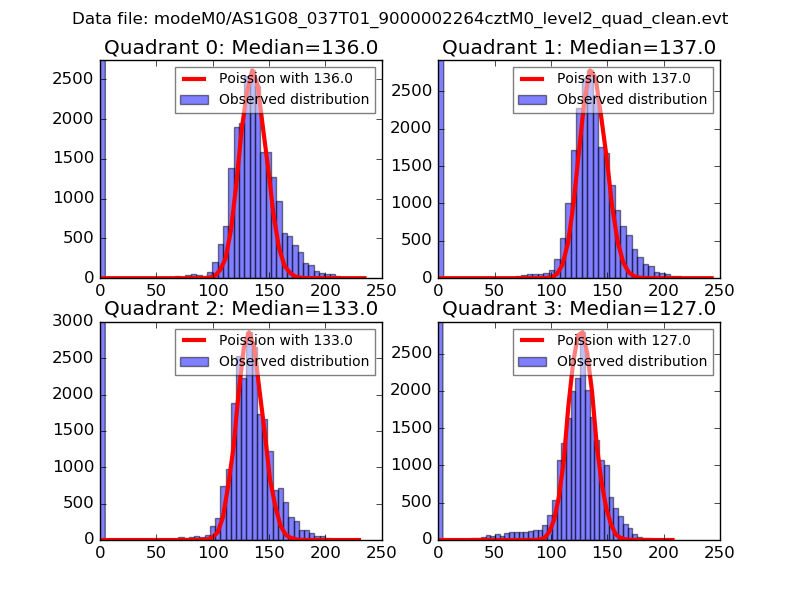 |
 |
| Quadrant-wise count rates Data is divided into 100 sec bins |
 |
|
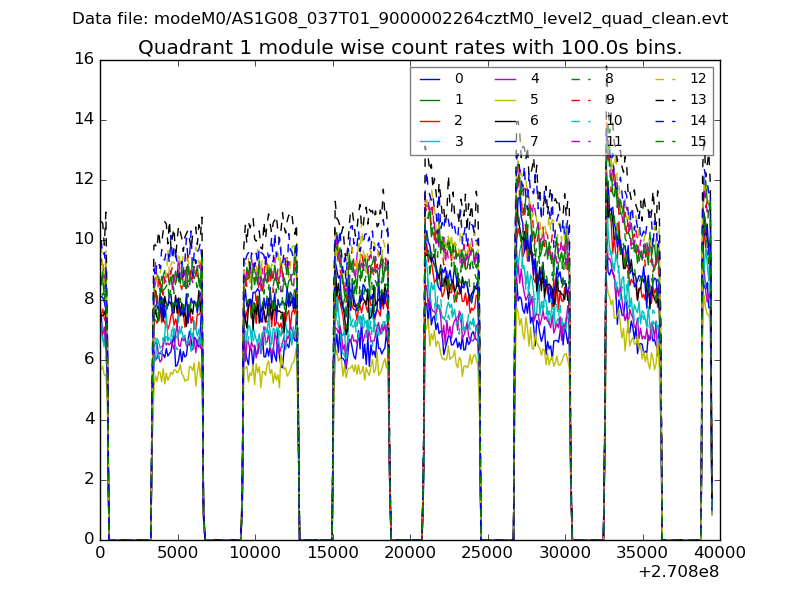
| Module-wise count rates for Quadrant A Data is divided into 100 sec bins |
 |
 |
| Module-wise count rates for Quadrant B Data is divided into 100 sec bins |
 |
 |
| Module-wise count rates for Quadrant C Data is divided into 100 sec bins |
 |
 |
| Module-wise count rates for Quadrant D Data is divided into 100 sec bins |
 |
 |
| Parameter | Plot |
|---|---|
| CZT HV Monitor |  |
| D_VDD | 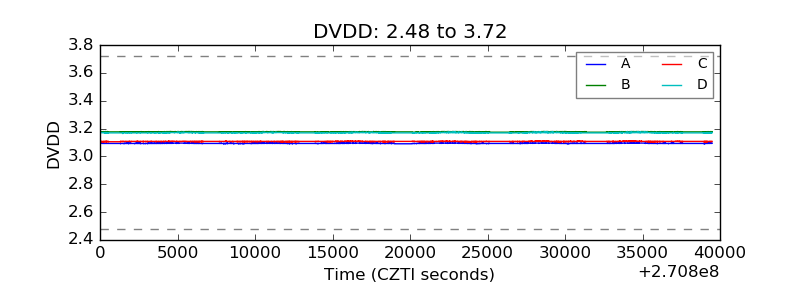 |
| Temperature 1 | 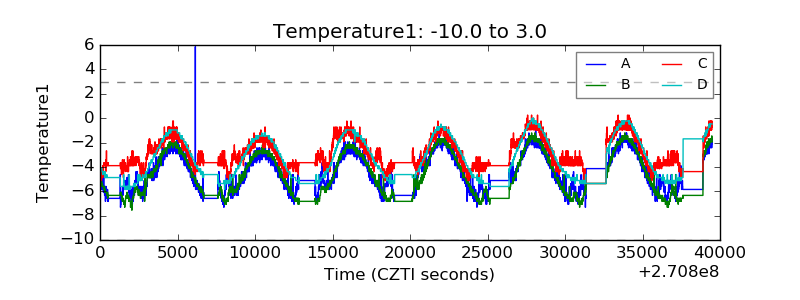 |
| Veto HV Monitor |  |
| Veto LLD | 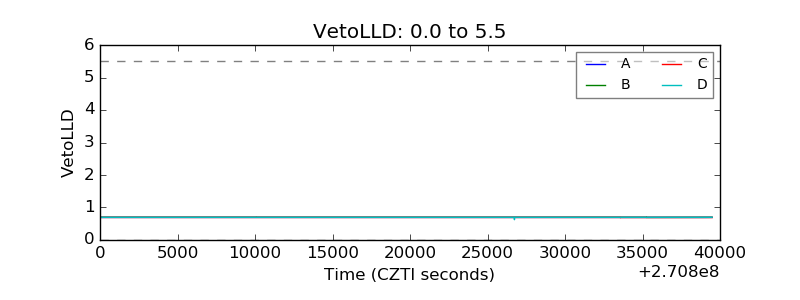 |
| Alpha Counter |  |
| _CPM_Rate |  |
| CZT Counter |  |
| +2.5 Volts monitor |  |
| +5 Volts monitor |  |
| _ROLL_ROT |  |
| _Roll_DEC |  |
| _Roll_RA |  |
| Veto Counter |  |