| Param | Original file | Final file |
|---|---|---|
| Filename | modeM0/AS1G08_037T01_9000002264_15365cztM0_level2.evt | modeM0/AS1G08_037T01_9000002264_15365cztM0_level2_quad_clean.evt |
| Size (bytes) | 140,365,440 | 12,274,560 |
| Size | 133.9 MB | 11.7 MB |
| Events in quadrant A | 921,134 | 60,228 |
| Events in quadrant B | 970,437 | 61,530 |
| Events in quadrant C | 1,006,902 | 60,493 |
| Events in quadrant D | 1,221,380 | 50,584 |
| Mode M9 | |||
|---|---|---|---|
| Quadrant | BADHDUFLAG | Total packets | Discarded packets |
| A | 0 | 8 | 0 |
| B | 0 | 8 | 0 |
| C | 0 | 8 | 0 |
| D | 0 | 8 | 0 |
| Mode M0 | |||
|---|---|---|---|
| Quadrant | BADHDUFLAG | Total packets | Discarded packets |
| A | 0 | 3991 | 2 |
| B | 0 | 4032 | 1 |
| C | 0 | 4048 | 1 |
| D | 0 | 5013 | 1 |
| Mode SS | |||
|---|---|---|---|
| Quadrant | BADHDUFLAG | Total packets | Discarded packets |
| A | 0 | 40 | 0 |
| B | 0 | 40 | 0 |
| C | 0 | 40 | 0 |
| D | 0 | 40 | 0 |
| Quadrant | Total seconds | Saturated seconds | Saturation percentage |
|---|---|---|---|
| A | 1890 | 50 | 2.645503% |
| B | 1890 | 55 | 2.910053% |
| C | 1890 | 42 | 2.222222% |
| D | 1890 | 160 | 8.465608% |
Noise dominated data is calculated using 1-second bins in cleaned event files. If a bin has >2000 counts, and if more than 50% of those come from <1% of pixels, then it is considered to be noise-dominated and hence unusable.
| Quadrant | # 1 sec bins | Bins with >0 counts | Bins with >2000 counts | High rate bins dominated by noise | Noise dominated (total time) | Noise dominated (detector-on time) | Marked lightcurve |
|---|---|---|---|---|---|---|---|
| A | 2636 | 1891 | 0 | 0 | 0.00% | 0.00% | 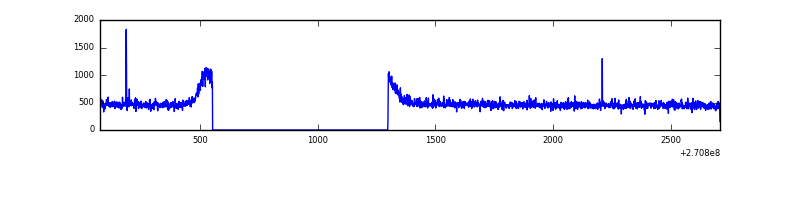 |
| B | 2636 | 1891 | 0 | 0 | 0.00% | 0.00% | 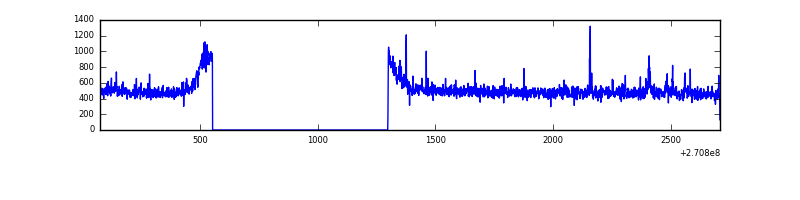 |
| C | 2636 | 1891 | 0 | 0 | 0.00% | 0.00% | 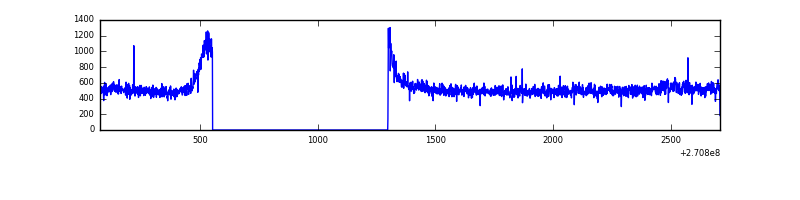 |
| D | 2636 | 1891 | 112 | 112 | 4.25% | 5.92% |  |
Top three noisy pixels from each quadrant. If the there are fewer than three noisy pixels in the level2.evt file, extra rows are filled as -1
| Pixel properties | Quadrant properties | ||||||
|---|---|---|---|---|---|---|---|
| Quadrant | DetID | PixID | Counts | Sigma | Mean | Median | Sigma |
| A | 9 | 143 | 8164 | 158.9 | 237 | 231 | 49.9 |
| A | 0 | 226 | 2104 | 37.52 | 237 | 231 | 49.9 |
| A | 12 | 194 | 1709 | 29.61 | 237 | 231 | 49.9 |
| B | 0 | 189 | 10147 | 202.06 | 240 | 233 | 49.1 |
| B | 4 | 173 | 7286 | 143.75 | 240 | 233 | 49.1 |
| B | 4 | 48 | 7010 | 138.13 | 240 | 233 | 49.1 |
| C | 3 | 233 | 98009 | 1734.72 | 232 | 233 | 56.4 |
| C | 13 | 61 | 1655 | 25.23 | 232 | 233 | 56.4 |
| C | 10 | 22 | 991 | 13.45 | 232 | 233 | 56.4 |
| D | 9 | 68 | 360604 | 6480.78 | 219 | 212 | 55.6 |
| D | 7 | 38 | 11255 | 198.58 | 219 | 212 | 55.6 |
| D | 1 | 255 | 8692 | 152.49 | 219 | 212 | 55.6 |
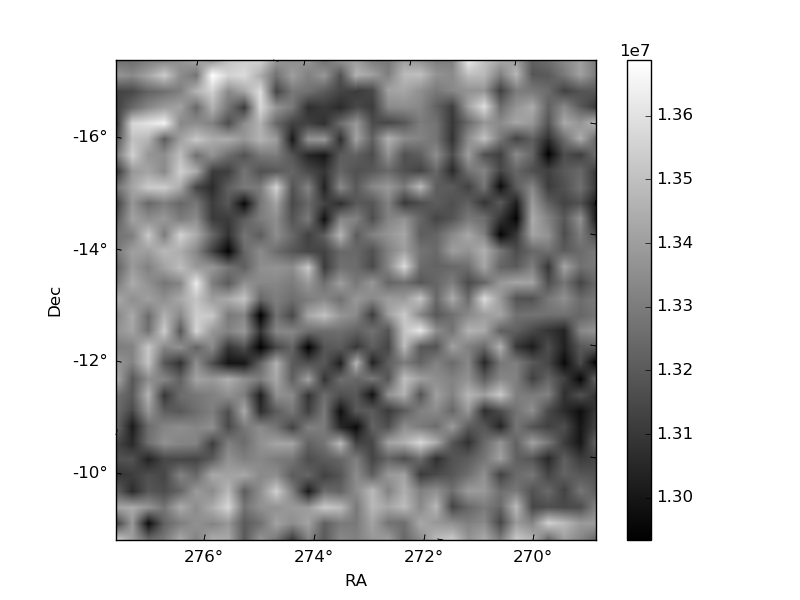
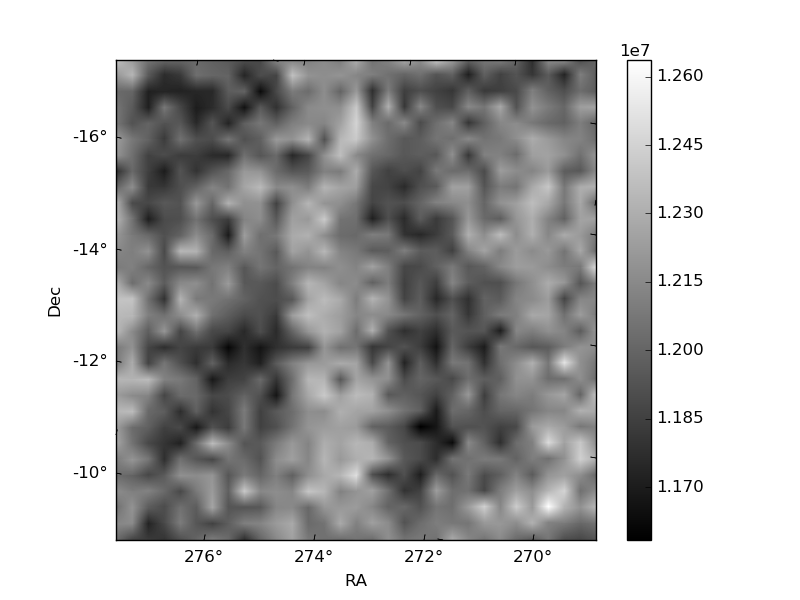
Histogram calculated using DETX and DETY for each event in the final _common_clean file
| Quadrant A | 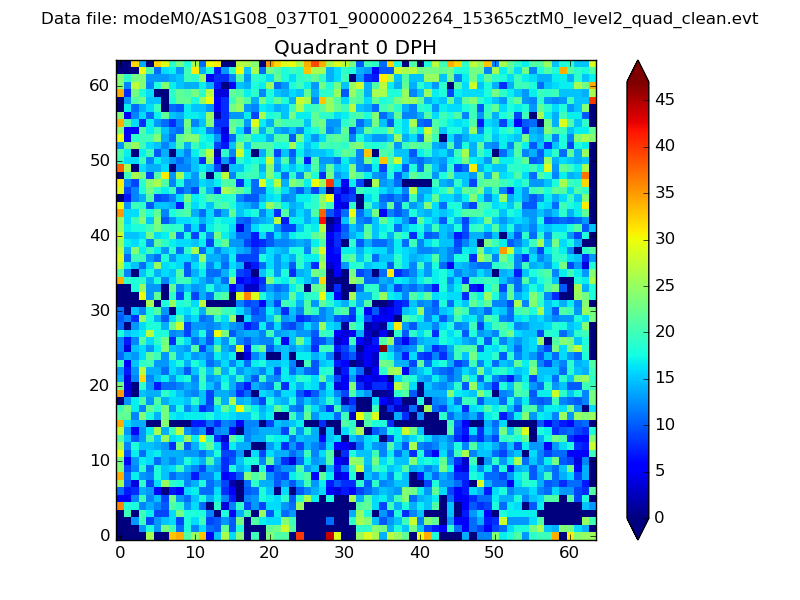 |
 |
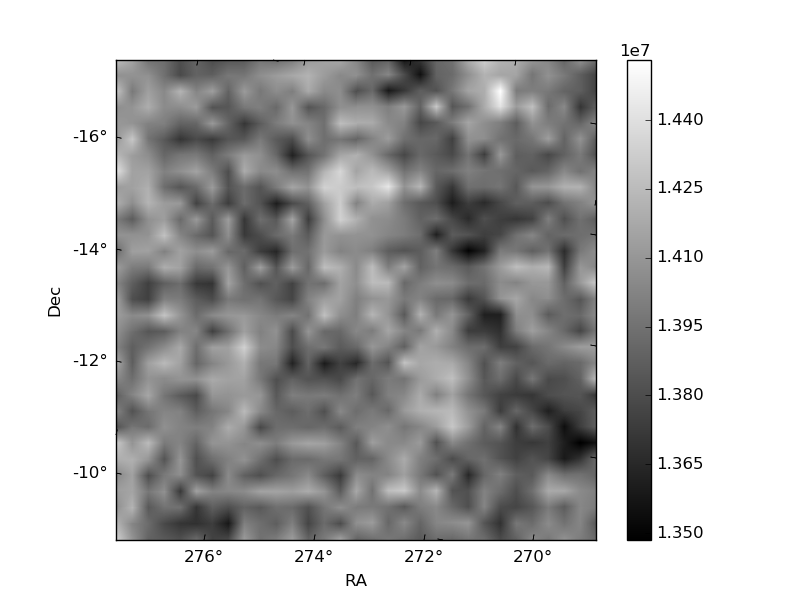
Quadrant B |
|---|---|---|---|
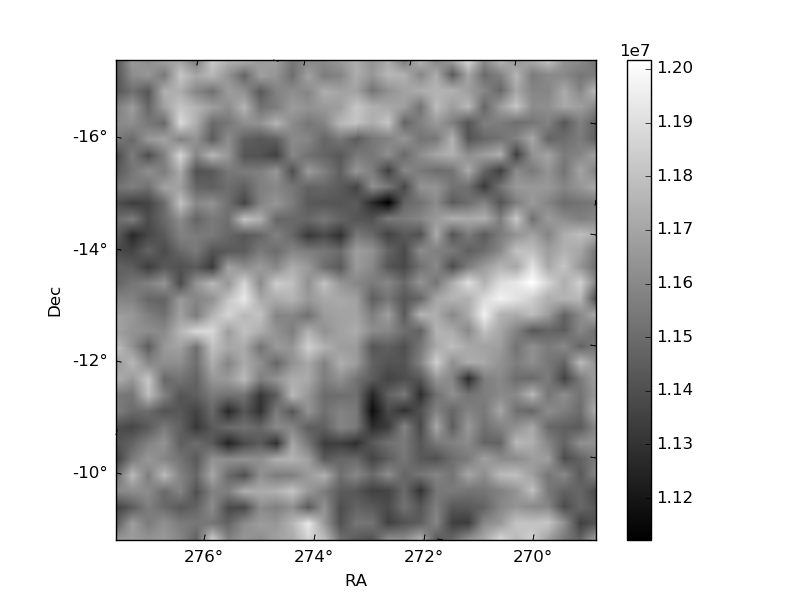
| Quadrant D | 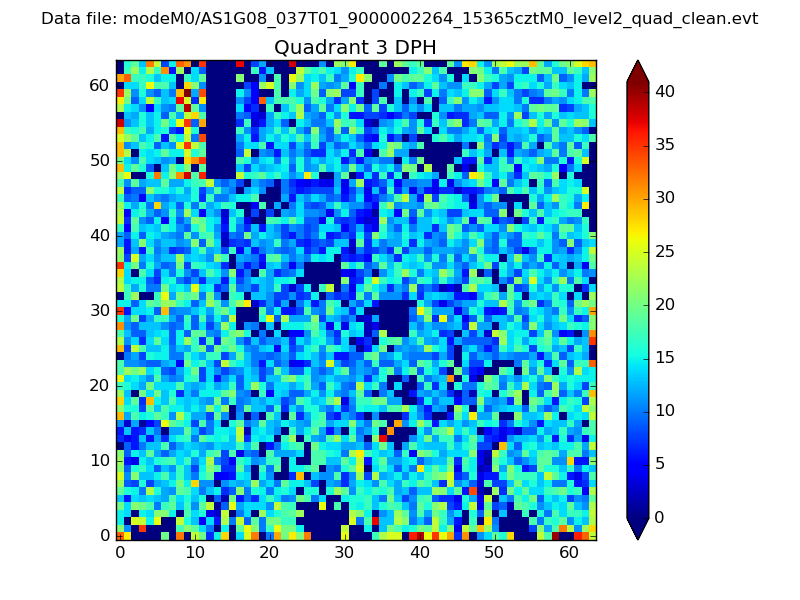 |
 |
Quadrant C |
| Plot type | Count rate plots | Images |
|---|---|---|
| Comparison with Poisson distribution Blue bars denote a histogram of data divided into 1 sec bins. Red curve is a Poisson curve with rate = median count rate of data. |
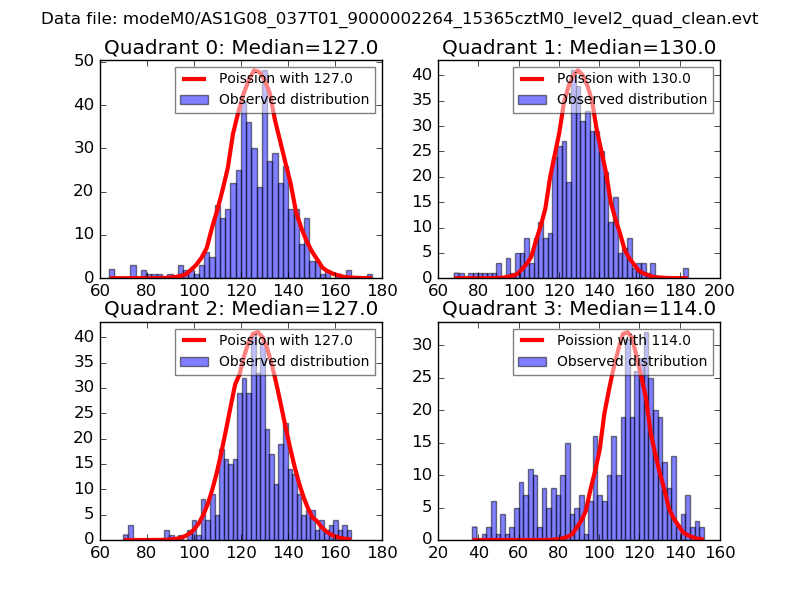 |
 |
| Quadrant-wise count rates Data is divided into 100 sec bins |
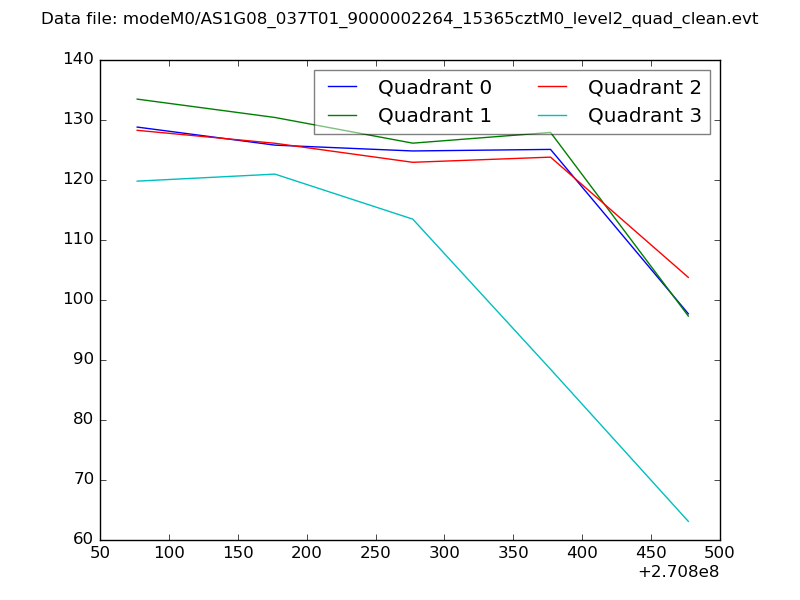 |
|
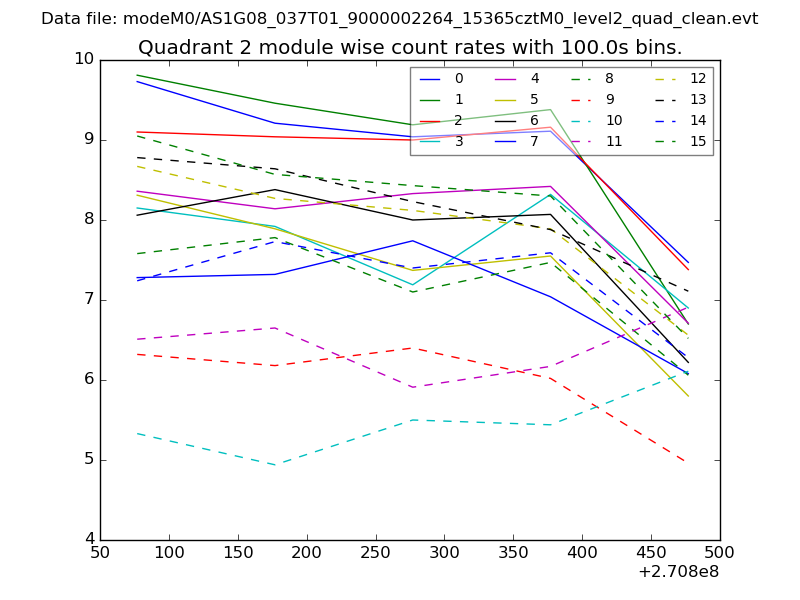
| Module-wise count rates for Quadrant A Data is divided into 100 sec bins |
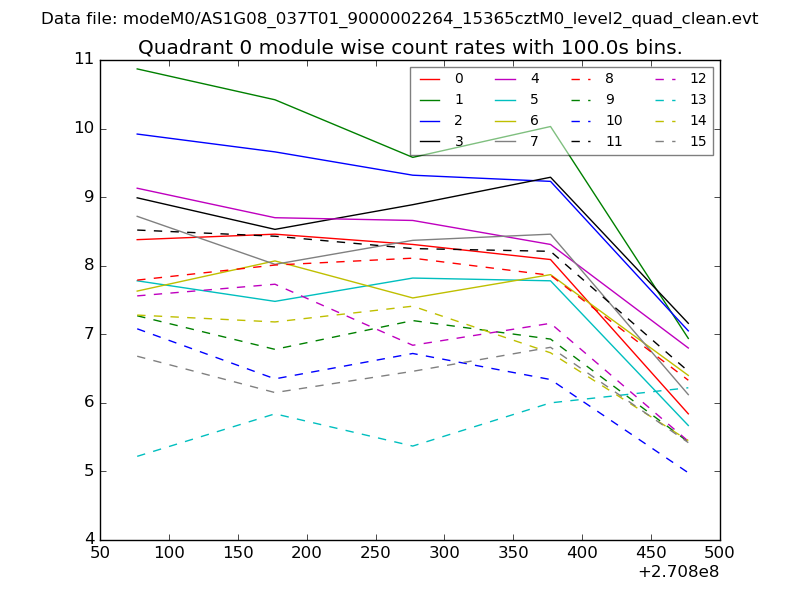 |
 |
| Module-wise count rates for Quadrant B Data is divided into 100 sec bins |
 |
 |
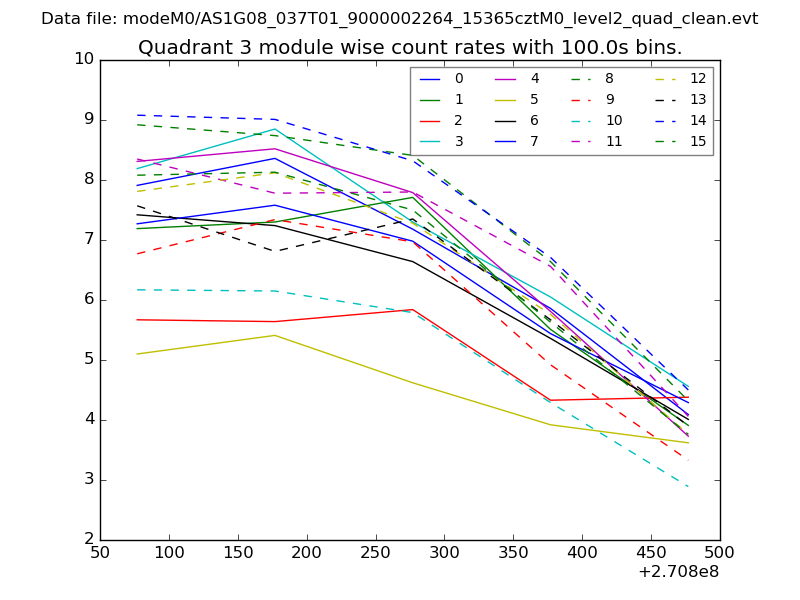
| Module-wise count rates for Quadrant C Data is divided into 100 sec bins |
 |
 |
| Module-wise count rates for Quadrant D Data is divided into 100 sec bins |
 |
 |
| Parameter | Plot |
|---|---|
| CZT HV Monitor | 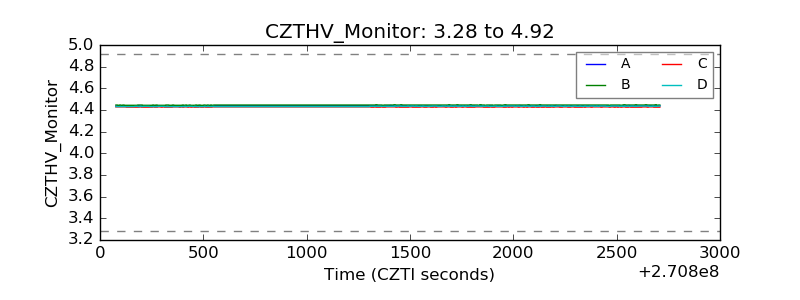 |
| D_VDD | 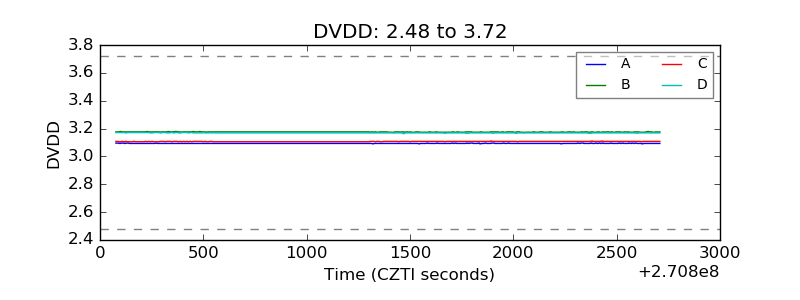 |
| Temperature 1 | 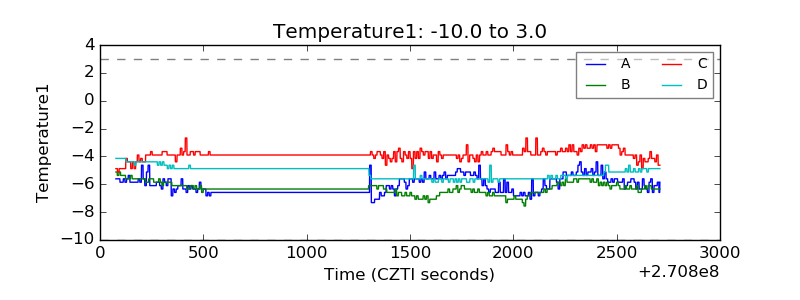 |
| Veto HV Monitor | 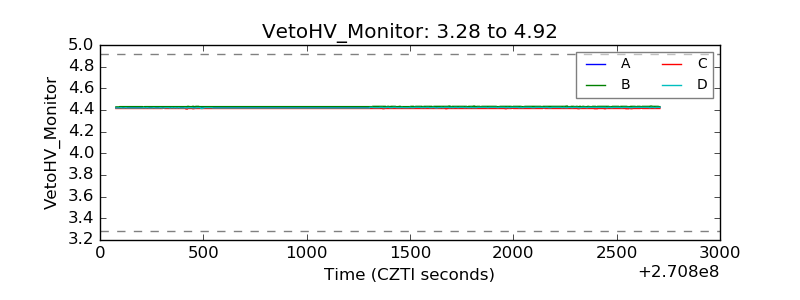 |
| Veto LLD |  |
| Alpha Counter |  |
| _CPM_Rate | 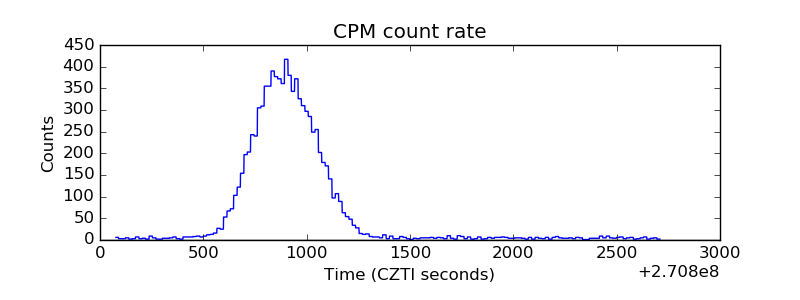 |
| CZT Counter |  |
| +2.5 Volts monitor | 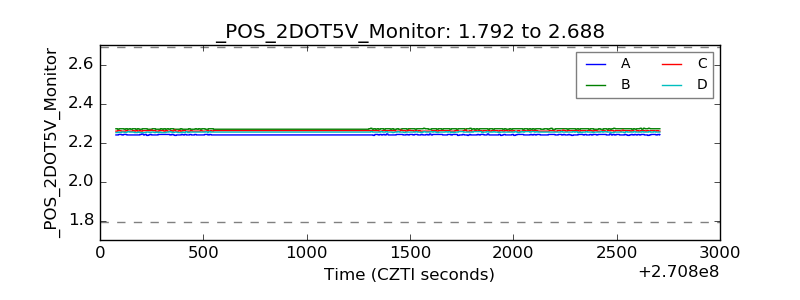 |
| +5 Volts monitor |  |
| _ROLL_ROT | 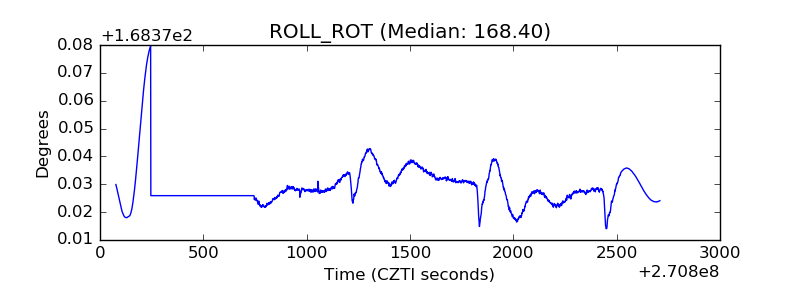 |
| _Roll_DEC | 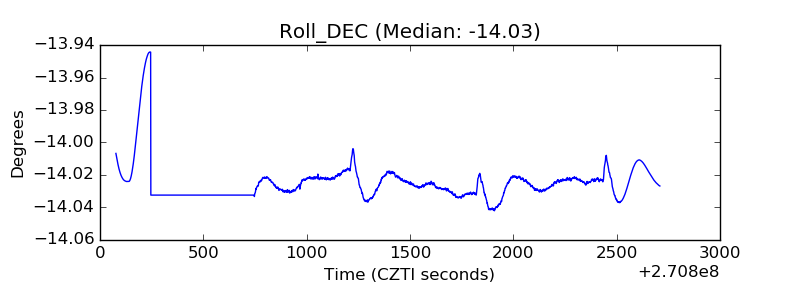 |
| _Roll_RA | 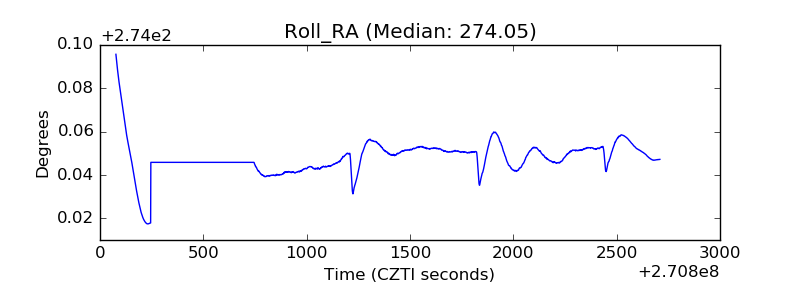 |
| Veto Counter | 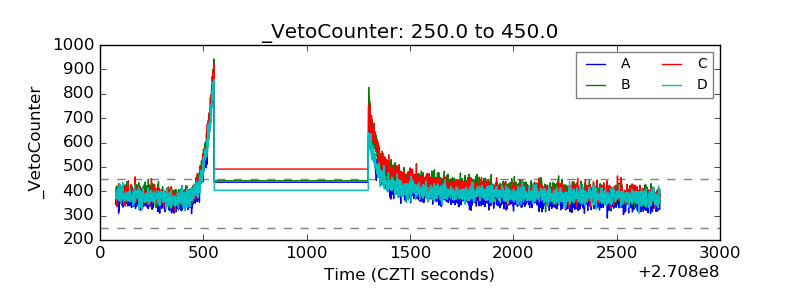 |