| Param | Original file | Final file |
|---|---|---|
| Filename | modeM0/AS1G08_037T01_9000002264_15366cztM0_level2.evt | modeM0/AS1G08_037T01_9000002264_15366cztM0_level2_quad_clean.evt |
| Size (bytes) | 505,935,360 | 68,195,520 |
| Size | 482.5 MB | 65.0 MB |
| Events in quadrant A | 3,212,844 | 408,752 |
| Events in quadrant B | 3,372,635 | 415,231 |
| Events in quadrant C | 3,514,835 | 407,024 |
| Events in quadrant D | 4,758,932 | 358,429 |
| Mode M9 | |||
|---|---|---|---|
| Quadrant | BADHDUFLAG | Total packets | Discarded packets |
| A | 0 | 12 | 0 |
| B | 0 | 12 | 0 |
| C | 0 | 12 | 0 |
| D | 0 | 13 | 0 |
| Mode M0 | |||
|---|---|---|---|
| Quadrant | BADHDUFLAG | Total packets | Discarded packets |
| A | 0 | 13966 | 3 |
| B | 0 | 14215 | 2 |
| C | 0 | 14441 | 2 |
| D | 0 | 18900 | 2 |
| Mode SS | |||
|---|---|---|---|
| Quadrant | BADHDUFLAG | Total packets | Discarded packets |
| A | 0 | 138 | 0 |
| B | 0 | 138 | 0 |
| C | 0 | 138 | 0 |
| D | 0 | 138 | 0 |
| Quadrant | Total seconds | Saturated seconds | Saturation percentage |
|---|---|---|---|
| A | 6820 | 58 | 0.850440% |
| B | 6820 | 72 | 1.055718% |
| C | 6820 | 54 | 0.791789% |
| D | 6820 | 610 | 8.944282% |
Noise dominated data is calculated using 1-second bins in cleaned event files. If a bin has >2000 counts, and if more than 50% of those come from <1% of pixels, then it is considered to be noise-dominated and hence unusable.
| Quadrant | # 1 sec bins | Bins with >0 counts | Bins with >2000 counts | High rate bins dominated by noise | Noise dominated (total time) | Noise dominated (detector-on time) | Marked lightcurve |
|---|---|---|---|---|---|---|---|
| A | 7721 | 6821 | 0 | 0 | 0.00% | 0.00% | 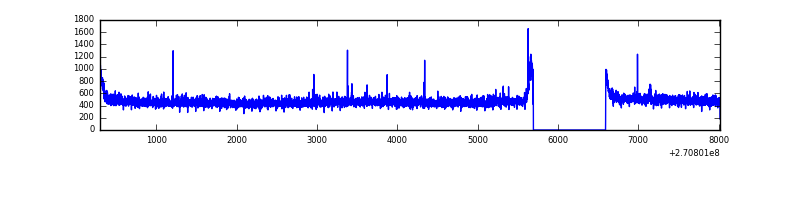 |
| B | 7721 | 6821 | 2 | 2 | 0.03% | 0.03% | 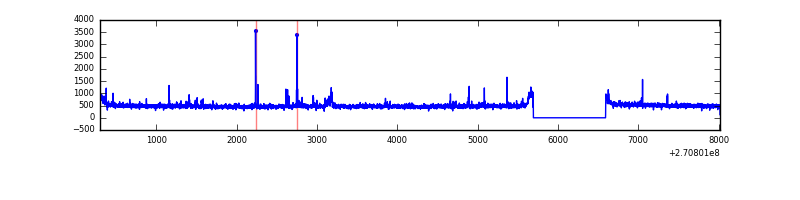 |
| C | 7721 | 6821 | 0 | 0 | 0.00% | 0.00% | 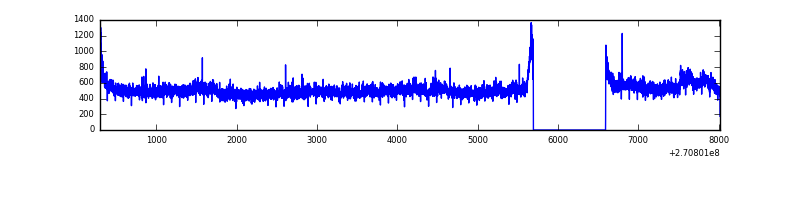 |
| D | 7721 | 6821 | 537 | 537 | 6.96% | 7.87% | 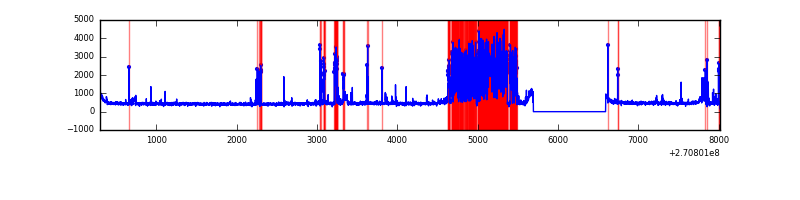 |
Top three noisy pixels from each quadrant. If the there are fewer than three noisy pixels in the level2.evt file, extra rows are filled as -1
| Pixel properties | Quadrant properties | ||||||
|---|---|---|---|---|---|---|---|
| Quadrant | DetID | PixID | Counts | Sigma | Mean | Median | Sigma |
| A | 9 | 143 | 15566 | 87.74 | 829 | 811 | 168.2 |
| A | 0 | 226 | 7456 | 39.51 | 829 | 811 | 168.2 |
| A | 15 | 239 | 6908 | 36.25 | 829 | 811 | 168.2 |
| B | 4 | 48 | 26849 | 162.6 | 833 | 813 | 160.1 |
| B | 0 | 230 | 25348 | 153.22 | 833 | 813 | 160.1 |
| B | 4 | 173 | 25052 | 151.37 | 833 | 813 | 160.1 |
| C | 3 | 233 | 387236 | 2064.95 | 802 | 805 | 187.1 |
| C | 13 | 61 | 5779 | 26.58 | 802 | 805 | 187.1 |
| C | 5 | 96 | 2988 | 11.67 | 802 | 805 | 187.1 |
| D | 1 | 255 | 1539983 | 8041.23 | 776 | 754 | 191.4 |
| D | 10 | 70 | 91833 | 475.81 | 776 | 754 | 191.4 |
| D | 2 | 33 | 86875 | 449.91 | 776 | 754 | 191.4 |
Histogram calculated using DETX and DETY for each event in the final _common_clean file
| Quadrant A | 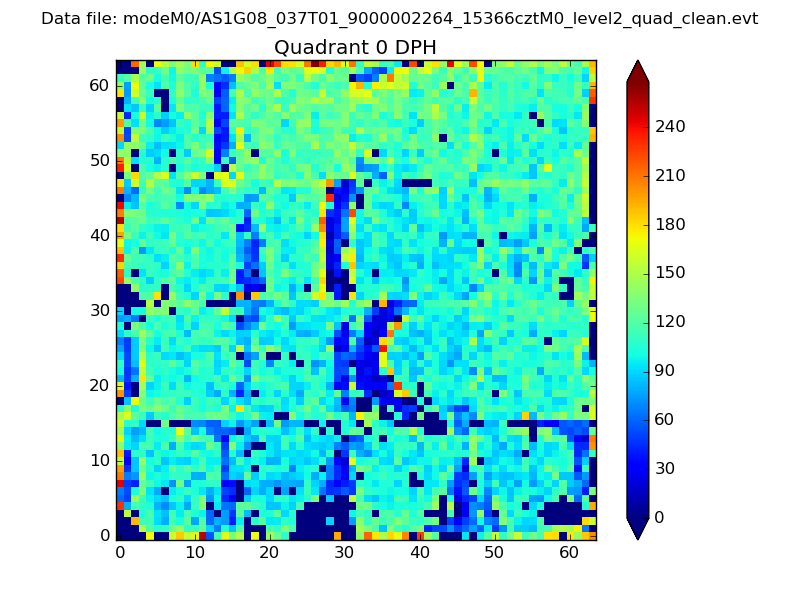 |
 |
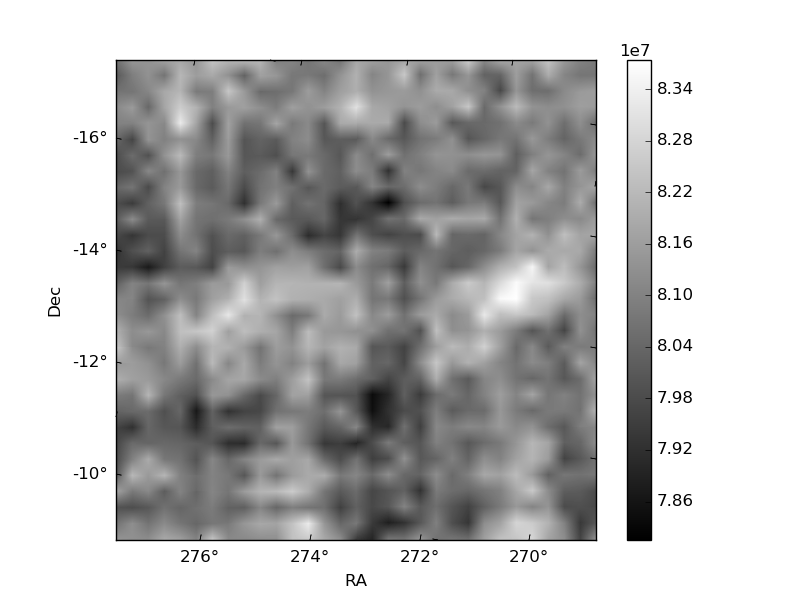
Quadrant B |
|---|---|---|---|
| Quadrant D | 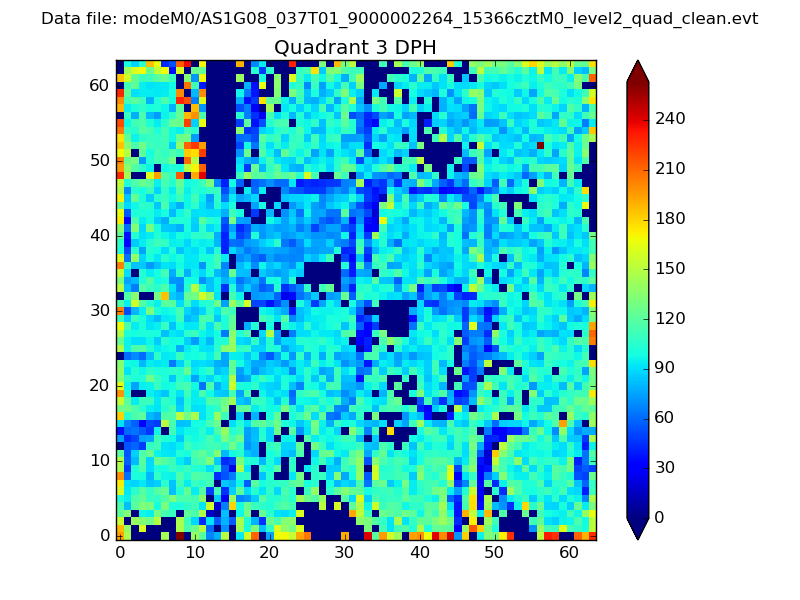 |
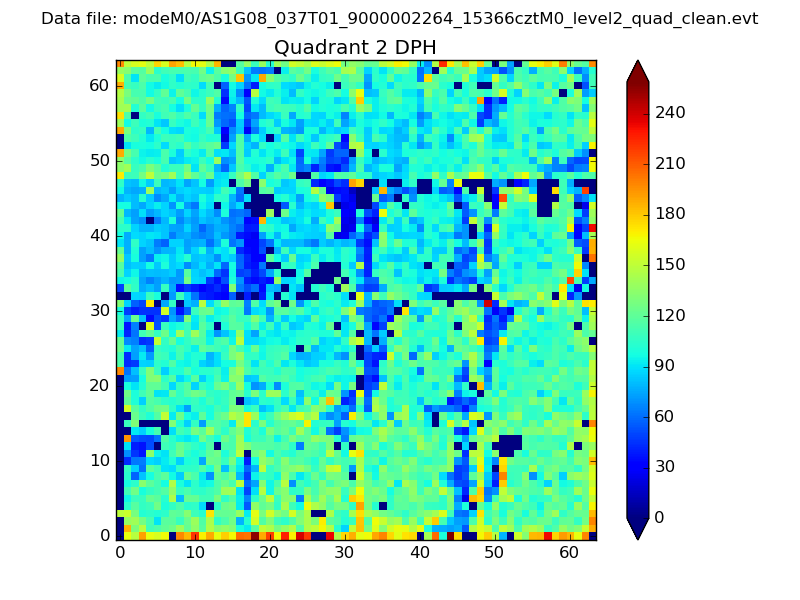 |
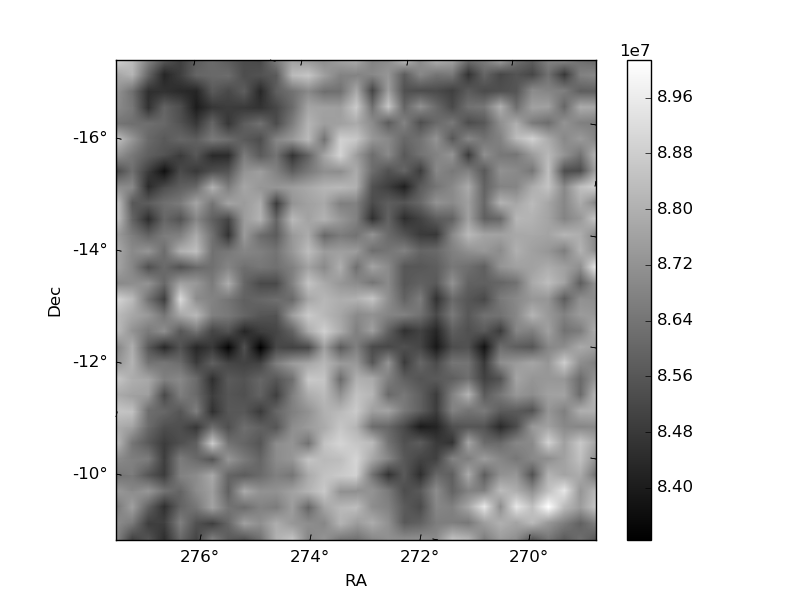
Quadrant C |
| Plot type | Count rate plots | Images |
|---|---|---|
| Comparison with Poisson distribution Blue bars denote a histogram of data divided into 1 sec bins. Red curve is a Poisson curve with rate = median count rate of data. |
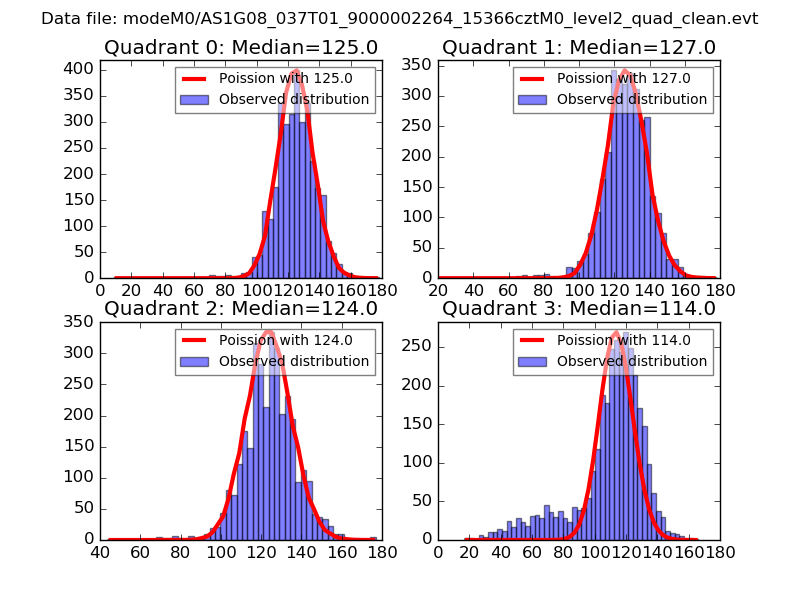 |
 |
| Quadrant-wise count rates Data is divided into 100 sec bins |
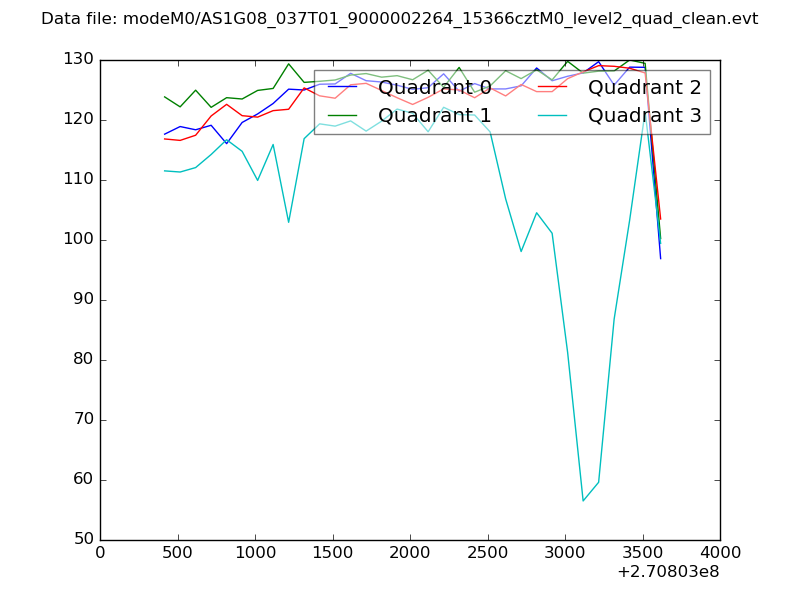 |
|
| Module-wise count rates for Quadrant A Data is divided into 100 sec bins |
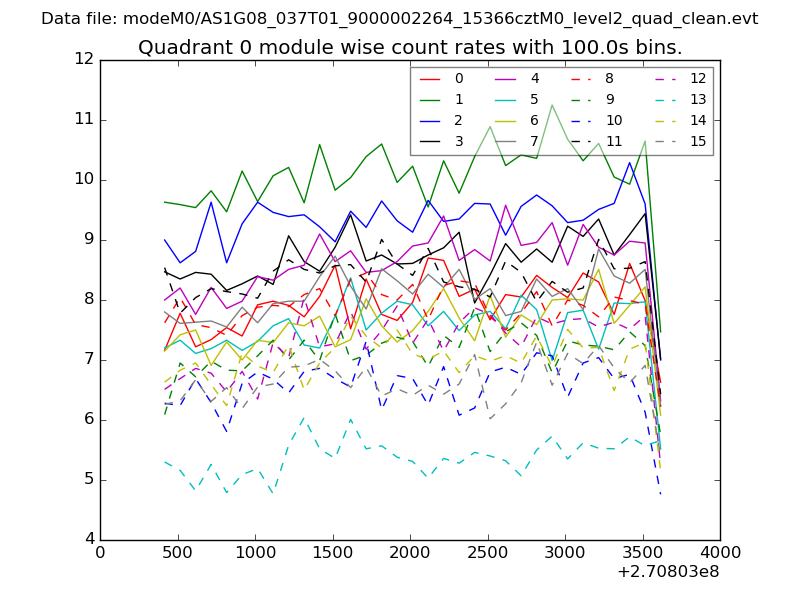 |
 |
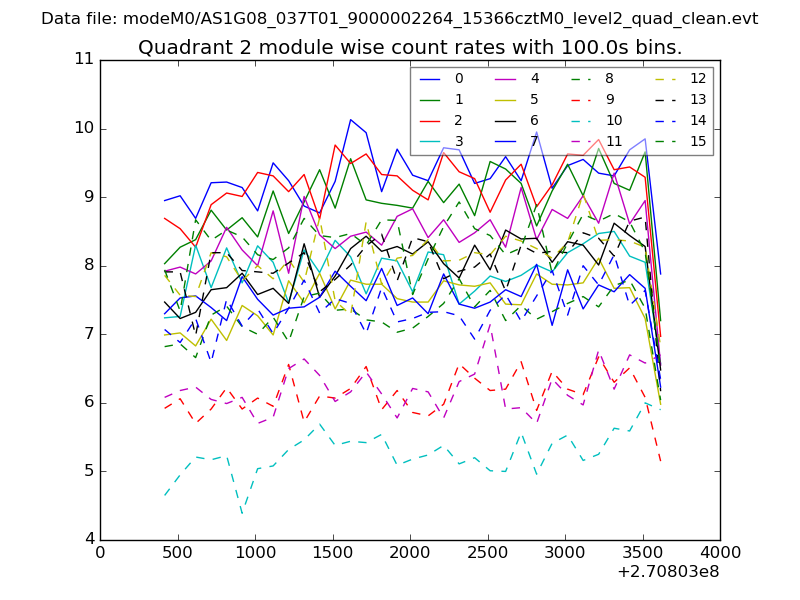
| Module-wise count rates for Quadrant B Data is divided into 100 sec bins |
 |
 |
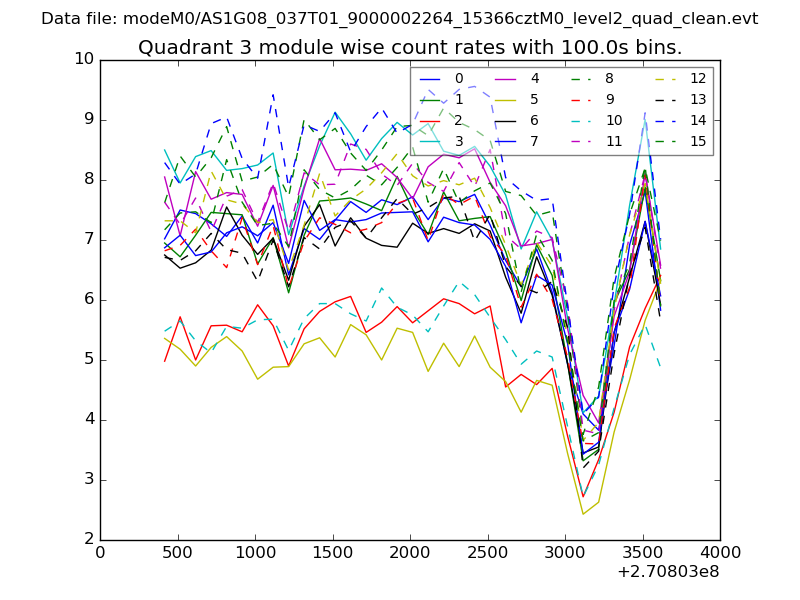
| Module-wise count rates for Quadrant C Data is divided into 100 sec bins |
 |
 |
| Module-wise count rates for Quadrant D Data is divided into 100 sec bins |
 |
 |
| Parameter | Plot |
|---|---|
| CZT HV Monitor | 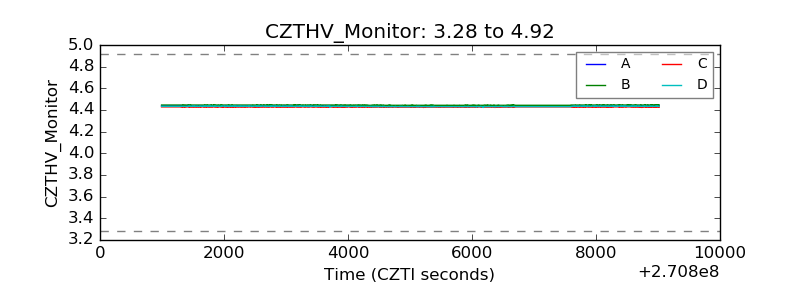 |
| D_VDD | 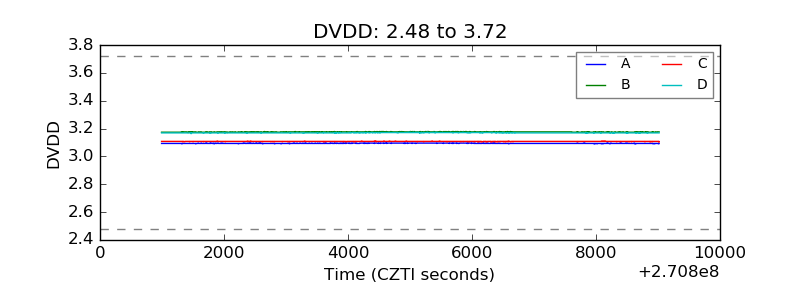 |
| Temperature 1 | 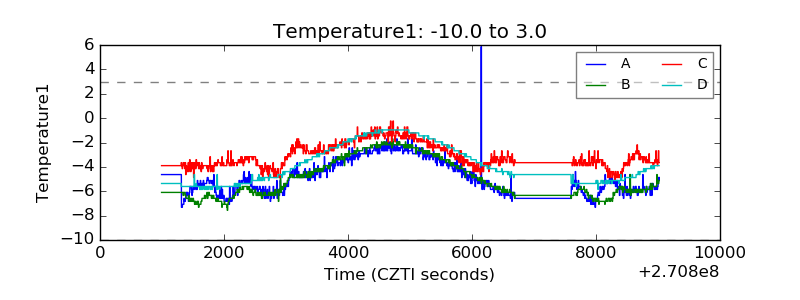 |
| Veto HV Monitor | 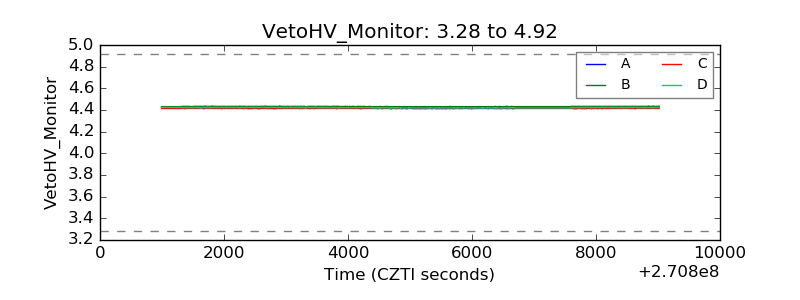 |
| Veto LLD | 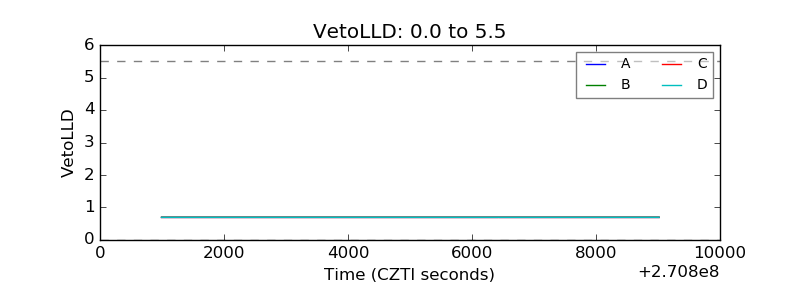 |
| Alpha Counter |  |
| _CPM_Rate | 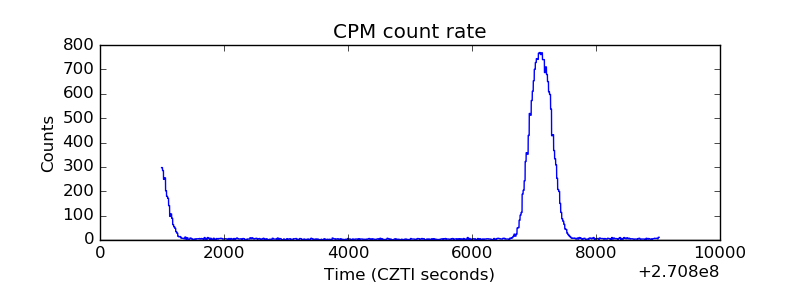 |
| CZT Counter | 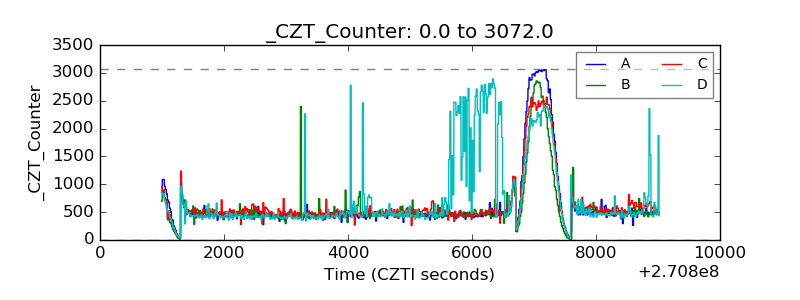 |
| +2.5 Volts monitor |  |
| +5 Volts monitor |  |
| _ROLL_ROT | 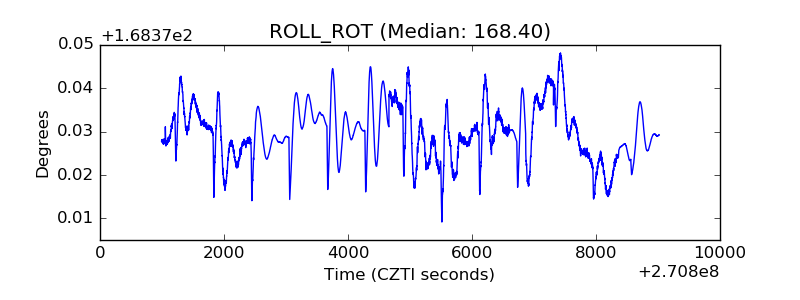 |
| _Roll_DEC | 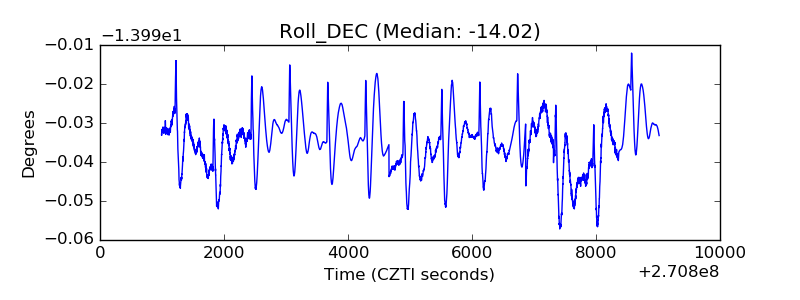 |
| _Roll_RA | 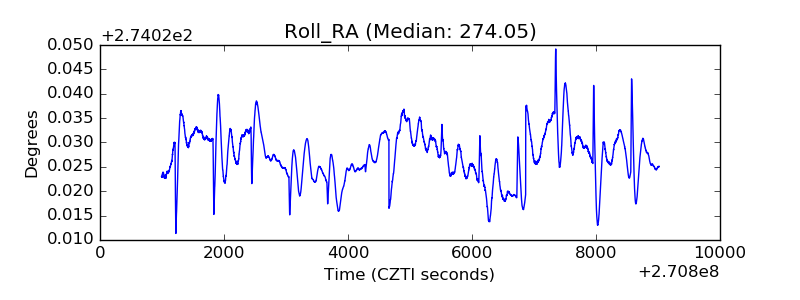 |
| Veto Counter | 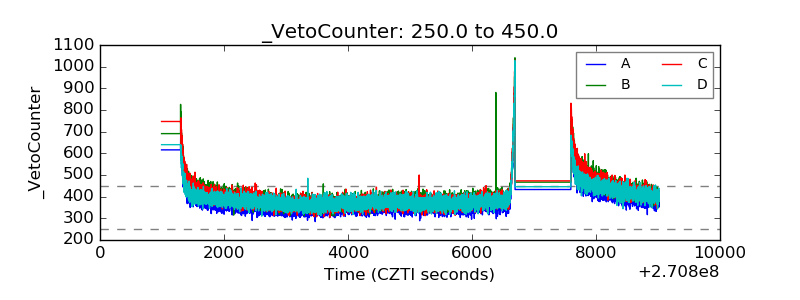 |