| Param | Original file | Final file |
|---|---|---|
| Filename | modeM0/AS1G08_037T01_9000002264_15369cztM0_level2.evt | modeM0/AS1G08_037T01_9000002264_15369cztM0_level2_quad_clean.evt |
| Size (bytes) | 495,593,280 | 86,446,080 |
| Size | 472.6 MB | 82.4 MB |
| Events in quadrant A | 3,304,270 | 553,256 |
| Events in quadrant B | 3,801,021 | 554,817 |
| Events in quadrant C | 3,781,533 | 542,866 |
| Events in quadrant D | 3,683,958 | 516,472 |
| Mode M9 | |||
|---|---|---|---|
| Quadrant | BADHDUFLAG | Total packets | Discarded packets |
| A | 0 | 12 | 0 |
| B | 0 | 12 | 0 |
| C | 0 | 12 | 0 |
| D | 0 | 13 | 0 |
| Mode M0 | |||
|---|---|---|---|
| Quadrant | BADHDUFLAG | Total packets | Discarded packets |
| A | 0 | 13876 | 3 |
| B | 0 | 15283 | 2 |
| C | 0 | 15155 | 2 |
| D | 0 | 15107 | 2 |
| Mode SS | |||
|---|---|---|---|
| Quadrant | BADHDUFLAG | Total packets | Discarded packets |
| A | 0 | 132 | 0 |
| B | 0 | 132 | 0 |
| C | 0 | 132 | 0 |
| D | 0 | 132 | 0 |
| Quadrant | Total seconds | Saturated seconds | Saturation percentage |
|---|---|---|---|
| A | 6454 | 95 | 1.471955% |
| B | 6454 | 223 | 3.455222% |
| C | 6454 | 95 | 1.471955% |
| D | 6454 | 158 | 2.448094% |
Noise dominated data is calculated using 1-second bins in cleaned event files. If a bin has >2000 counts, and if more than 50% of those come from <1% of pixels, then it is considered to be noise-dominated and hence unusable.
| Quadrant | # 1 sec bins | Bins with >0 counts | Bins with >2000 counts | High rate bins dominated by noise | Noise dominated (total time) | Noise dominated (detector-on time) | Marked lightcurve |
|---|---|---|---|---|---|---|---|
| A | 7585 | 6455 | 2 | 2 | 0.03% | 0.03% | 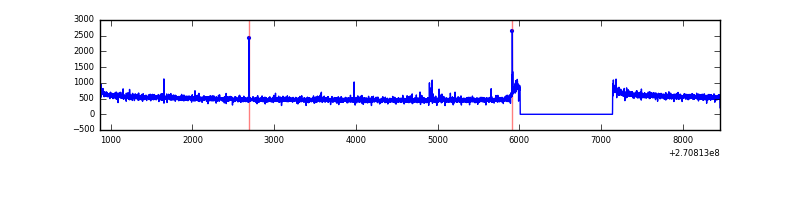 |
| B | 7585 | 6455 | 90 | 90 | 1.19% | 1.39% | 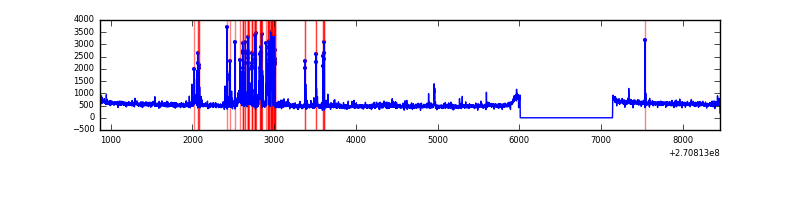 |
| C | 7585 | 6455 | 0 | 0 | 0.00% | 0.00% | 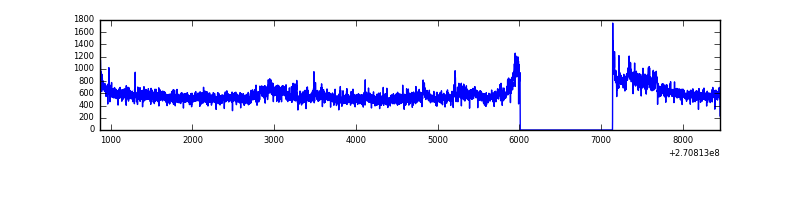 |
| D | 7585 | 6455 | 56 | 56 | 0.74% | 0.87% | 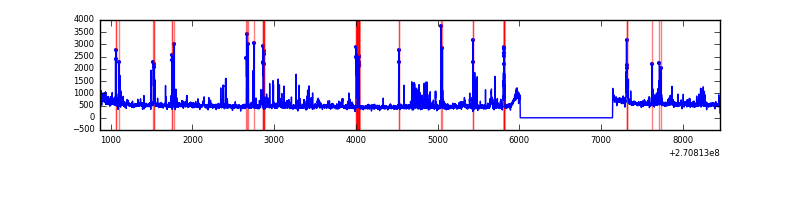 |
Top three noisy pixels from each quadrant. If the there are fewer than three noisy pixels in the level2.evt file, extra rows are filled as -1
| Pixel properties | Quadrant properties | ||||||
|---|---|---|---|---|---|---|---|
| Quadrant | DetID | PixID | Counts | Sigma | Mean | Median | Sigma |
| A | 9 | 143 | 26528 | 150.54 | 851 | 835 | 170.7 |
| A | 0 | 226 | 7871 | 41.23 | 851 | 835 | 170.7 |
| A | 12 | 194 | 6296 | 32.0 | 851 | 835 | 170.7 |
| B | 10 | 245 | 368640 | 2302.94 | 841 | 821 | 159.7 |
| B | 0 | 229 | 44719 | 274.85 | 841 | 821 | 159.7 |
| B | 0 | 182 | 28249 | 171.73 | 841 | 821 | 159.7 |
| C | 3 | 233 | 598407 | 3204.39 | 815 | 823 | 186.5 |
| C | 13 | 61 | 5934 | 27.41 | 815 | 823 | 186.5 |
| C | 5 | 96 | 5126 | 23.07 | 815 | 823 | 186.5 |
| D | 2 | 33 | 196900 | 976.0 | 819 | 795 | 200.9 |
| D | 9 | 68 | 195403 | 968.55 | 819 | 795 | 200.9 |
| D | 1 | 255 | 80013 | 394.26 | 819 | 795 | 200.9 |
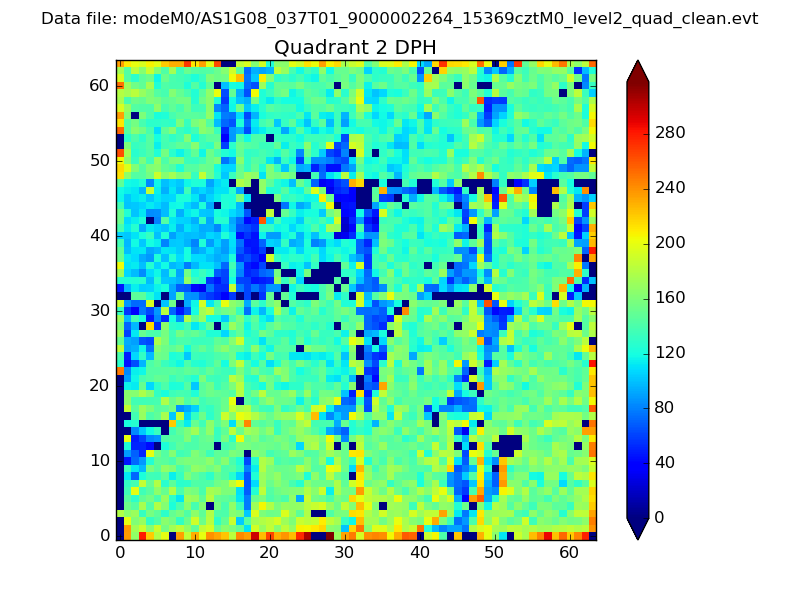
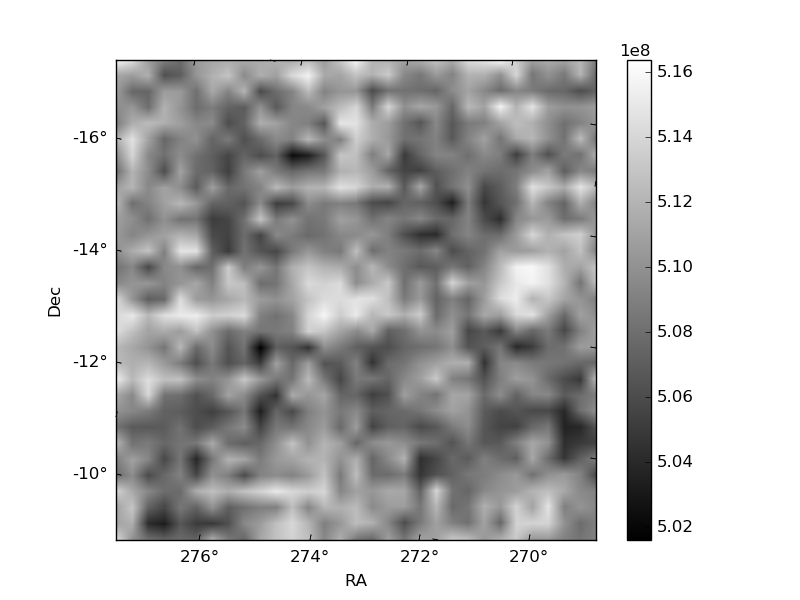
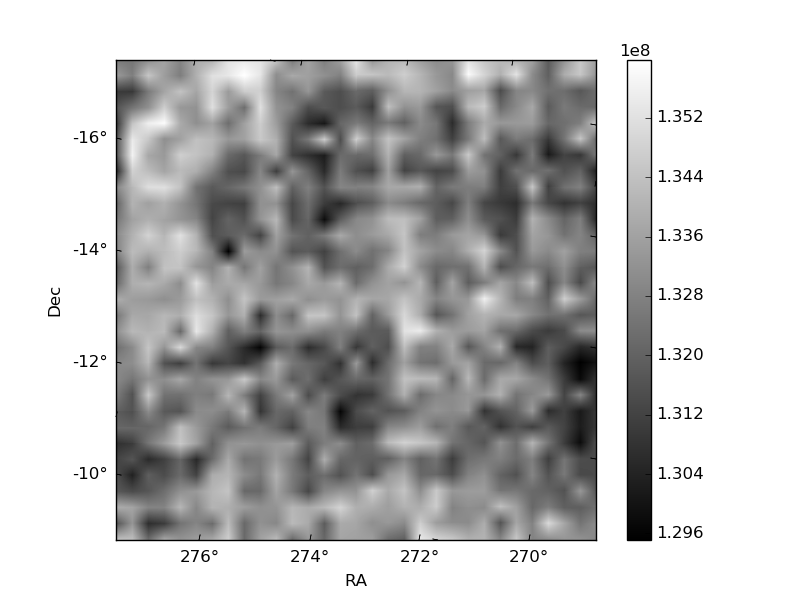
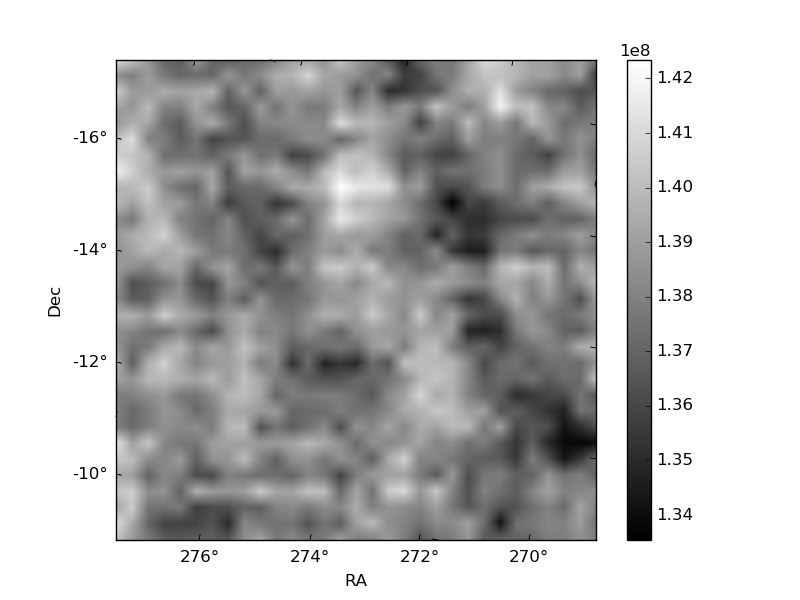
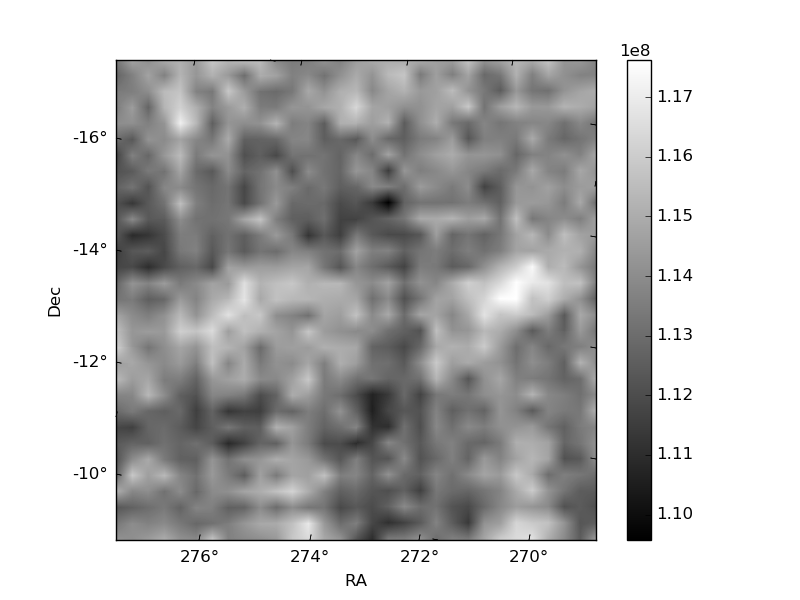
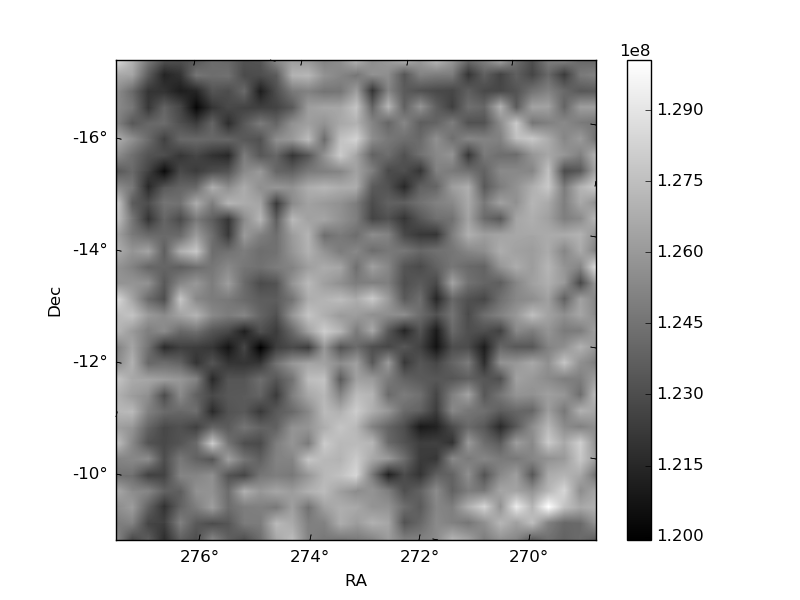
Histogram calculated using DETX and DETY for each event in the final _common_clean file
| Quadrant A | 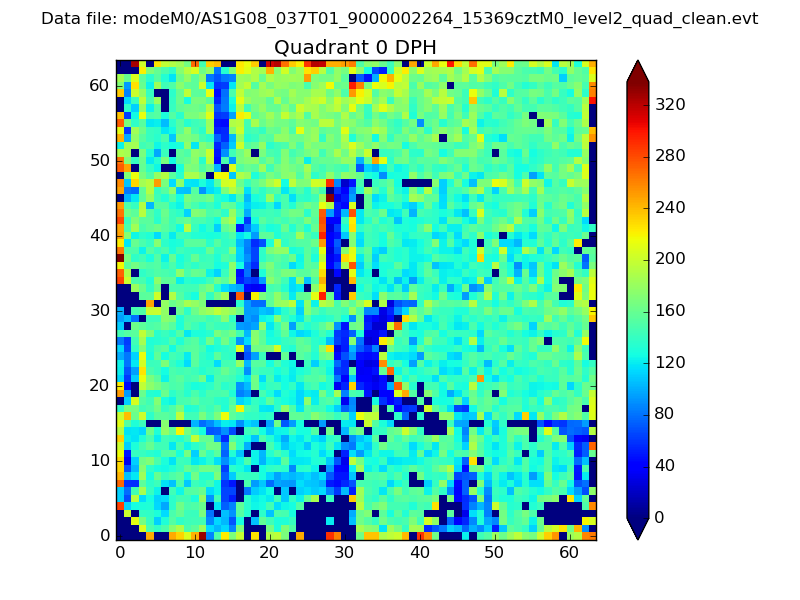 |
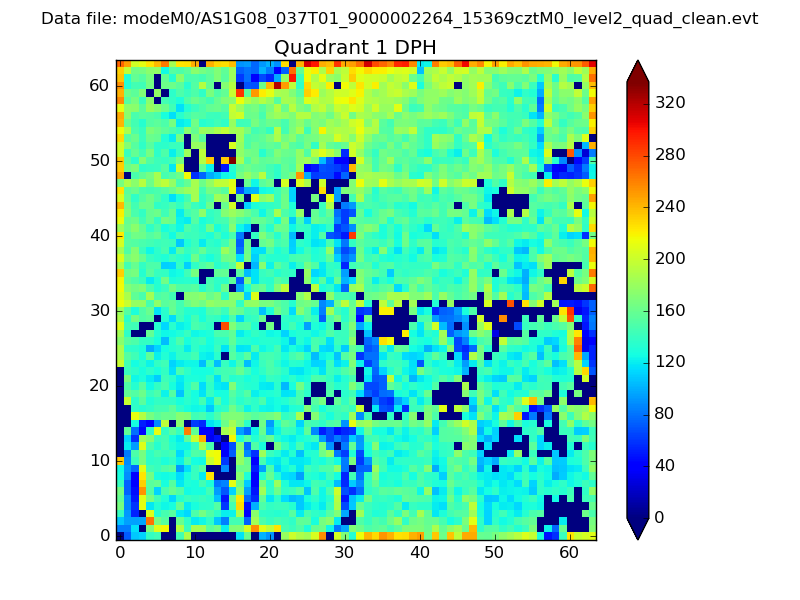 |
Quadrant B |
|---|---|---|---|
| Quadrant D | 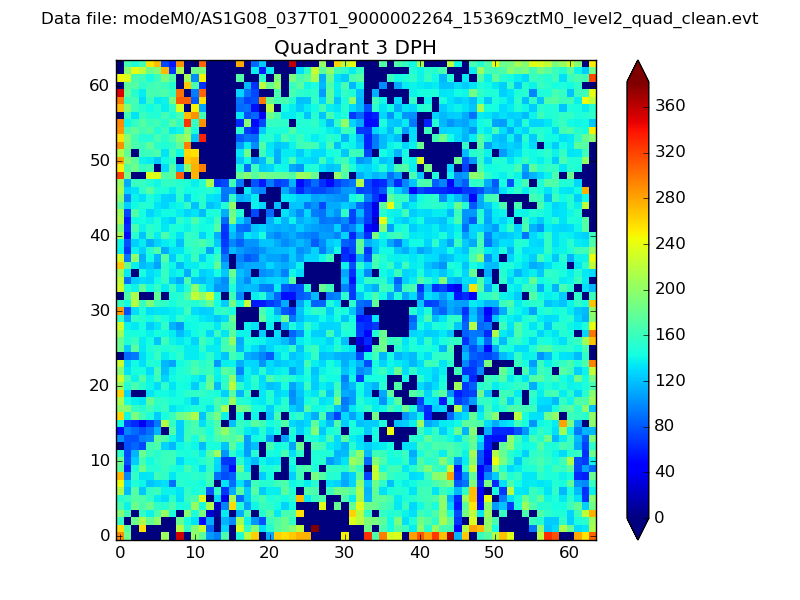 |
 |
Quadrant C |
| Plot type | Count rate plots | Images |
|---|---|---|
| Comparison with Poisson distribution Blue bars denote a histogram of data divided into 1 sec bins. Red curve is a Poisson curve with rate = median count rate of data. |
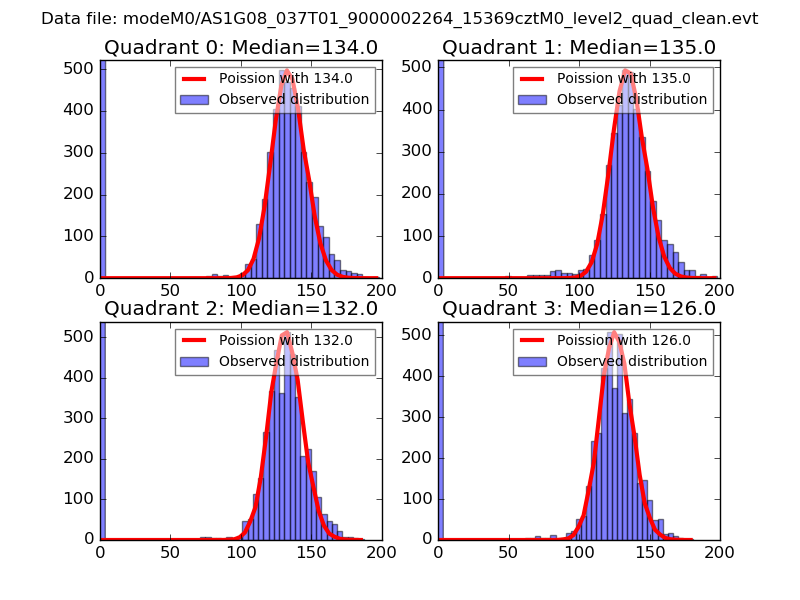 |
 |
| Quadrant-wise count rates Data is divided into 100 sec bins |
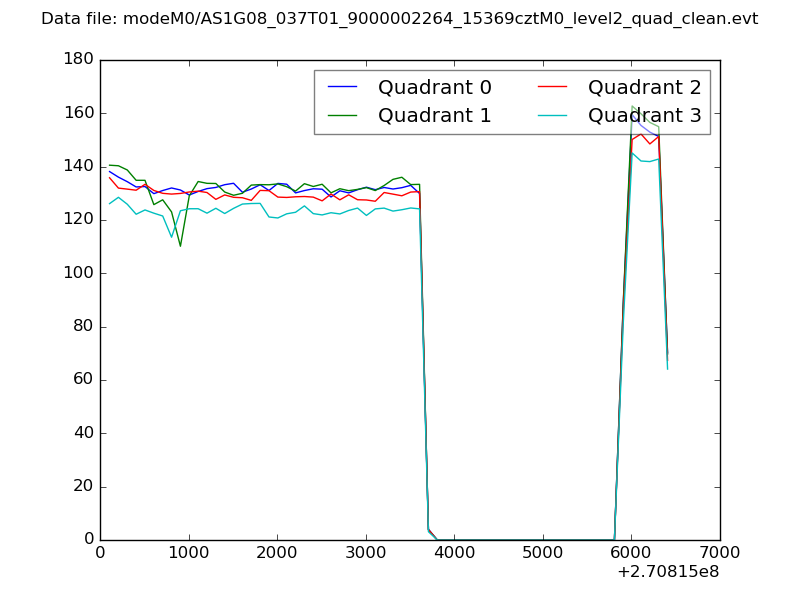 |
|
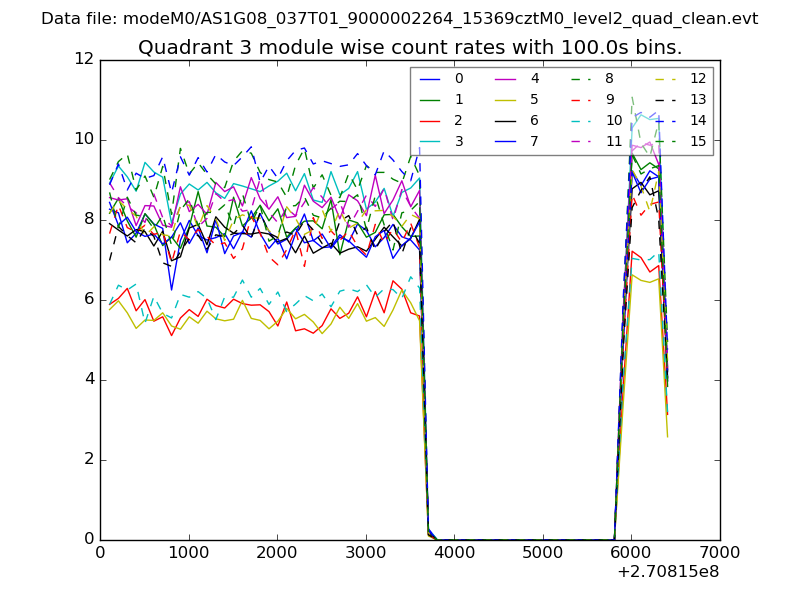
| Module-wise count rates for Quadrant A Data is divided into 100 sec bins |
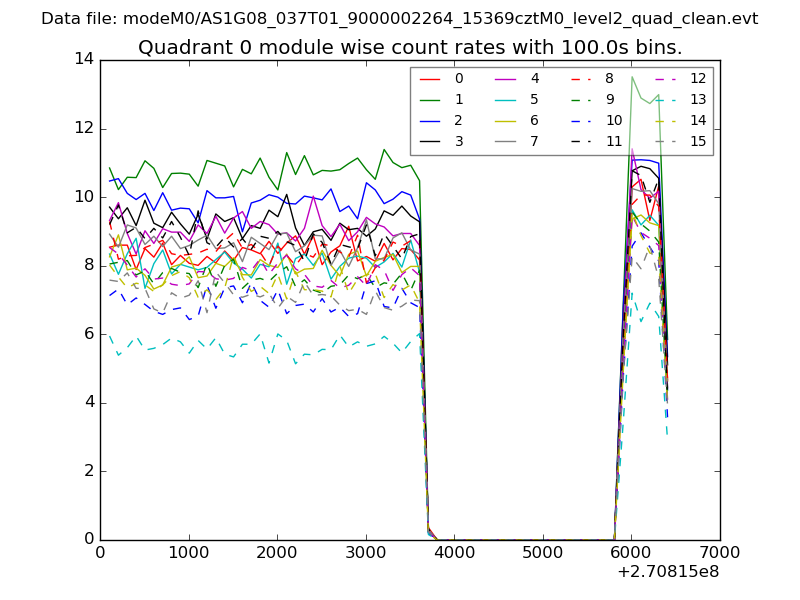 |
 |
| Module-wise count rates for Quadrant B Data is divided into 100 sec bins |
 |
 |
| Module-wise count rates for Quadrant C Data is divided into 100 sec bins |
 |
 |
| Module-wise count rates for Quadrant D Data is divided into 100 sec bins |
 |
 |
| Parameter | Plot |
|---|---|
| CZT HV Monitor | 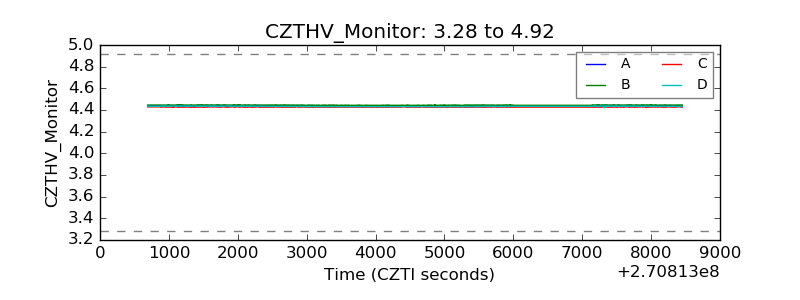 |
| D_VDD | 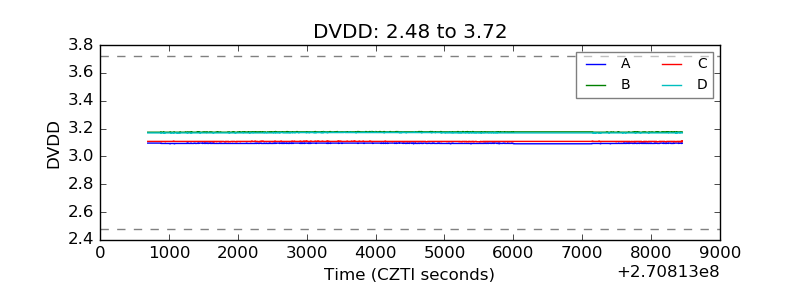 |
| Temperature 1 | 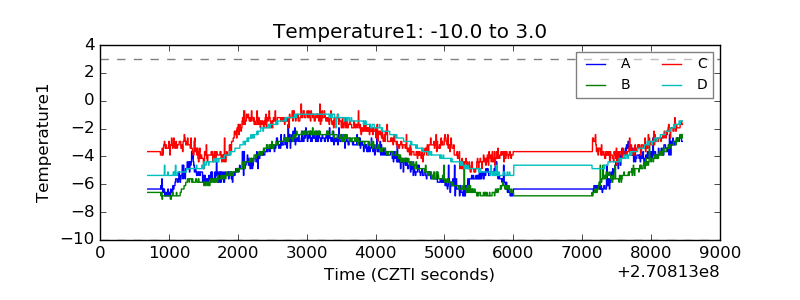 |
| Veto HV Monitor | 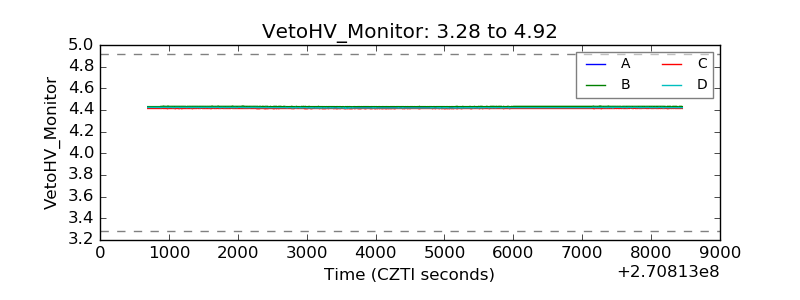 |
| Veto LLD | 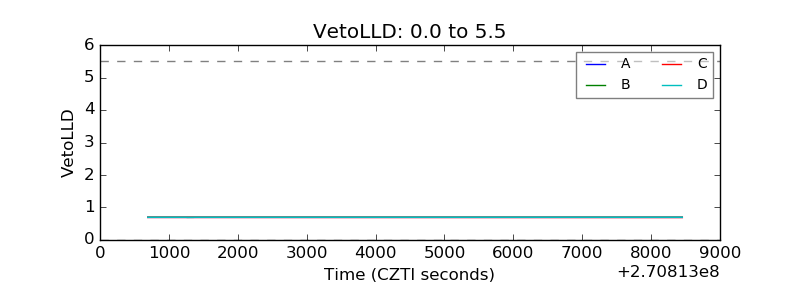 |
| Alpha Counter |  |
| _CPM_Rate | 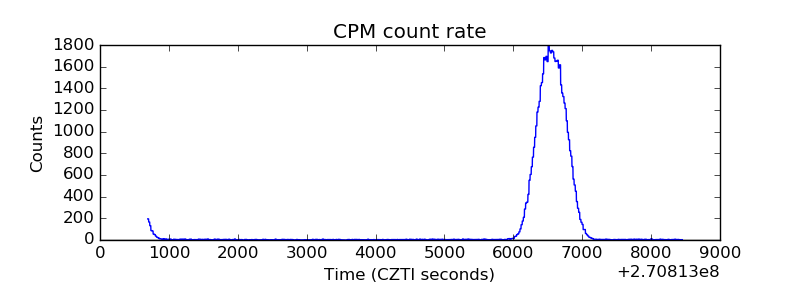 |
| CZT Counter |  |
| +2.5 Volts monitor |  |
| +5 Volts monitor |  |
| _ROLL_ROT | 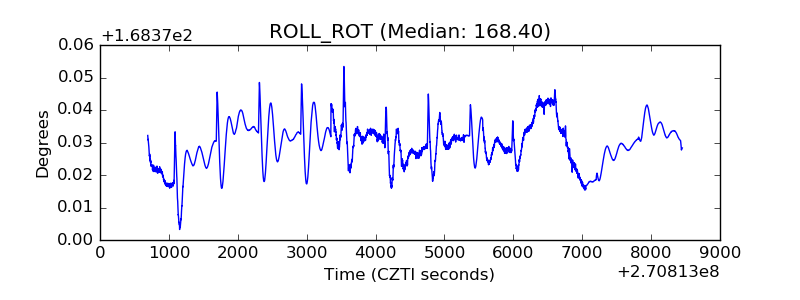 |
| _Roll_DEC | 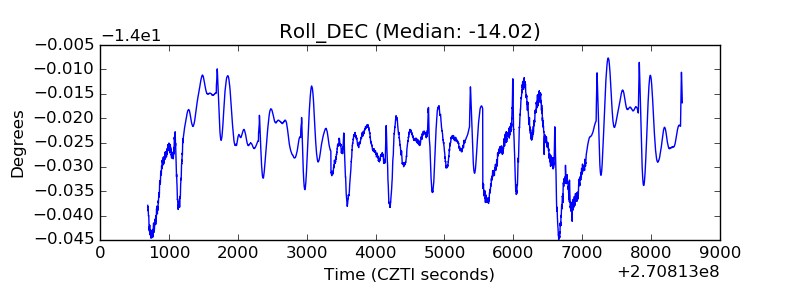 |
| _Roll_RA | 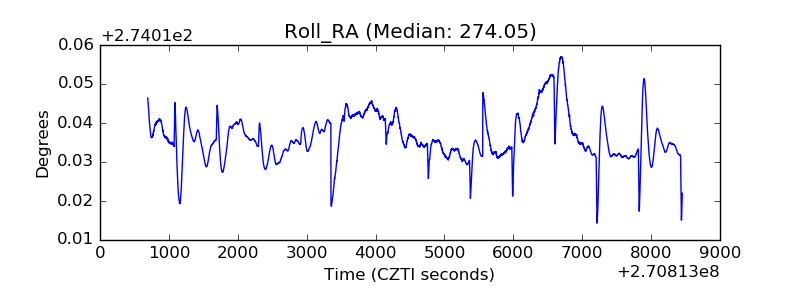 |
| Veto Counter | 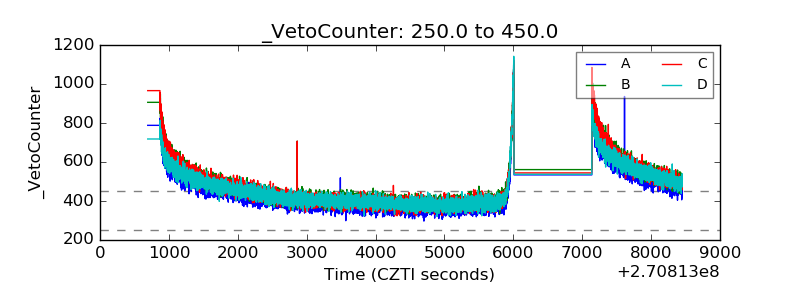 |