| Param | Original file | Final file |
|---|---|---|
| Filename | modeM0/AS1G08_037T01_9000002264_15371cztM0_level2.evt | modeM0/AS1G08_037T01_9000002264_15371cztM0_level2_quad_clean.evt |
| Size (bytes) | 471,997,440 | 106,830,720 |
| Size | 450.1 MB | 101.9 MB |
| Events in quadrant A | 3,024,575 | 739,960 |
| Events in quadrant B | 3,190,770 | 740,151 |
| Events in quadrant C | 3,125,860 | 711,916 |
| Events in quadrant D | 4,562,700 | 641,197 |
| Mode M9 | |||
|---|---|---|---|
| Quadrant | BADHDUFLAG | Total packets | Discarded packets |
| A | 0 | 13 | 0 |
| B | 0 | 13 | 0 |
| C | 0 | 13 | 0 |
| D | 0 | 13 | 0 |
| Mode M0 | |||
|---|---|---|---|
| Quadrant | BADHDUFLAG | Total packets | Discarded packets |
| A | 0 | 12570 | 2 |
| B | 0 | 13076 | 1 |
| C | 0 | 13059 | 1 |
| D | 0 | 17240 | 1 |
| Mode SS | |||
|---|---|---|---|
| Quadrant | BADHDUFLAG | Total packets | Discarded packets |
| A | 0 | 118 | 0 |
| B | 0 | 118 | 0 |
| C | 0 | 118 | 0 |
| D | 0 | 118 | 0 |
| Quadrant | Total seconds | Saturated seconds | Saturation percentage |
|---|---|---|---|
| A | 5748 | 80 | 1.391788% |
| B | 5748 | 103 | 1.791928% |
| C | 5748 | 68 | 1.183020% |
| D | 5748 | 685 | 11.917189% |
Noise dominated data is calculated using 1-second bins in cleaned event files. If a bin has >2000 counts, and if more than 50% of those come from <1% of pixels, then it is considered to be noise-dominated and hence unusable.
| Quadrant | # 1 sec bins | Bins with >0 counts | Bins with >2000 counts | High rate bins dominated by noise | Noise dominated (total time) | Noise dominated (detector-on time) | Marked lightcurve |
|---|---|---|---|---|---|---|---|
| A | 7039 | 5749 | 2 | 2 | 0.03% | 0.03% | 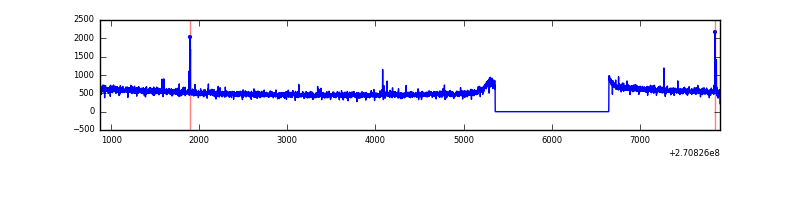 |
| B | 7039 | 5749 | 7 | 7 | 0.10% | 0.12% | 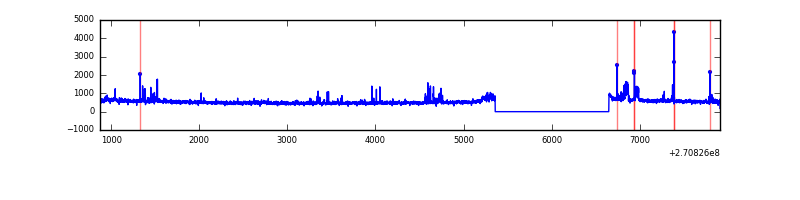 |
| C | 7039 | 5749 | 0 | 0 | 0.00% | 0.00% | 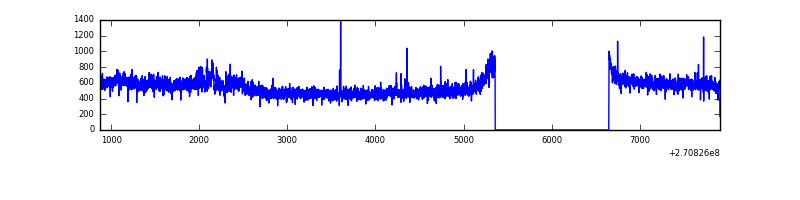 |
| D | 7039 | 5749 | 524 | 524 | 7.44% | 9.11% | 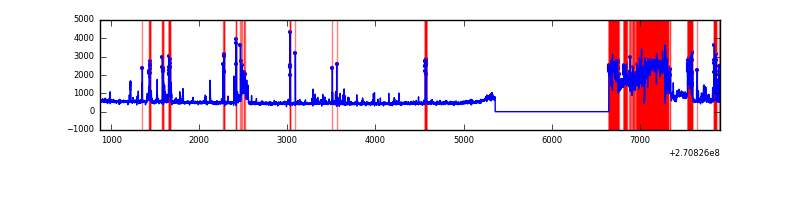 |
Top three noisy pixels from each quadrant. If the there are fewer than three noisy pixels in the level2.evt file, extra rows are filled as -1
| Pixel properties | Quadrant properties | ||||||
|---|---|---|---|---|---|---|---|
| Quadrant | DetID | PixID | Counts | Sigma | Mean | Median | Sigma |
| A | 4 | 2 | 10743 | 63.55 | 779 | 765 | 157.0 |
| A | 13 | 248 | 9429 | 55.18 | 779 | 765 | 157.0 |
| A | 0 | 226 | 7169 | 40.78 | 779 | 765 | 157.0 |
| B | 4 | 173 | 110515 | 760.11 | 762 | 745 | 144.4 |
| B | 4 | 48 | 36637 | 248.54 | 762 | 745 | 144.4 |
| B | 12 | 111 | 15673 | 103.37 | 762 | 745 | 144.4 |
| C | 3 | 233 | 234311 | 1387.67 | 738 | 744 | 168.3 |
| C | 8 | 222 | 5558 | 28.6 | 738 | 744 | 168.3 |
| C | 13 | 61 | 5338 | 27.29 | 738 | 744 | 168.3 |
| D | 1 | 255 | 1273774 | 7406.18 | 714 | 693 | 171.9 |
| D | 9 | 68 | 361031 | 2096.28 | 714 | 693 | 171.9 |
| D | 2 | 33 | 83256 | 480.31 | 714 | 693 | 171.9 |
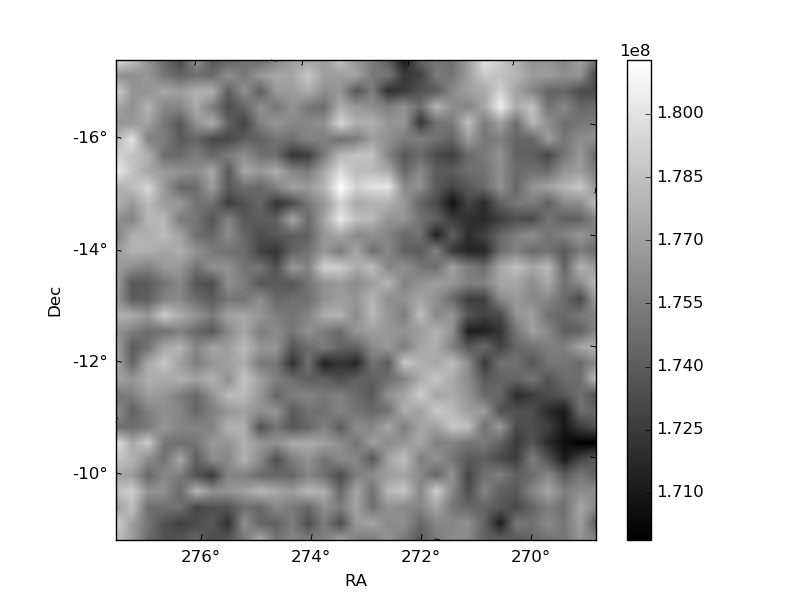
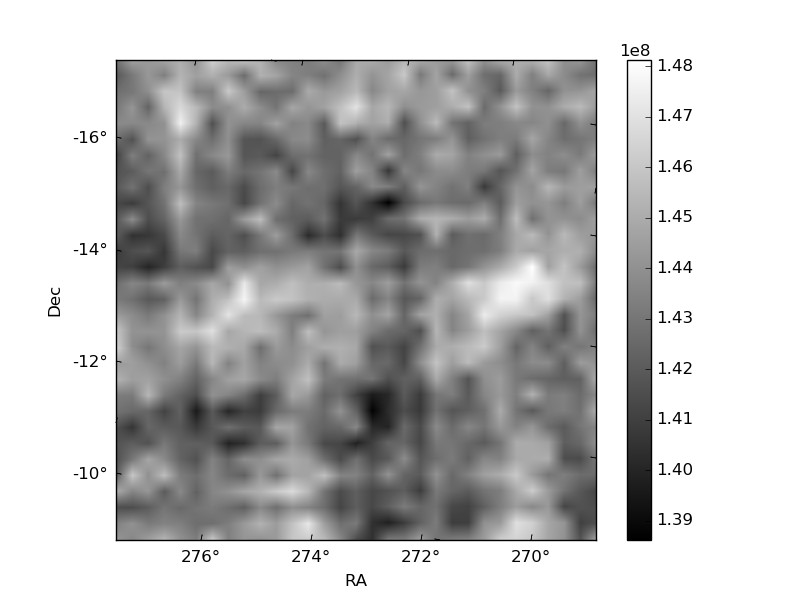
Histogram calculated using DETX and DETY for each event in the final _common_clean file
| Quadrant A | 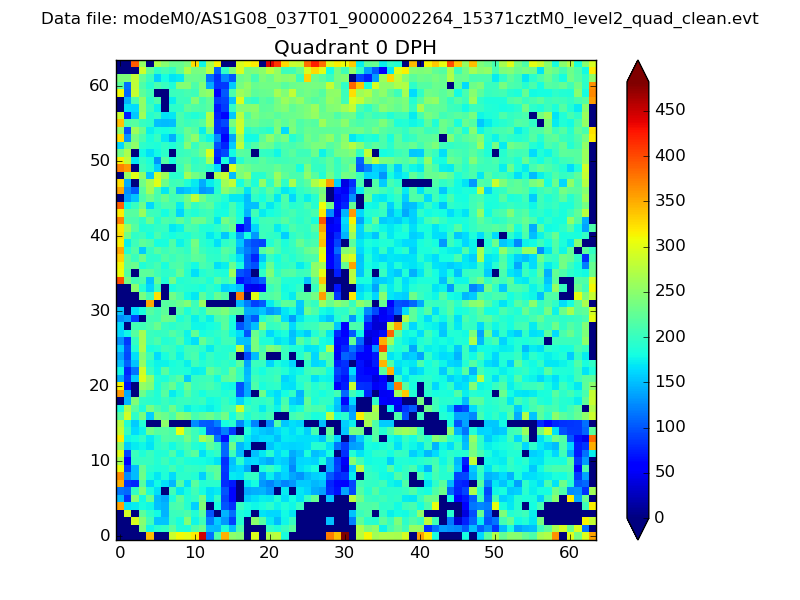 |
 |
Quadrant B |
|---|---|---|---|
| Quadrant D | 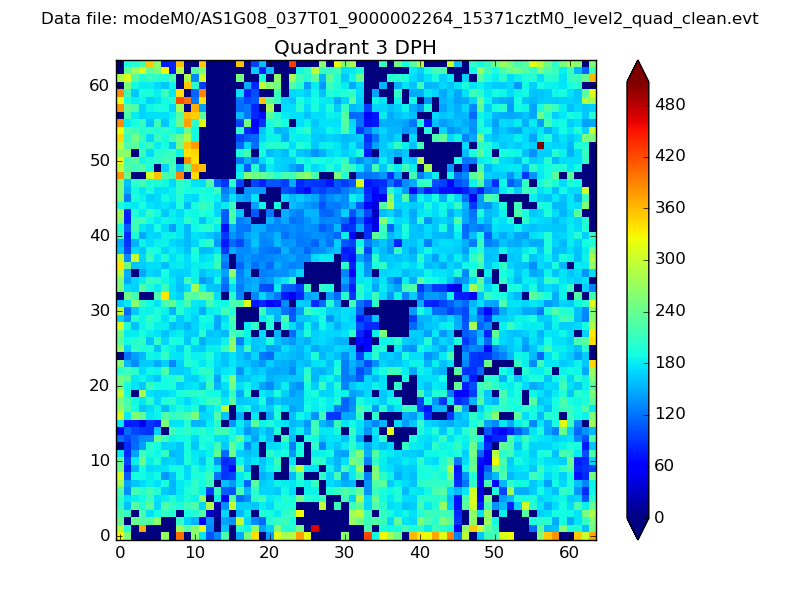 |
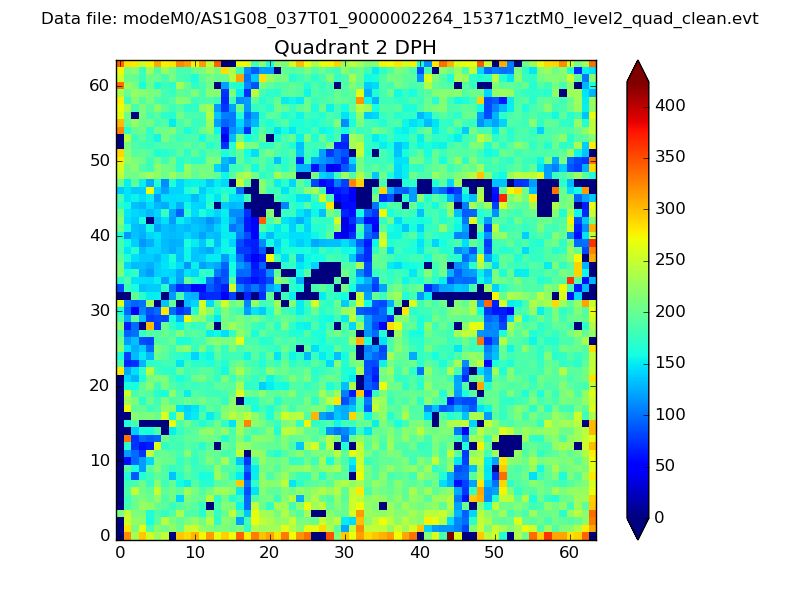 |
Quadrant C |
| Plot type | Count rate plots | Images |
|---|---|---|
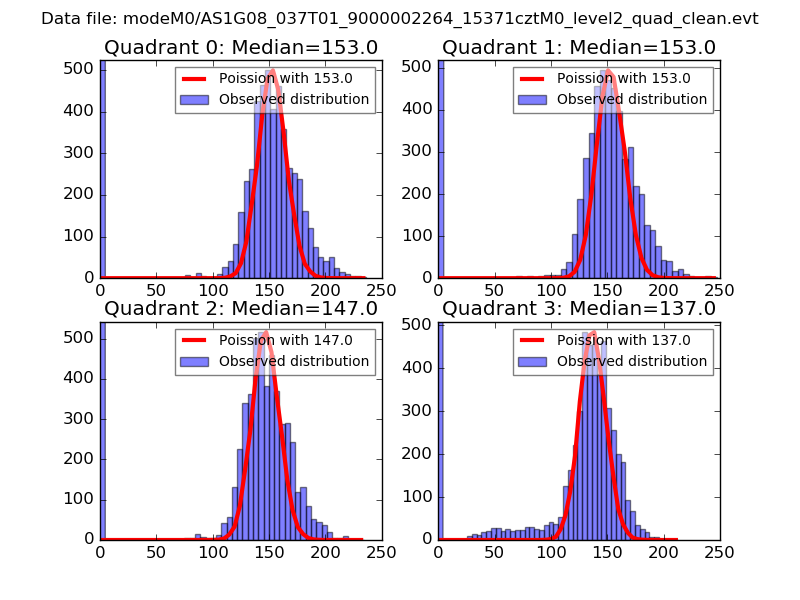
| Comparison with Poisson distribution Blue bars denote a histogram of data divided into 1 sec bins. Red curve is a Poisson curve with rate = median count rate of data. |
 |
 |
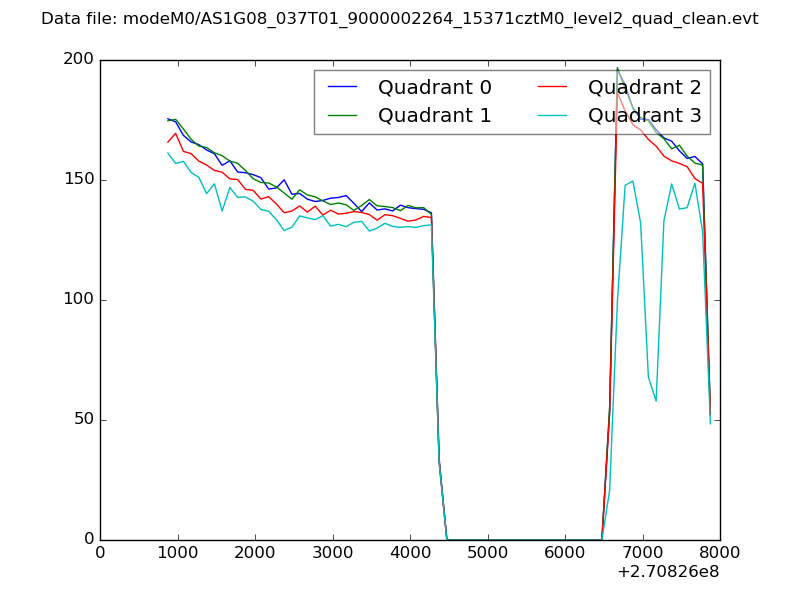
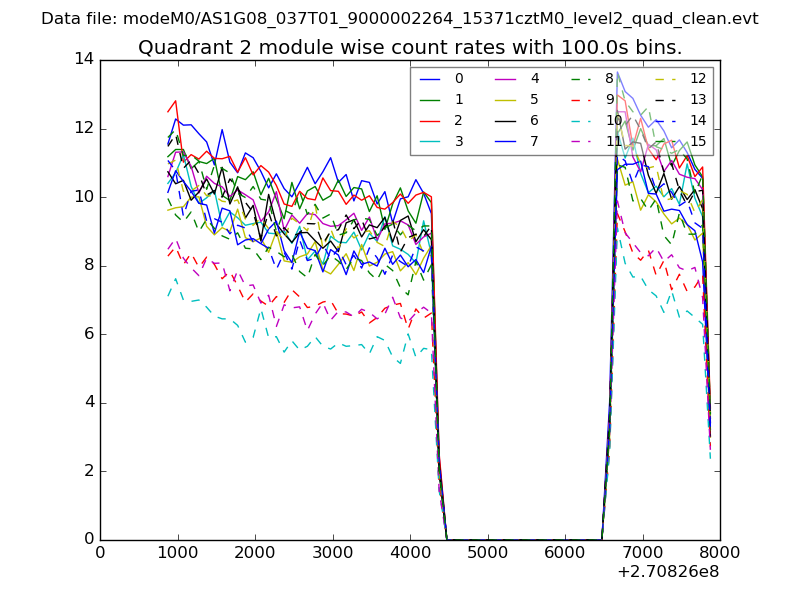
| Quadrant-wise count rates Data is divided into 100 sec bins |
 |
|
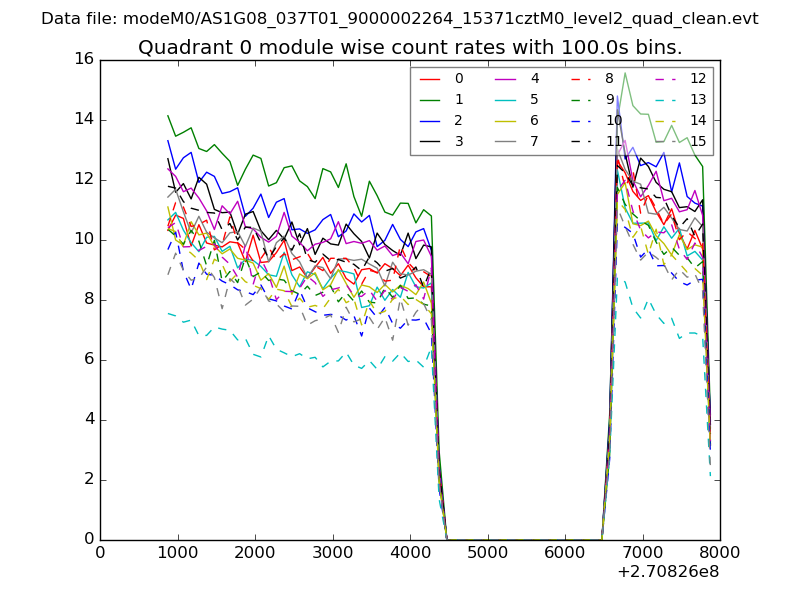
| Module-wise count rates for Quadrant A Data is divided into 100 sec bins |
 |
 |
| Module-wise count rates for Quadrant B Data is divided into 100 sec bins |
 |
 |
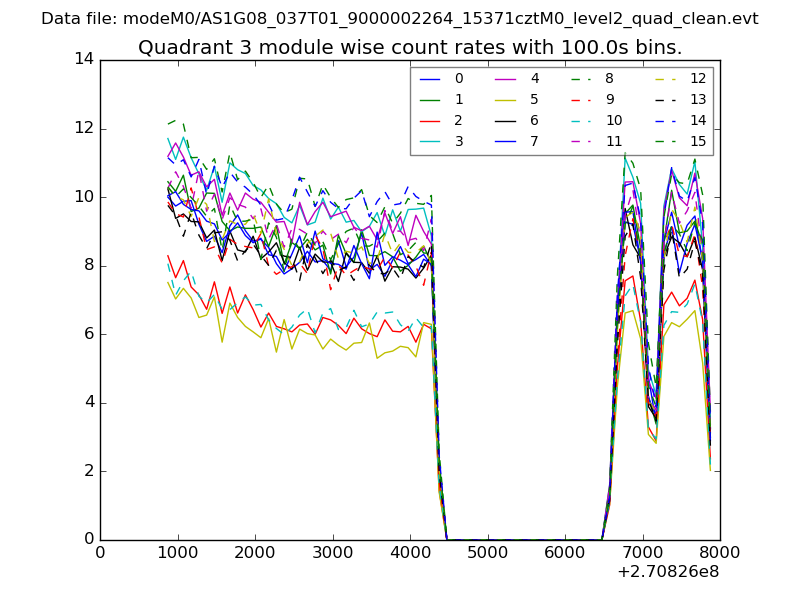
| Module-wise count rates for Quadrant C Data is divided into 100 sec bins |
 |
 |
| Module-wise count rates for Quadrant D Data is divided into 100 sec bins |
 |
 |
| Parameter | Plot |
|---|---|
| CZT HV Monitor | 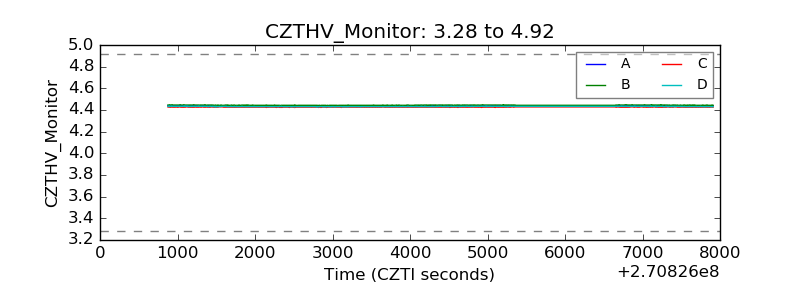 |
| D_VDD | 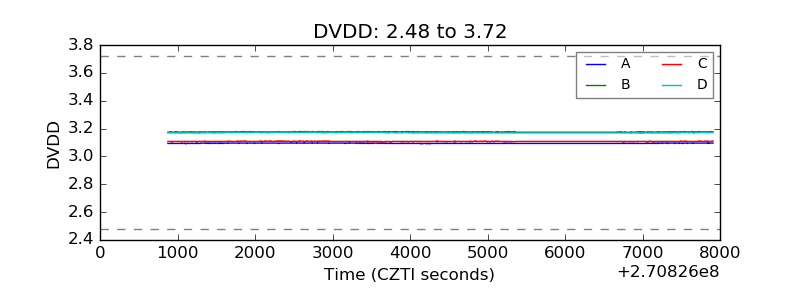 |
| Temperature 1 | 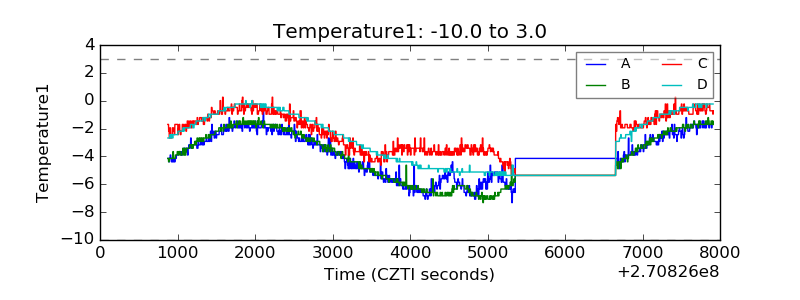 |
| Veto HV Monitor | 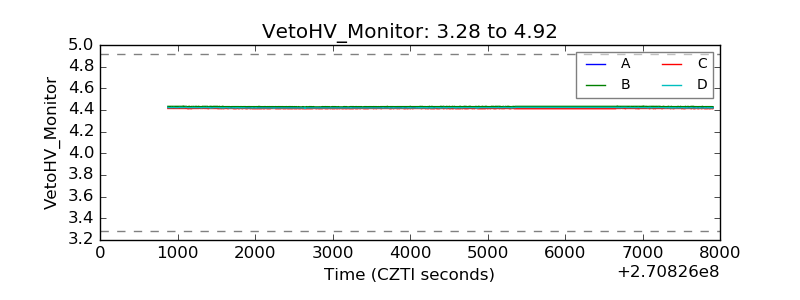 |
| Veto LLD | 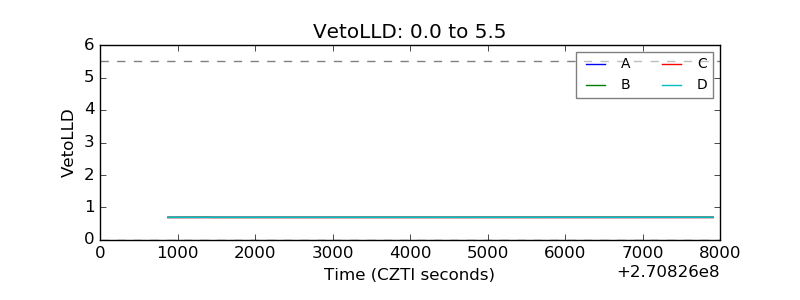 |
| Alpha Counter |  |
| _CPM_Rate | 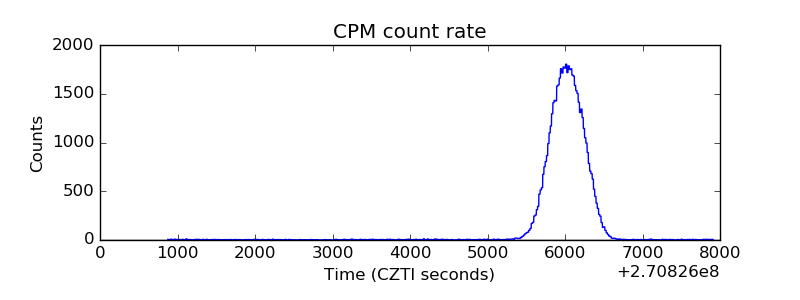 |
| CZT Counter |  |
| +2.5 Volts monitor | 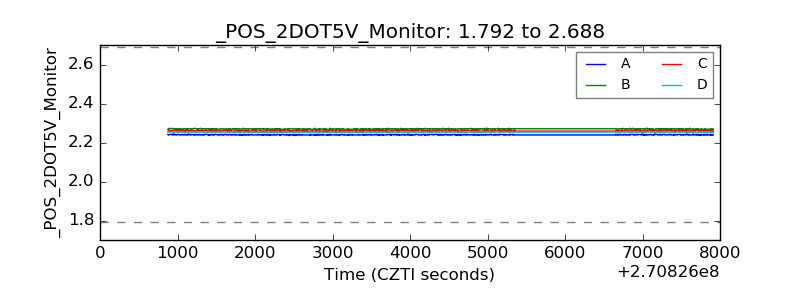 |
| +5 Volts monitor |  |
| _ROLL_ROT | 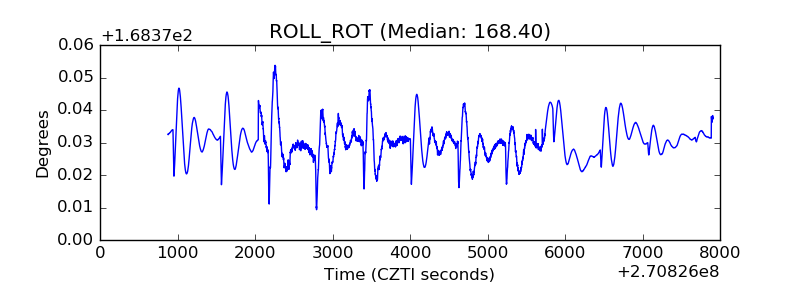 |
| _Roll_DEC | 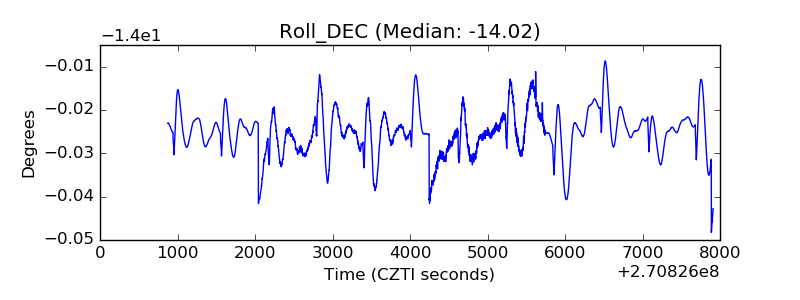 |
| _Roll_RA | 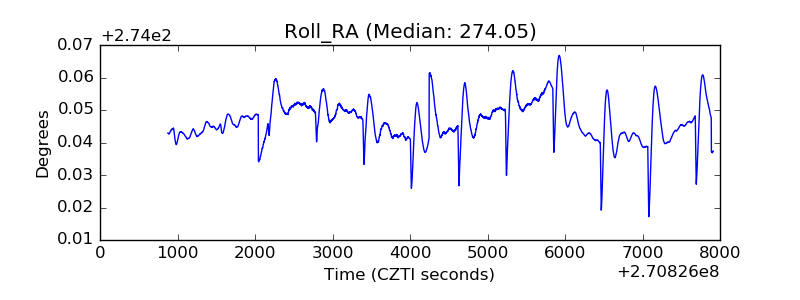 |
| Veto Counter | 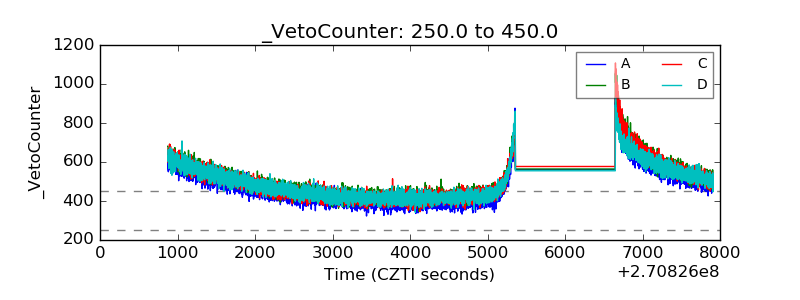 |