| Param | Original file | Final file |
|---|---|---|
| Filename | modeM0/AS1G08_037T01_9000002264_15372cztM0_level2.evt | modeM0/AS1G08_037T01_9000002264_15372cztM0_level2_quad_clean.evt |
| Size (bytes) | 403,692,480 | 83,010,240 |
| Size | 385.0 MB | 79.2 MB |
| Events in quadrant A | 2,623,797 | 561,026 |
| Events in quadrant B | 2,739,677 | 558,736 |
| Events in quadrant C | 2,671,187 | 540,716 |
| Events in quadrant D | 3,843,897 | 495,303 |
| Mode M9 | |||
|---|---|---|---|
| Quadrant | BADHDUFLAG | Total packets | Discarded packets |
| A | 0 | 13 | 0 |
| B | 0 | 13 | 0 |
| C | 0 | 13 | 0 |
| D | 0 | 13 | 0 |
| Mode M0 | |||
|---|---|---|---|
| Quadrant | BADHDUFLAG | Total packets | Discarded packets |
| A | 0 | 11020 | 1 |
| B | 0 | 11383 | 1 |
| C | 0 | 11118 | 1 |
| D | 0 | 14913 | 1 |
| Mode SS | |||
|---|---|---|---|
| Quadrant | BADHDUFLAG | Total packets | Discarded packets |
| A | 0 | 102 | 0 |
| B | 0 | 102 | 0 |
| C | 0 | 102 | 0 |
| D | 0 | 102 | 0 |
| Quadrant | Total seconds | Saturated seconds | Saturation percentage |
|---|---|---|---|
| A | 5113 | 108 | 2.112263% |
| B | 5113 | 114 | 2.229611% |
| C | 5113 | 68 | 1.329943% |
| D | 5113 | 462 | 9.035791% |
Noise dominated data is calculated using 1-second bins in cleaned event files. If a bin has >2000 counts, and if more than 50% of those come from <1% of pixels, then it is considered to be noise-dominated and hence unusable.
| Quadrant | # 1 sec bins | Bins with >0 counts | Bins with >2000 counts | High rate bins dominated by noise | Noise dominated (total time) | Noise dominated (detector-on time) | Marked lightcurve |
|---|---|---|---|---|---|---|---|
| A | 6394 | 5114 | 7 | 7 | 0.11% | 0.14% | 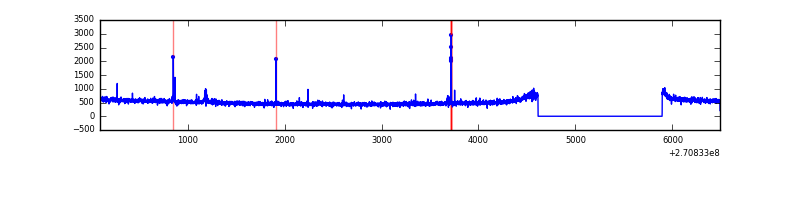 |
| B | 6394 | 5115 | 10 | 10 | 0.16% | 0.20% | 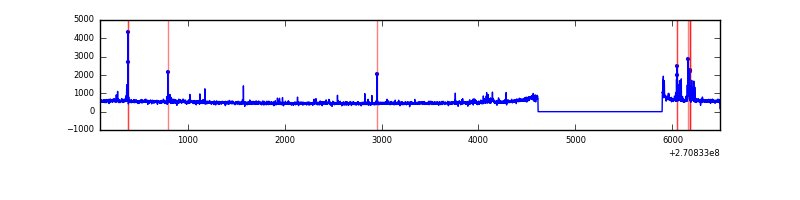 |
| C | 6394 | 5114 | 0 | 0 | 0.00% | 0.00% | 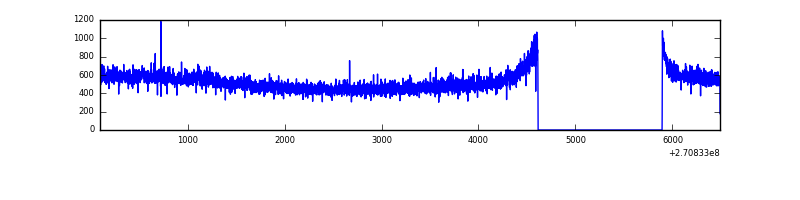 |
| D | 6394 | 5114 | 345 | 345 | 5.40% | 6.75% | 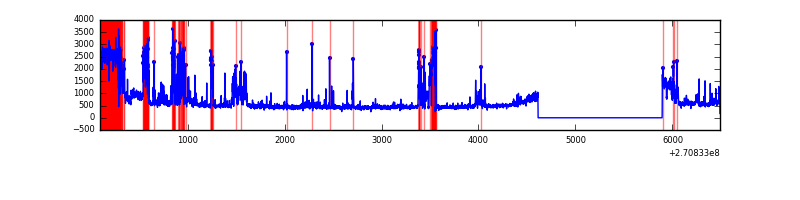 |
Top three noisy pixels from each quadrant. If the there are fewer than three noisy pixels in the level2.evt file, extra rows are filled as -1
| Pixel properties | Quadrant properties | ||||||
|---|---|---|---|---|---|---|---|
| Quadrant | DetID | PixID | Counts | Sigma | Mean | Median | Sigma |
| A | 15 | 239 | 20720 | 149.52 | 673 | 662 | 134.2 |
| A | 13 | 248 | 14308 | 101.72 | 673 | 662 | 134.2 |
| A | 0 | 226 | 6005 | 39.83 | 673 | 662 | 134.2 |
| B | 4 | 48 | 80386 | 636.11 | 662 | 647 | 125.4 |
| B | 4 | 173 | 20151 | 155.59 | 662 | 647 | 125.4 |
| B | 12 | 111 | 13944 | 106.08 | 662 | 647 | 125.4 |
| C | 3 | 233 | 169701 | 1142.72 | 641 | 645 | 147.9 |
| C | 13 | 61 | 4656 | 27.11 | 641 | 645 | 147.9 |
| C | 7 | 247 | 1700 | 7.13 | 641 | 645 | 147.9 |
| D | 1 | 255 | 785864 | 5095.12 | 626 | 606 | 154.1 |
| D | 9 | 68 | 384783 | 2492.72 | 626 | 606 | 154.1 |
| D | 10 | 199 | 111744 | 721.11 | 626 | 606 | 154.1 |
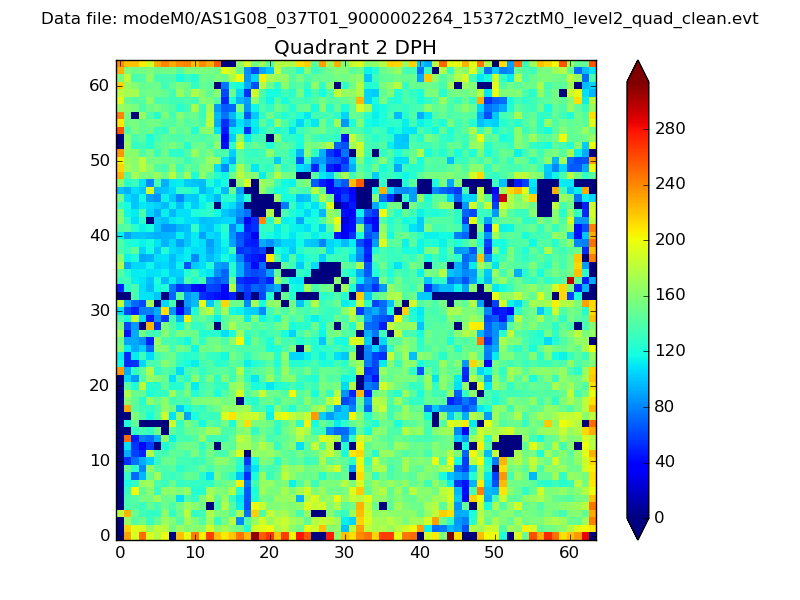
Histogram calculated using DETX and DETY for each event in the final _common_clean file
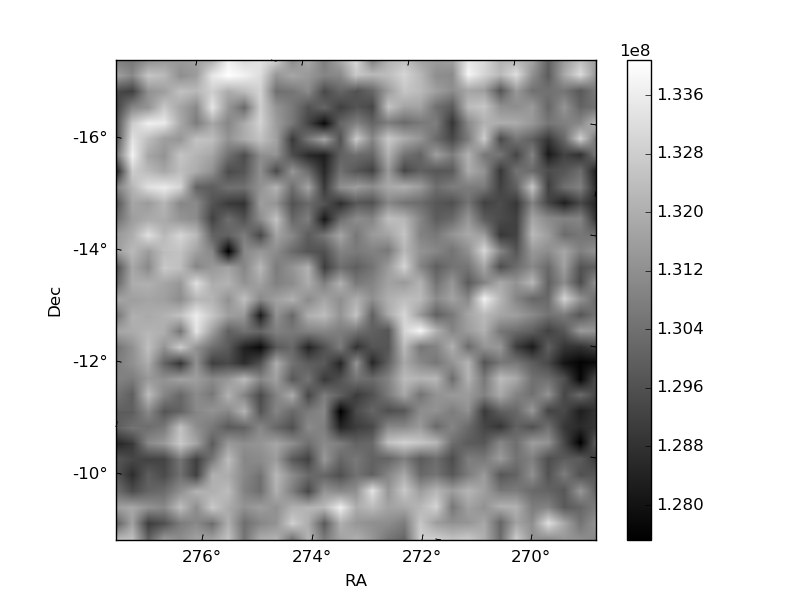
| Quadrant A |  |
 |
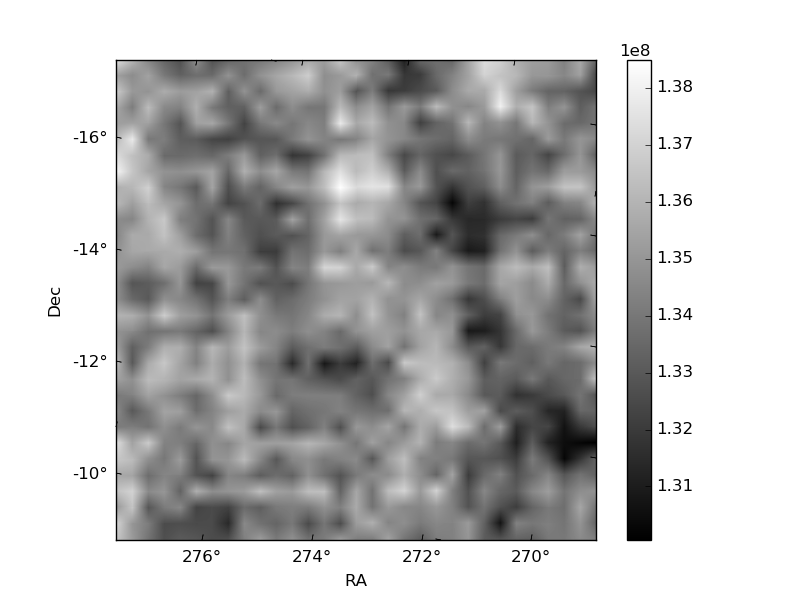
Quadrant B |
|---|---|---|---|
| Quadrant D | 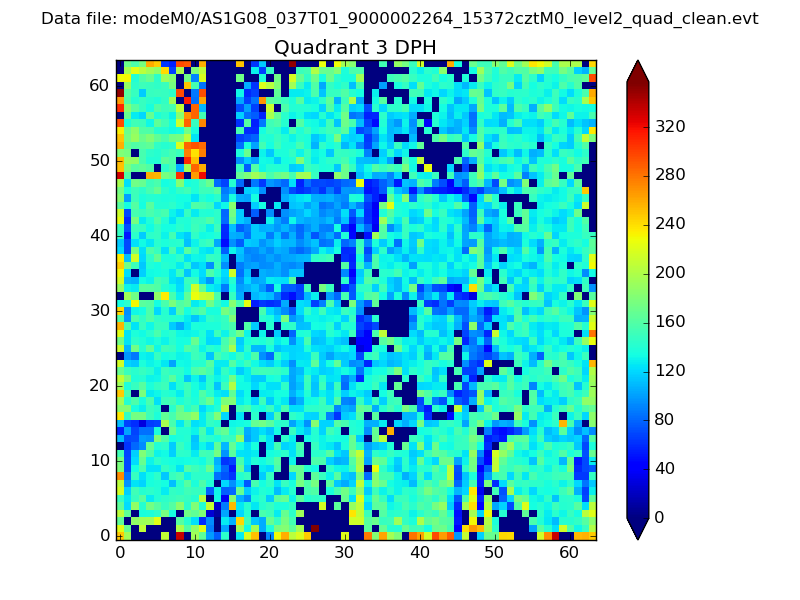 |
 |
Quadrant C |
| Plot type | Count rate plots | Images |
|---|---|---|
| Comparison with Poisson distribution Blue bars denote a histogram of data divided into 1 sec bins. Red curve is a Poisson curve with rate = median count rate of data. |
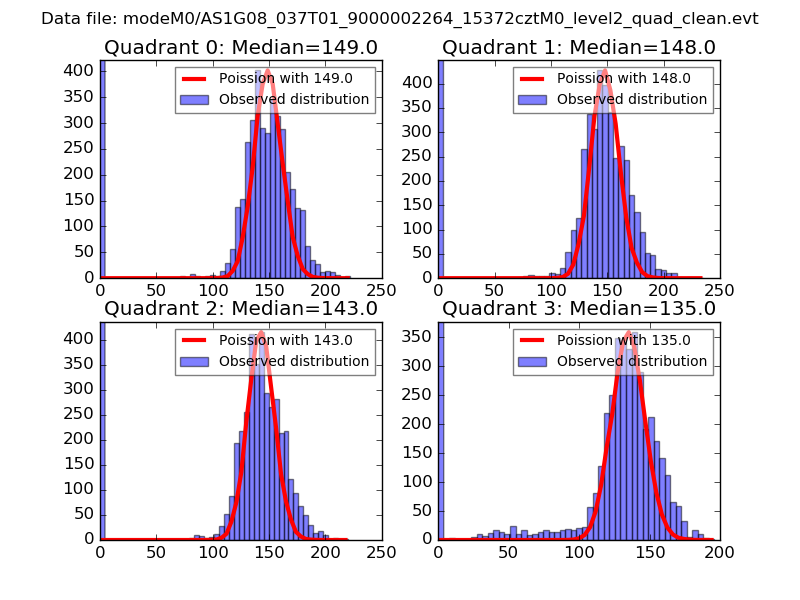 |
 |
| Quadrant-wise count rates Data is divided into 100 sec bins |
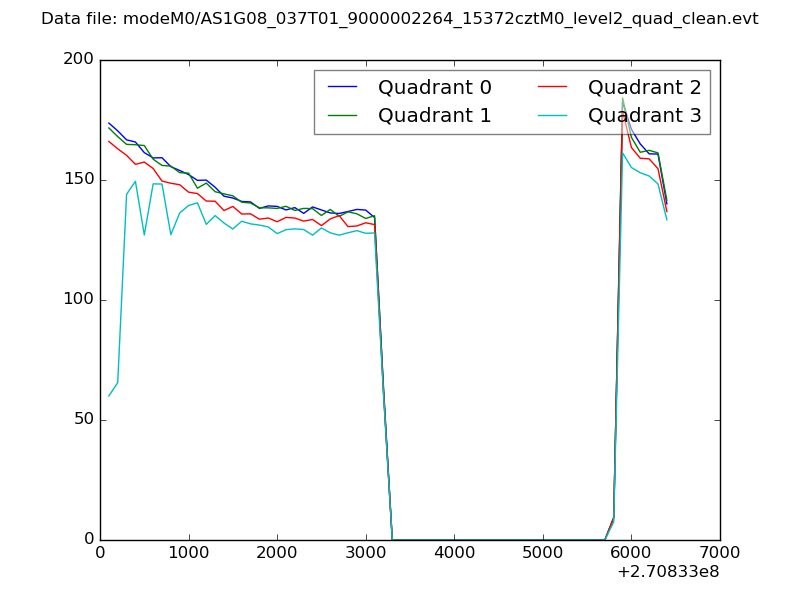 |
|
| Module-wise count rates for Quadrant A Data is divided into 100 sec bins |
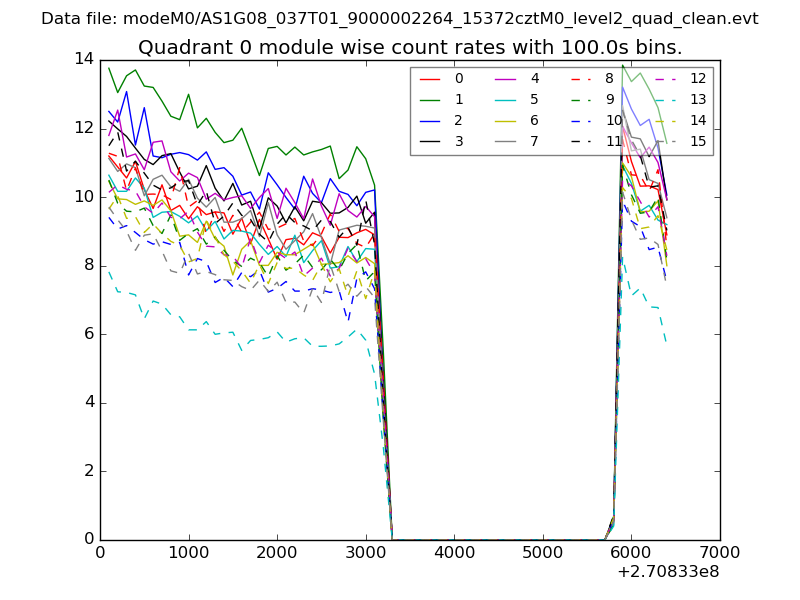 |
 |
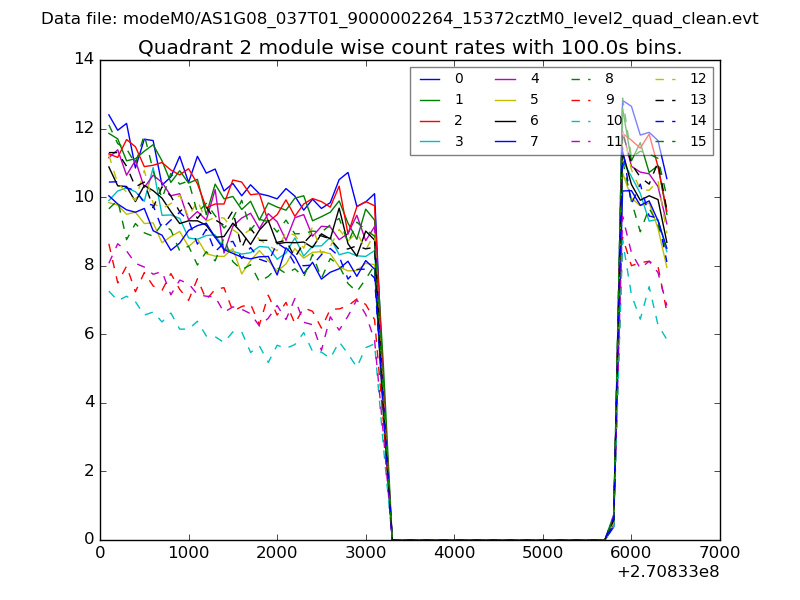
| Module-wise count rates for Quadrant B Data is divided into 100 sec bins |
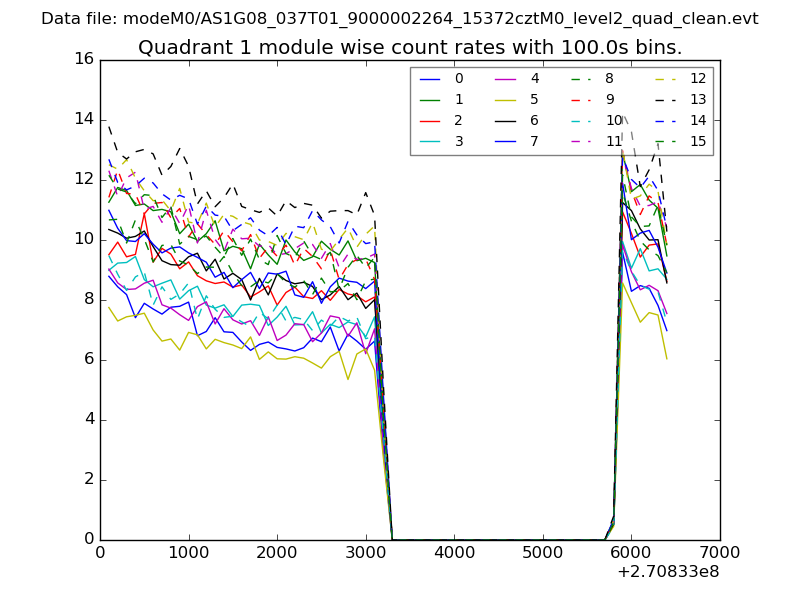 |
 |
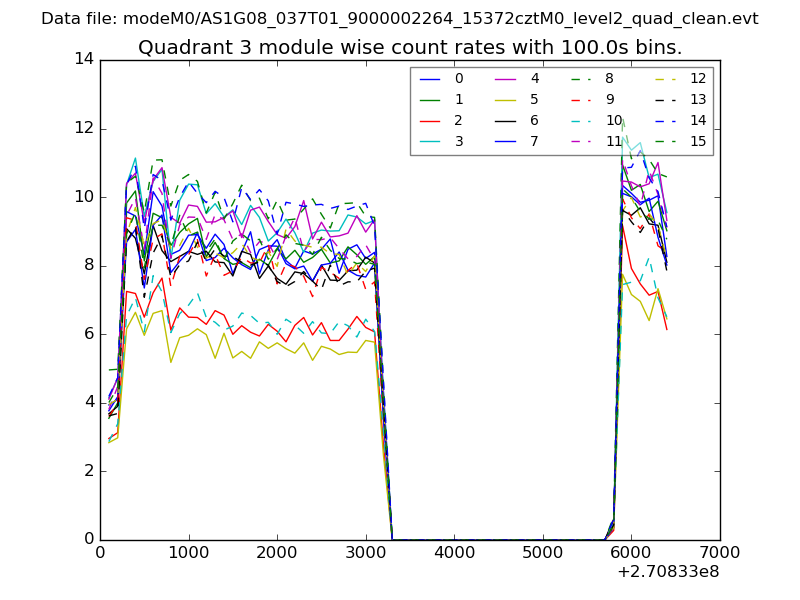
| Module-wise count rates for Quadrant C Data is divided into 100 sec bins |
 |
 |
| Module-wise count rates for Quadrant D Data is divided into 100 sec bins |
 |
 |
| Parameter | Plot |
|---|---|
| CZT HV Monitor |  |
| D_VDD | 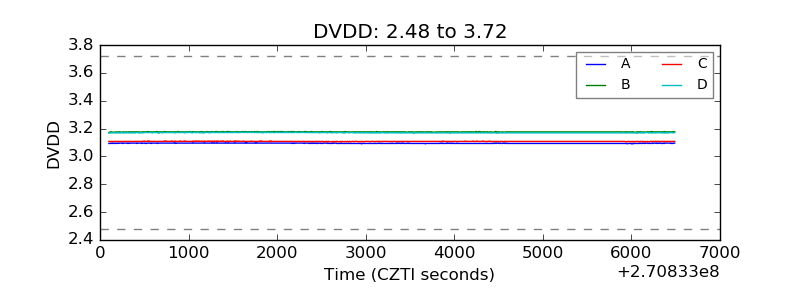 |
| Temperature 1 |  |
| Veto HV Monitor | 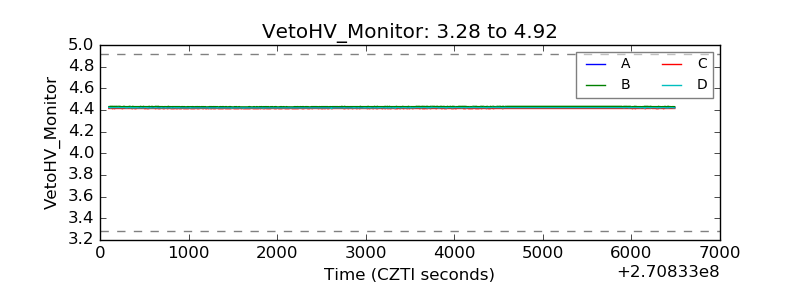 |
| Veto LLD | 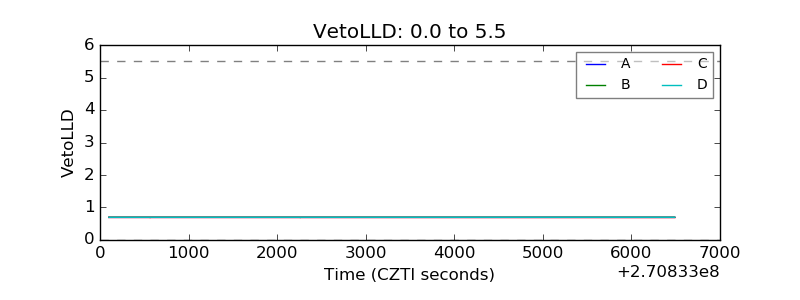 |
| Alpha Counter | 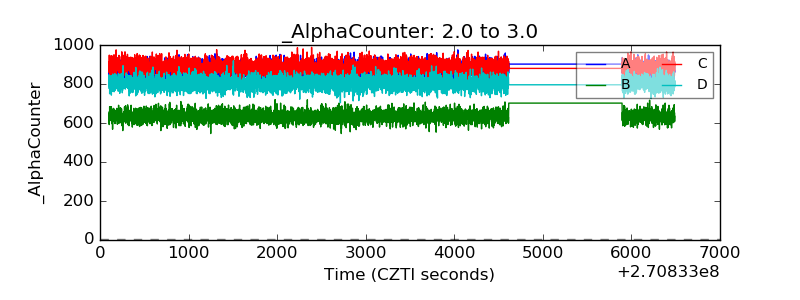 |
| _CPM_Rate | 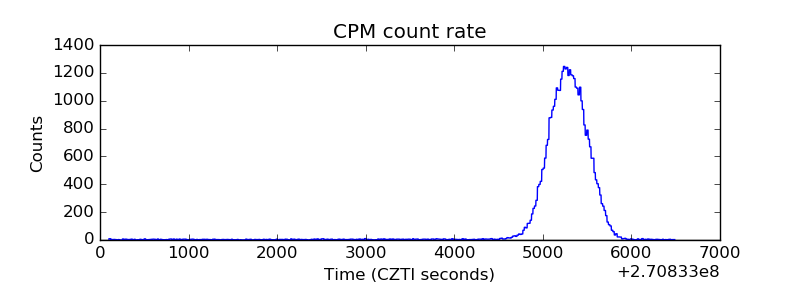 |
| CZT Counter |  |
| +2.5 Volts monitor |  |
| +5 Volts monitor |  |
| _ROLL_ROT |  |
| _Roll_DEC | 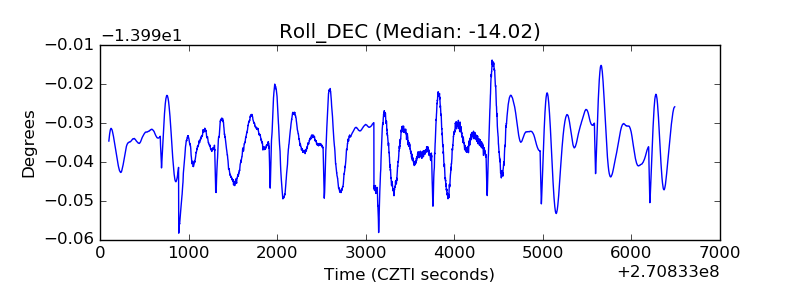 |
| _Roll_RA | 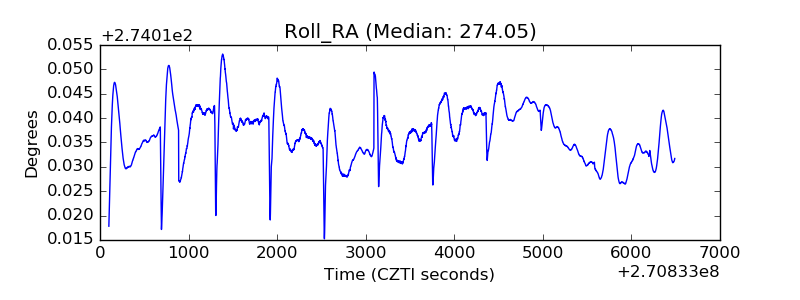 |
| Veto Counter | 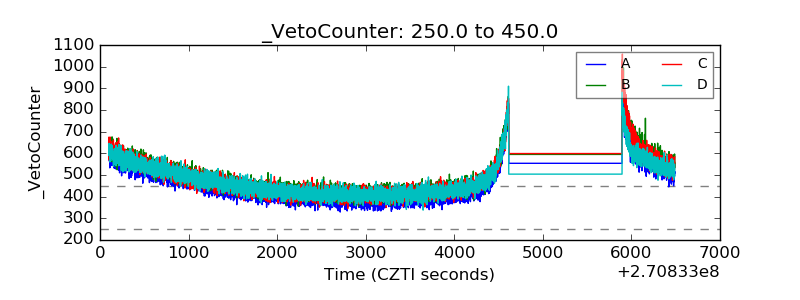 |