| Param | Original file | Final file |
|---|---|---|
| Filename | modeM0/AS1G08_037T01_9000002264_15373cztM0_level2.evt | modeM0/AS1G08_037T01_9000002264_15373cztM0_level2_quad_clean.evt |
| Size (bytes) | 54,887,040 | 14,342,400 |
| Size | 52.3 MB | 13.7 MB |
| Events in quadrant A | 362,889 | 98,948 |
| Events in quadrant B | 428,403 | 98,939 |
| Events in quadrant C | 359,791 | 96,075 |
| Events in quadrant D | 467,811 | 90,951 |
| Mode M9 | |||
|---|---|---|---|
| Quadrant | BADHDUFLAG | Total packets | Discarded packets |
| A | 0 | 4 | 0 |
| B | 0 | 4 | 0 |
| C | 0 | 4 | 0 |
| D | 0 | 5 | 0 |
| Mode M0 | |||
|---|---|---|---|
| Quadrant | BADHDUFLAG | Total packets | Discarded packets |
| A | 0 | 1467 | 1 |
| B | 0 | 1699 | 1 |
| C | 0 | 1455 | 1 |
| D | 0 | 1798 | 1 |
| Mode SS | |||
|---|---|---|---|
| Quadrant | BADHDUFLAG | Total packets | Discarded packets |
| A | 0 | 10 | 0 |
| B | 0 | 10 | 0 |
| C | 0 | 10 | 0 |
| D | 0 | 10 | 0 |
| Quadrant | Total seconds | Saturated seconds | Saturation percentage |
|---|---|---|---|
| A | 596 | 6 | 1.006711% |
| B | 596 | 25 | 4.194631% |
| C | 596 | 6 | 1.006711% |
| D | 596 | 25 | 4.194631% |
Noise dominated data is calculated using 1-second bins in cleaned event files. If a bin has >2000 counts, and if more than 50% of those come from <1% of pixels, then it is considered to be noise-dominated and hence unusable.
| Quadrant | # 1 sec bins | Bins with >0 counts | Bins with >2000 counts | High rate bins dominated by noise | Noise dominated (total time) | Noise dominated (detector-on time) | Marked lightcurve |
|---|---|---|---|---|---|---|---|
| A | 597 | 597 | 0 | 0 | 0.00% | 0.00% | 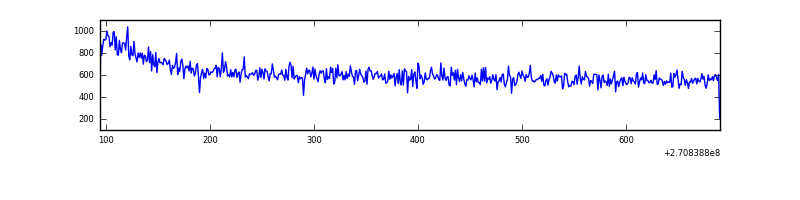 |
| B | 597 | 597 | 6 | 6 | 1.01% | 1.01% | 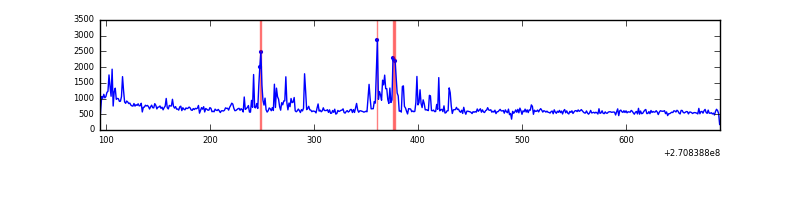 |
| C | 597 | 597 | 0 | 0 | 0.00% | 0.00% | 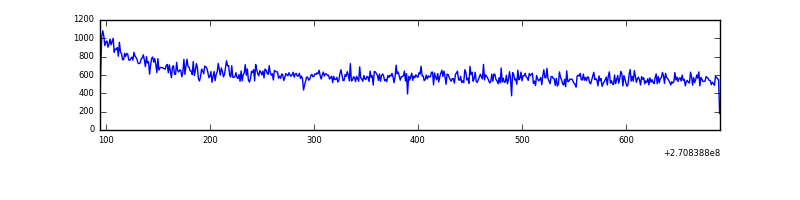 |
| D | 597 | 597 | 4 | 4 | 0.67% | 0.67% | 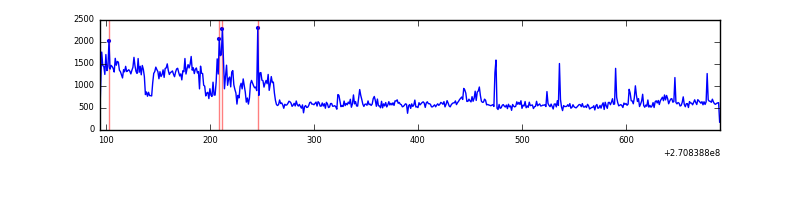 |
Top three noisy pixels from each quadrant. If the there are fewer than three noisy pixels in the level2.evt file, extra rows are filled as -1
| Pixel properties | Quadrant properties | ||||||
|---|---|---|---|---|---|---|---|
| Quadrant | DetID | PixID | Counts | Sigma | Mean | Median | Sigma |
| A | 0 | 226 | 857 | 36.92 | 94 | 92 | 20.7 |
| A | 9 | 143 | 756 | 32.05 | 94 | 92 | 20.7 |
| A | 12 | 194 | 732 | 30.89 | 94 | 92 | 20.7 |
| B | 4 | 48 | 61659 | 3163.84 | 91 | 89 | 19.5 |
| B | 0 | 245 | 2928 | 145.89 | 91 | 89 | 19.5 |
| B | 12 | 111 | 2025 | 99.48 | 91 | 89 | 19.5 |
| C | 3 | 233 | 11901 | 523.56 | 89 | 89 | 22.6 |
| C | 13 | 61 | 616 | 23.36 | 89 | 89 | 22.6 |
| C | 0 | 207 | 271 | 8.07 | 89 | 89 | 22.6 |
| D | 1 | 255 | 77959 | 3198.31 | 90 | 87 | 24.3 |
| D | 9 | 68 | 15696 | 641.08 | 90 | 87 | 24.3 |
| D | 2 | 33 | 10835 | 441.43 | 90 | 87 | 24.3 |
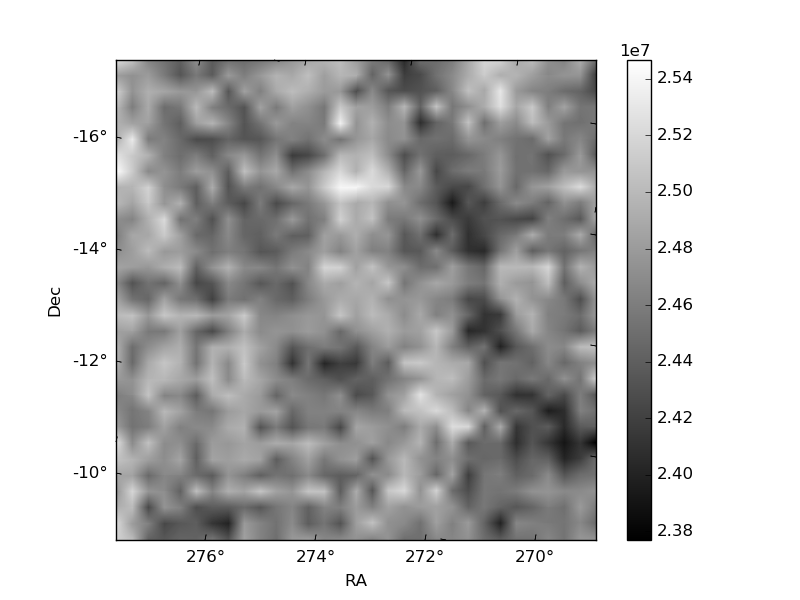
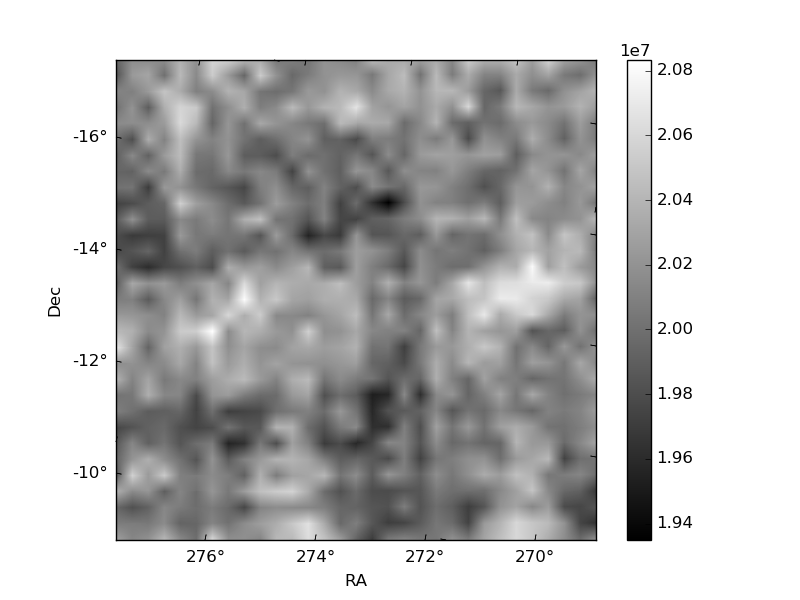
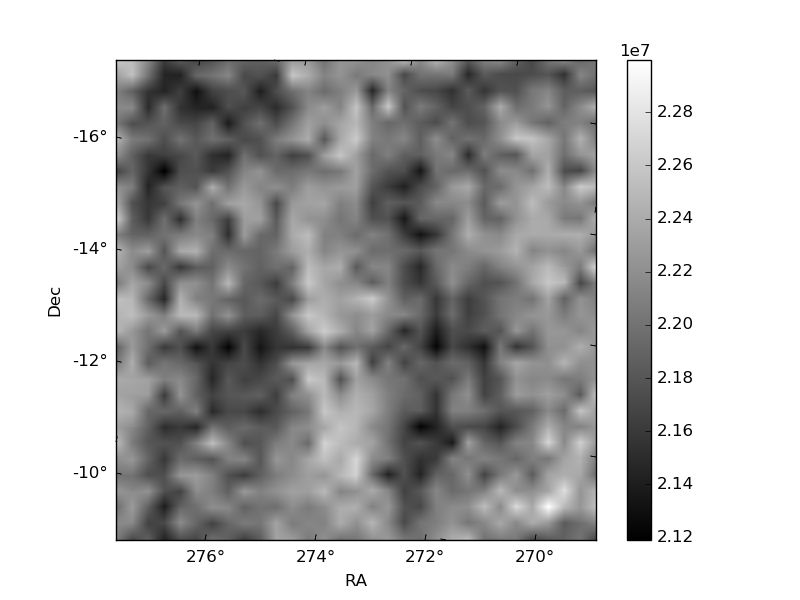
Histogram calculated using DETX and DETY for each event in the final _common_clean file
| Quadrant A | 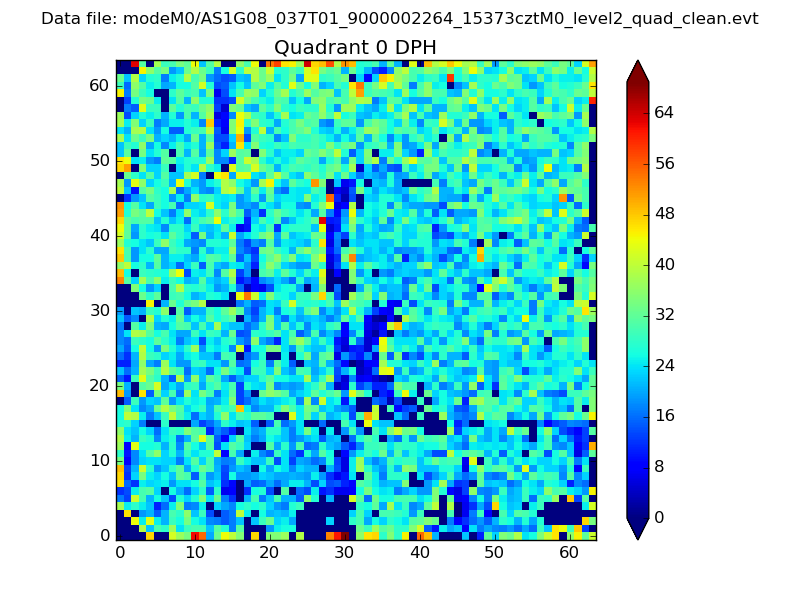 |
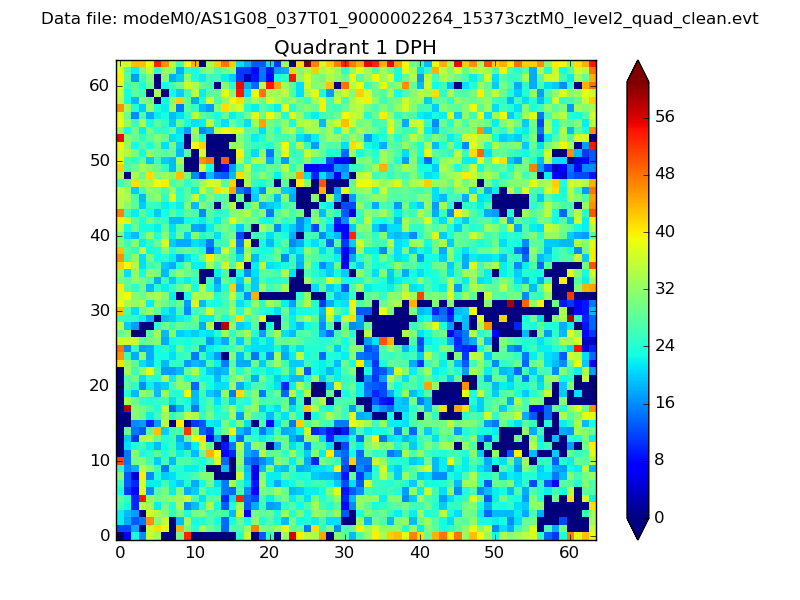 |
Quadrant B |
|---|---|---|---|
| Quadrant D | 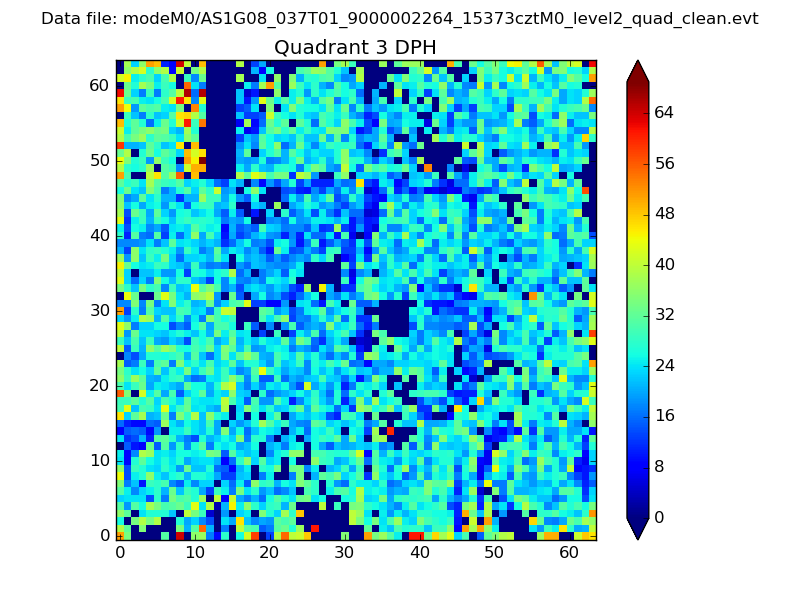 |
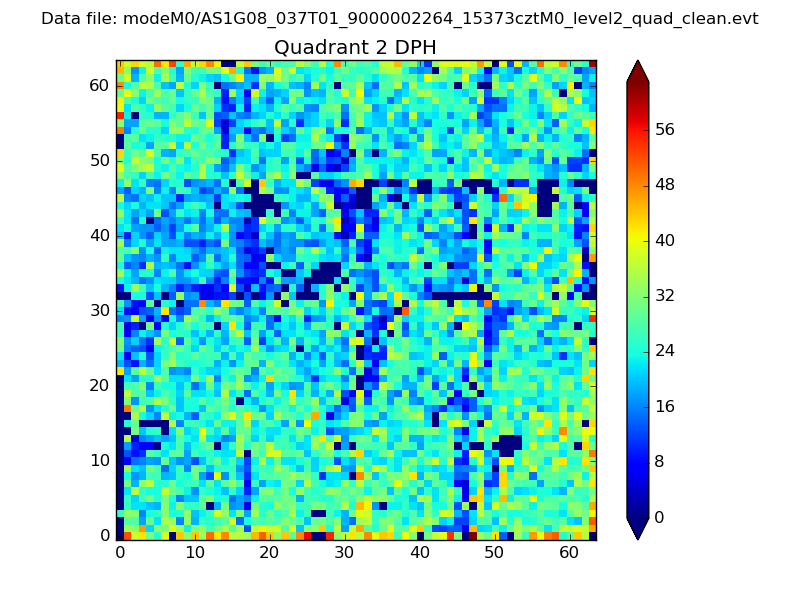 |
Quadrant C |
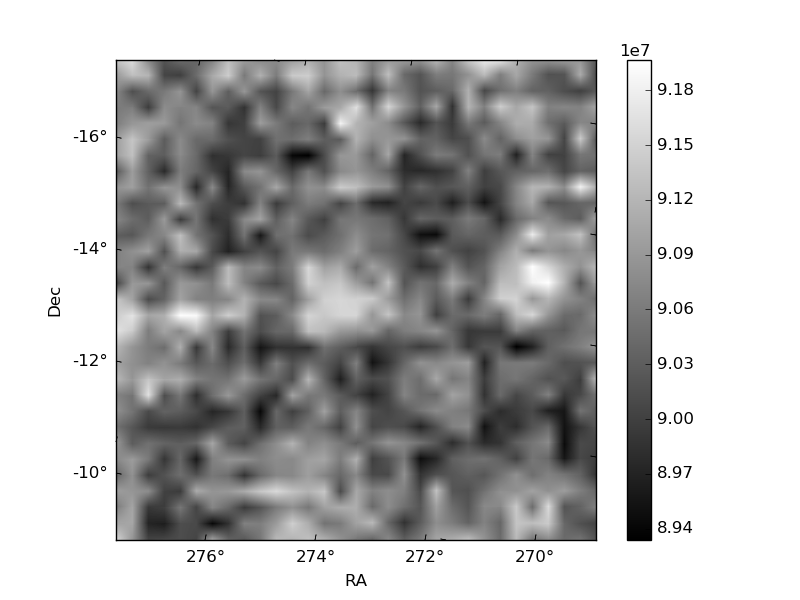
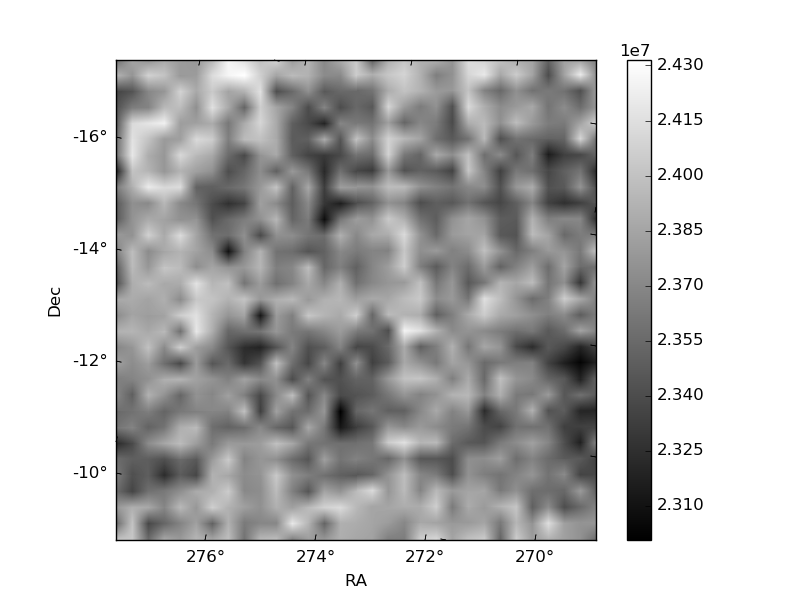
| Plot type | Count rate plots | Images |
|---|---|---|
| Comparison with Poisson distribution Blue bars denote a histogram of data divided into 1 sec bins. Red curve is a Poisson curve with rate = median count rate of data. |
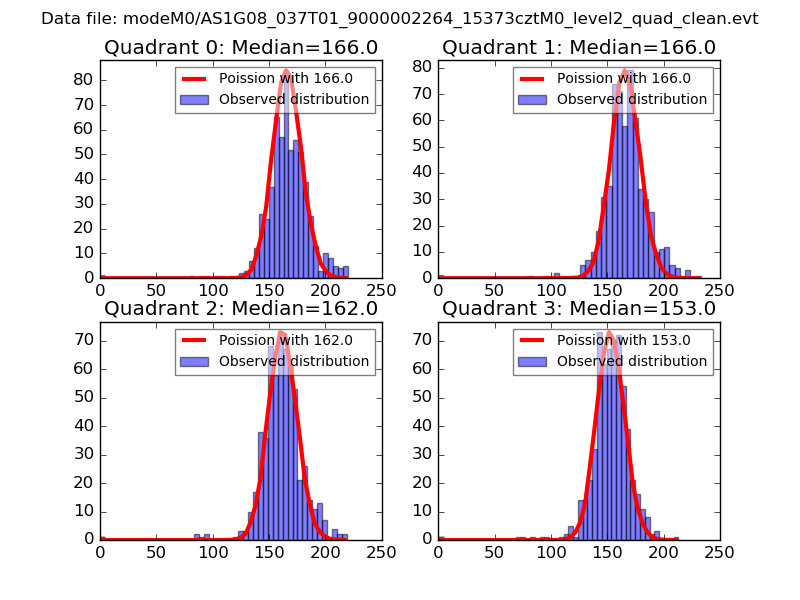 |
 |
| Quadrant-wise count rates Data is divided into 100 sec bins |
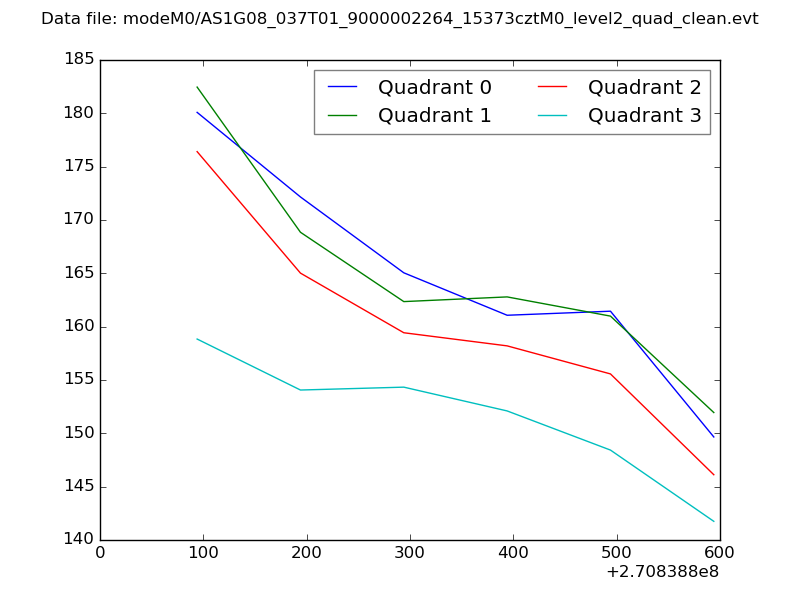 |
|
| Module-wise count rates for Quadrant A Data is divided into 100 sec bins |
 |
 |
| Module-wise count rates for Quadrant B Data is divided into 100 sec bins |
 |
 |
| Module-wise count rates for Quadrant C Data is divided into 100 sec bins |
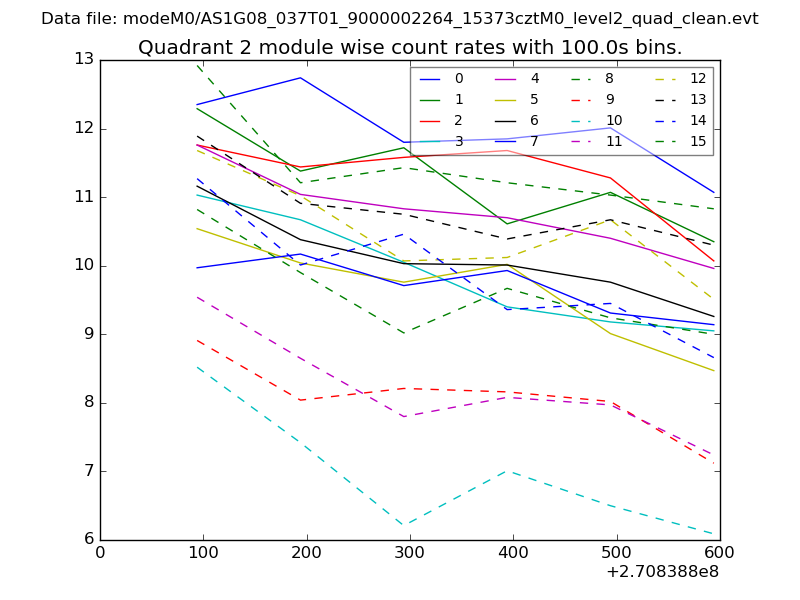 |
 |
| Module-wise count rates for Quadrant D Data is divided into 100 sec bins |
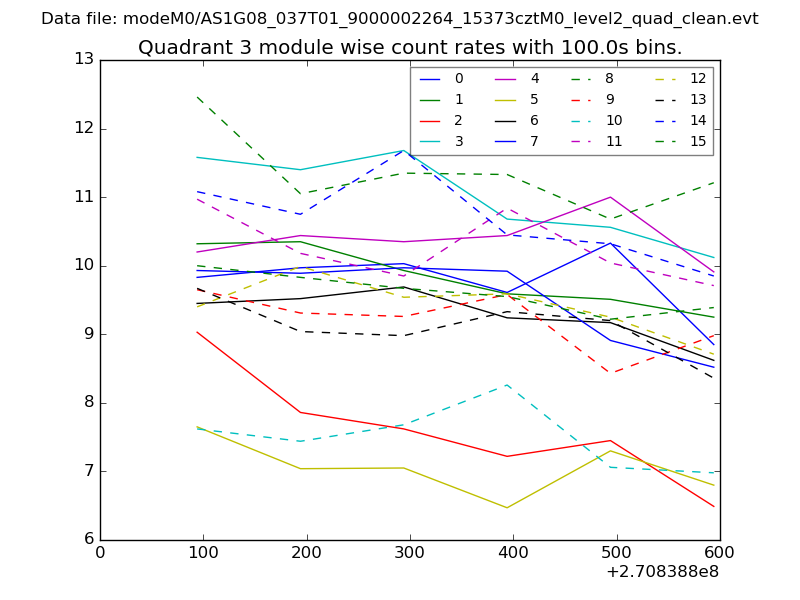 |
 |
| Parameter | Plot |
|---|---|
| CZT HV Monitor |  |
| D_VDD | 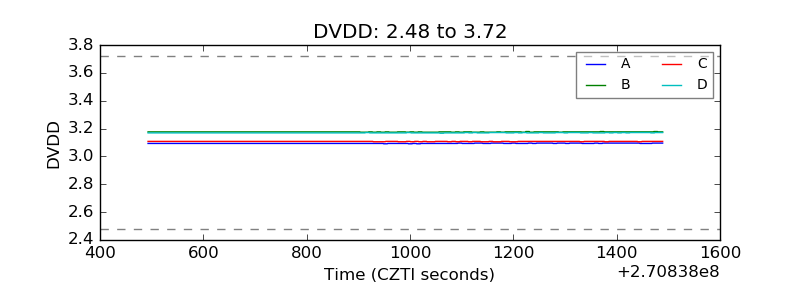 |
| Temperature 1 | 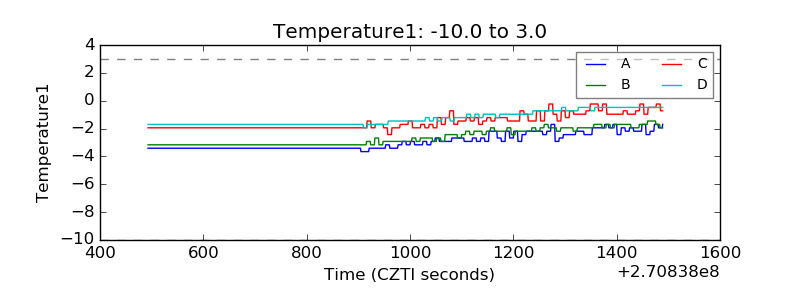 |
| Veto HV Monitor | 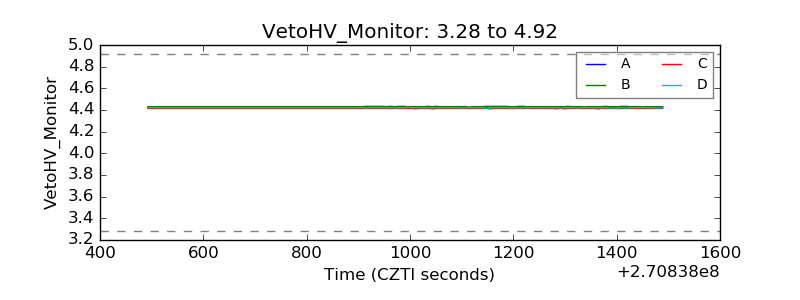 |
| Veto LLD | 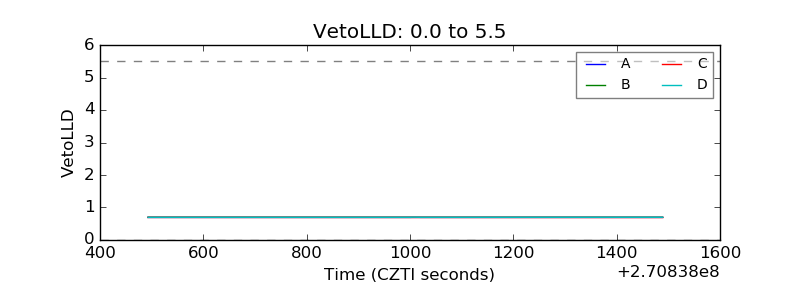 |
| Alpha Counter | 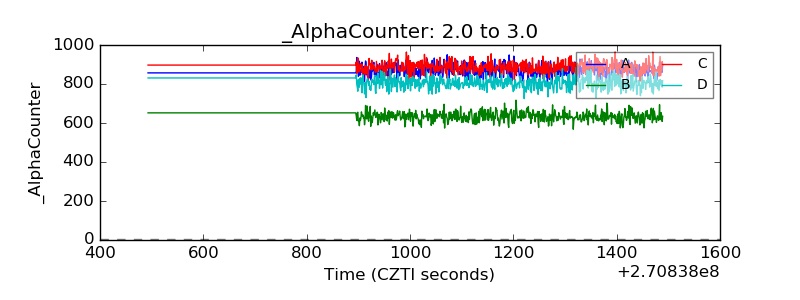 |
| _CPM_Rate | 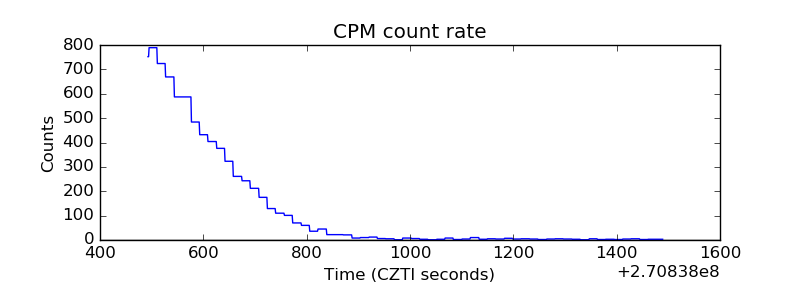 |
| CZT Counter | 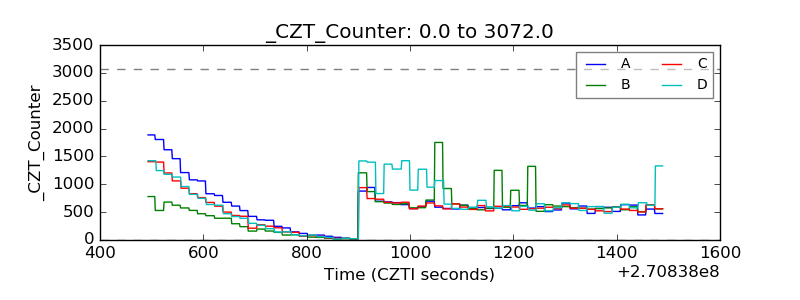 |
| +2.5 Volts monitor |  |
| +5 Volts monitor | 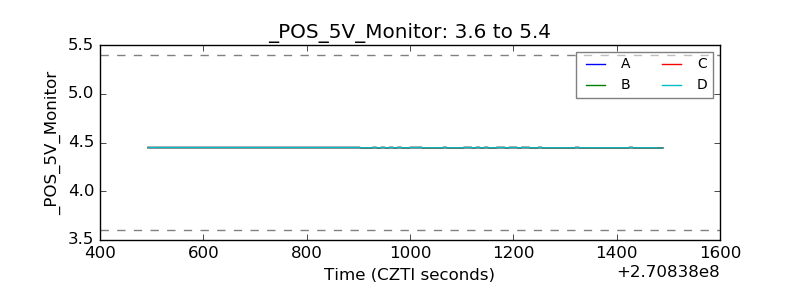 |
| _ROLL_ROT | 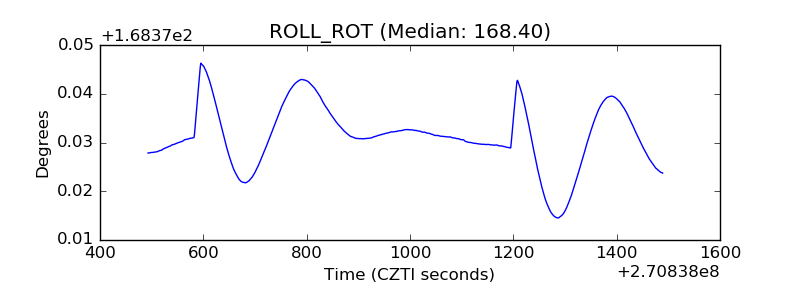 |
| _Roll_DEC | 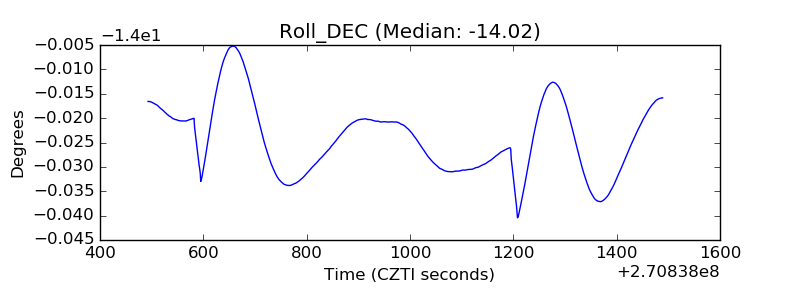 |
| _Roll_RA | 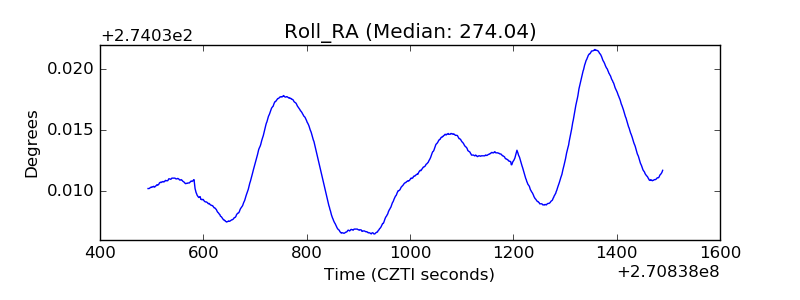 |
| Veto Counter | 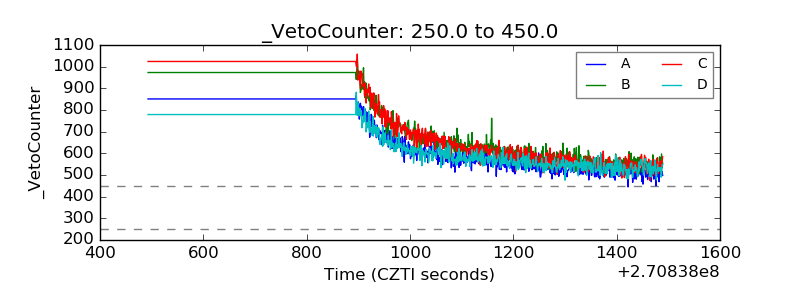 |