| Param | Original file | Final file |
|---|---|---|
| Filename | modeM0/AS1C03_001T01_9000002270cztM0_level2.fits | modeM0/AS1C03_001T01_9000002270cztM0_level2_quad_clean.evt |
| Size (bytes) | 772,329,600 | 796,478,400 |
| Size | 736.6 MB | 759.6 MB |
| Events in quadrant A | 4,686,710 | 5,046,367 |
| Events in quadrant B | 4,455,104 | 4,854,508 |
| Events in quadrant C | 4,750,388 | 4,995,809 |
| Events in quadrant D | 3,713,866 | 3,453,114 |
| Mode SS | |||
|---|---|---|---|
| Quadrant | BADHDUFLAG | Total packets | Discarded packets |
| A | 0 | 1714 | 0 |
| B | 0 | 1714 | 0 |
| C | 0 | 1714 | 0 |
| D | 0 | 1714 | 0 |
| Mode M0 | |||
|---|---|---|---|
| Quadrant | BADHDUFLAG | Total packets | Discarded packets |
| A | 0 | 206612 | 0 |
| B | 0 | 238434 | 0 |
| C | 0 | 179635 | 0 |
| D | 0 | 368121 | 0 |
| Mode M9 | |||
|---|---|---|---|
| Quadrant | BADHDUFLAG | Total packets | Discarded packets |
| A | 0 | 143 | 0 |
| B | 0 | 143 | 0 |
| C | 0 | 143 | 0 |
| D | 0 | 143 | 0 |
| Quadrant | Total seconds | Saturated seconds | Saturation percentage |
|---|---|---|---|
| A | 84181 | 4680 | 5.559449% |
| B | 84181 | 6158 | 7.315190% |
| C | 84181 | 815 | 0.968152% |
| D | 84181 | 19459 | 23.115667% |
Noise dominated data is calculated using 1-second bins in cleaned event files. If a bin has >2000 counts, and if more than 50% of those come from <1% of pixels, then it is considered to be noise-dominated and hence unusable.
| Quadrant | # 1 sec bins | Bins with >0 counts | Bins with >2000 counts | High rate bins dominated by noise | Noise dominated (total time) | Noise dominated (detector-on time) | Marked lightcurve |
|---|---|---|---|---|---|---|---|
| A | 98461 | 83748 | 0 | 0 | 0.00% | 0.00% |  |
| B | 98461 | 84084 | 0 | 0 | 0.00% | 0.00% |  |
| C | 98461 | 84173 | 0 | 0 | 0.00% | 0.00% |  |
| D | 98461 | 84036 | 0 | 0 | 0.00% | 0.00% |  |
Top three noisy pixels from each quadrant. If the there are fewer than three noisy pixels in the level2.evt file, extra rows are filled as -1
| Pixel properties | Quadrant properties | ||||||
|---|---|---|---|---|---|---|---|
| Quadrant | DetID | PixID | Counts | Sigma | Mean | Median | Sigma |
| A | 0 | 29 | 4468 | 11.12 | 1221 | 1148 | 298.6 |
| A | 7 | 110 | 3760 | 8.75 | 1221 | 1148 | 298.6 |
| A | 9 | 19 | 3585 | 8.16 | 1221 | 1148 | 298.6 |
| B | 2 | 9 | 3635 | 11.01 | 1180 | 1130 | 227.6 |
| B | 2 | 8 | 3070 | 8.52 | 1180 | 1130 | 227.6 |
| B | 14 | 254 | 3062 | 8.49 | 1180 | 1130 | 227.6 |
| C | 12 | 241 | 3454 | 7.12 | 1255 | 1175 | 320.0 |
| C | 2 | 191 | 3197 | 6.32 | 1255 | 1175 | 320.0 |
| C | 3 | 126 | 3160 | 6.2 | 1255 | 1175 | 320.0 |
| D | 6 | 231 | 2777 | 6.35 | 1065 | 970 | 284.7 |
| D | 7 | 3 | 2602 | 5.73 | 1065 | 970 | 284.7 |
| D | 6 | 67 | 2573 | 5.63 | 1065 | 970 | 284.7 |
Histogram calculated using DETX and DETY for each event in the final _common_clean file
| Quadrant A | 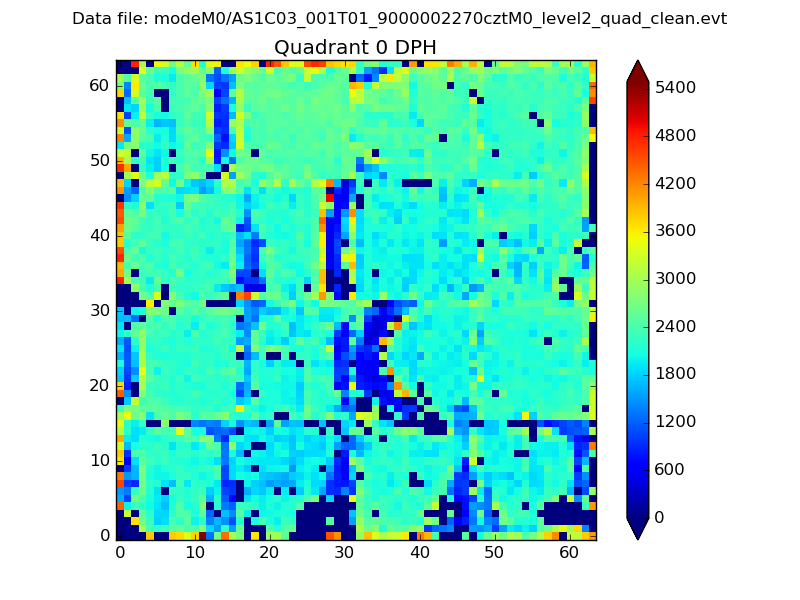 |
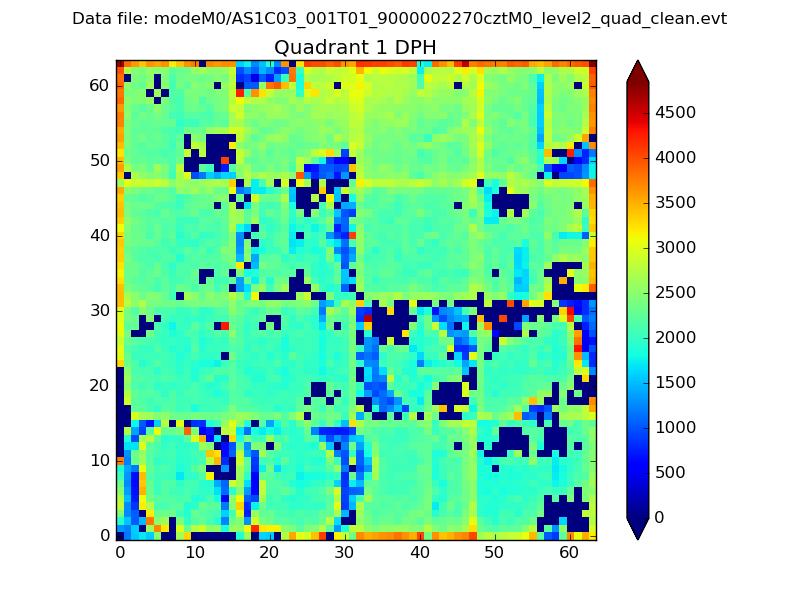 |
Quadrant B |
|---|---|---|---|
| Quadrant D | 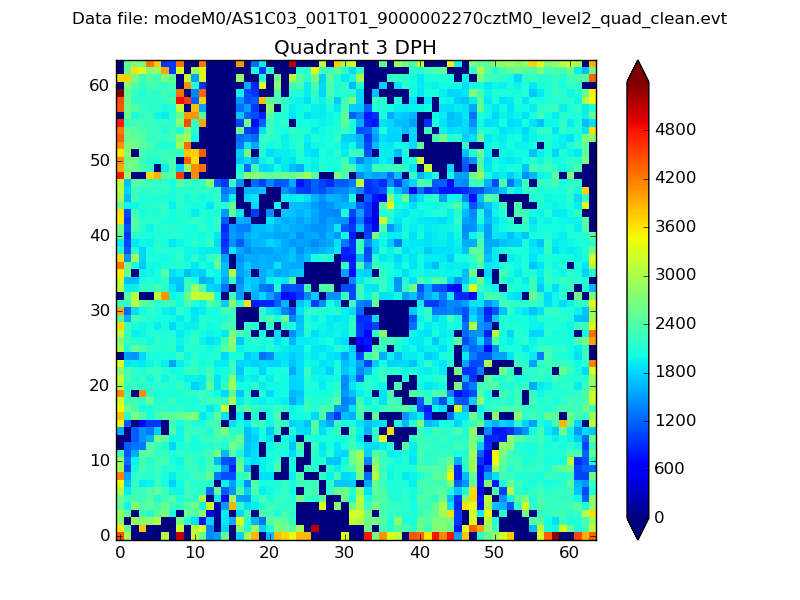 |
 |
Quadrant C |
| Plot type | Count rate plots | Images |
|---|---|---|
| Comparison with Poisson distribution Blue bars denote a histogram of data divided into 1 sec bins. Red curve is a Poisson curve with rate = median count rate of data. |
 |
 |
| Quadrant-wise count rates Data is divided into 100 sec bins |
 |
|
| Module-wise count rates for Quadrant A Data is divided into 100 sec bins |
 |
 |
| Module-wise count rates for Quadrant B Data is divided into 100 sec bins |
 |
 |
| Module-wise count rates for Quadrant C Data is divided into 100 sec bins |
 |
 |
| Module-wise count rates for Quadrant D Data is divided into 100 sec bins |
 |
 |
| Parameter | Plot |
|---|---|
| CZT HV Monitor |  |
| D_VDD | 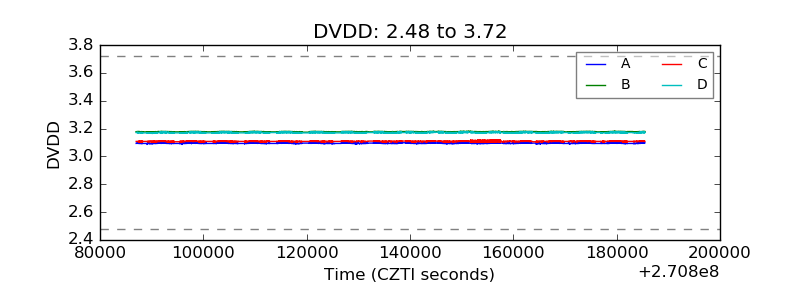 |
| Temperature 1 |  |
| Veto HV Monitor |  |
| Veto LLD |  |
| Alpha Counter |  |
| _CPM_Rate |  |
| CZT Counter |  |
| +2.5 Volts monitor |  |
| +5 Volts monitor |  |
| _ROLL_ROT |  |
| _Roll_DEC |  |
| _Roll_RA |  |
| Veto Counter |  |