| Param | Original file | Final file |
|---|---|---|
| Filename | modeM0/AS1C03_001T01_9000002270_15380cztM0_level2.evt | modeM0/AS1C03_001T01_9000002270_15380cztM0_level2_quad_clean.evt |
| Size (bytes) | 219,870,720 | 34,611,840 |
| Size | 209.7 MB | 33.0 MB |
| Events in quadrant A | 1,525,492 | 214,280 |
| Events in quadrant B | 1,932,198 | 210,556 |
| Events in quadrant C | 1,374,593 | 217,563 |
| Events in quadrant D | 1,636,704 | 207,331 |
| Mode SS | |||
|---|---|---|---|
| Quadrant | BADHDUFLAG | Total packets | Discarded packets |
| A | 0 | 56 | 0 |
| B | 0 | 56 | 0 |
| C | 0 | 56 | 0 |
| D | 0 | 56 | 0 |
| Mode M0 | |||
|---|---|---|---|
| Quadrant | BADHDUFLAG | Total packets | Discarded packets |
| A | 0 | 6309 | 2 |
| B | 0 | 7442 | 1 |
| C | 0 | 5708 | 1 |
| D | 0 | 6714 | 1 |
| Mode M9 | |||
|---|---|---|---|
| Quadrant | BADHDUFLAG | Total packets | Discarded packets |
| A | 0 | 8 | 0 |
| B | 0 | 8 | 0 |
| C | 0 | 8 | 0 |
| D | 0 | 8 | 0 |
| Quadrant | Total seconds | Saturated seconds | Saturation percentage |
|---|---|---|---|
| A | 2771 | 88 | 3.175749% |
| B | 2771 | 235 | 8.480693% |
| C | 2771 | 51 | 1.840491% |
| D | 2771 | 121 | 4.366655% |
Noise dominated data is calculated using 1-second bins in cleaned event files. If a bin has >2000 counts, and if more than 50% of those come from <1% of pixels, then it is considered to be noise-dominated and hence unusable.
| Quadrant | # 1 sec bins | Bins with >0 counts | Bins with >2000 counts | High rate bins dominated by noise | Noise dominated (total time) | Noise dominated (detector-on time) | Marked lightcurve |
|---|---|---|---|---|---|---|---|
| A | 3577 | 2772 | 7 | 7 | 0.20% | 0.25% | 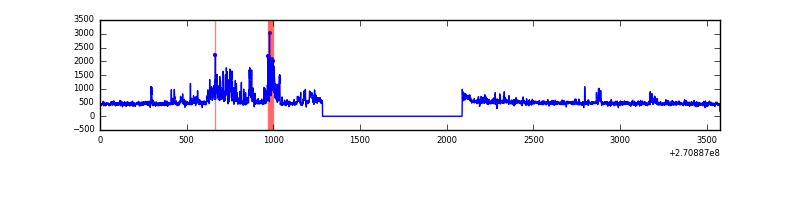 |
| B | 3577 | 2772 | 103 | 103 | 2.88% | 3.72% |  |
| C | 3577 | 2772 | 0 | 0 | 0.00% | 0.00% | 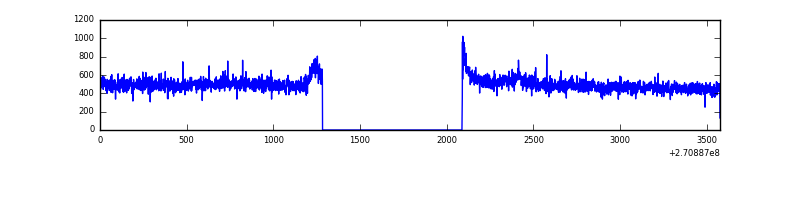 |
| D | 3577 | 2772 | 70 | 70 | 1.96% | 2.53% | 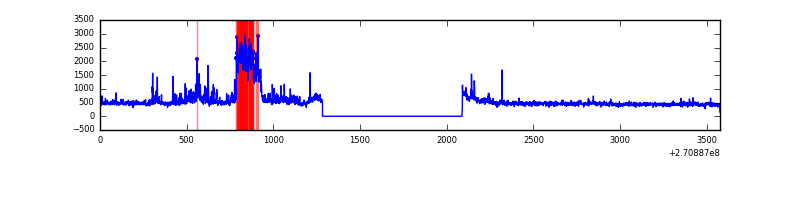 |
Top three noisy pixels from each quadrant. If the there are fewer than three noisy pixels in the level2.evt file, extra rows are filled as -1
| Pixel properties | Quadrant properties | ||||||
|---|---|---|---|---|---|---|---|
| Quadrant | DetID | PixID | Counts | Sigma | Mean | Median | Sigma |
| A | 14 | 238 | 119498 | 1682.8 | 339 | 330 | 70.8 |
| A | 14 | 237 | 59294 | 832.65 | 339 | 330 | 70.8 |
| A | 3 | 80 | 37209 | 520.78 | 339 | 330 | 70.8 |
| B | 10 | 245 | 539218 | 8125.4 | 334 | 325 | 66.3 |
| B | 8 | 3 | 44544 | 666.73 | 334 | 325 | 66.3 |
| B | 0 | 229 | 33505 | 500.29 | 334 | 325 | 66.3 |
| C | 3 | 233 | 74682 | 934.59 | 333 | 333 | 79.6 |
| C | 13 | 61 | 2361 | 25.49 | 333 | 333 | 79.6 |
| C | 10 | 22 | 1987 | 20.79 | 333 | 333 | 79.6 |
| D | 9 | 68 | 209865 | 2565.54 | 329 | 318 | 81.7 |
| D | 5 | 222 | 90056 | 1098.69 | 329 | 318 | 81.7 |
| D | 7 | 38 | 33788 | 409.78 | 329 | 318 | 81.7 |
Histogram calculated using DETX and DETY for each event in the final _common_clean file
| Quadrant A | 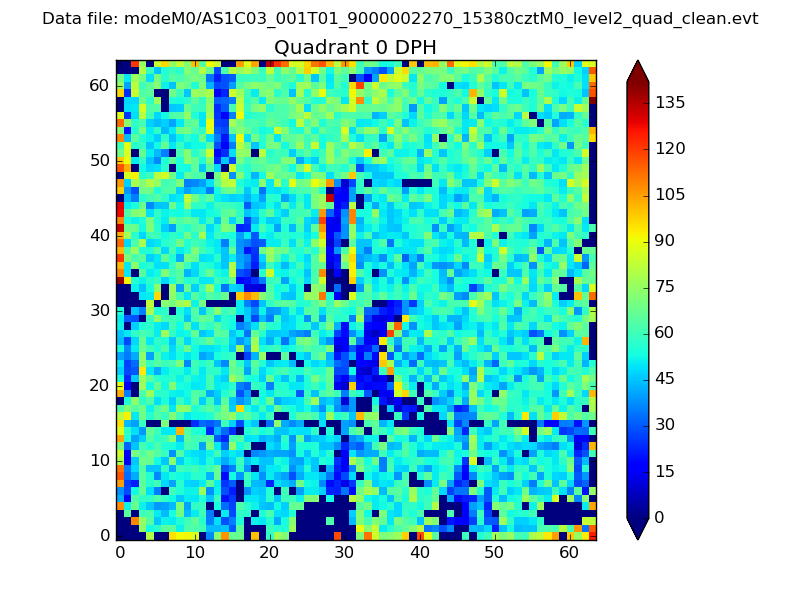 |
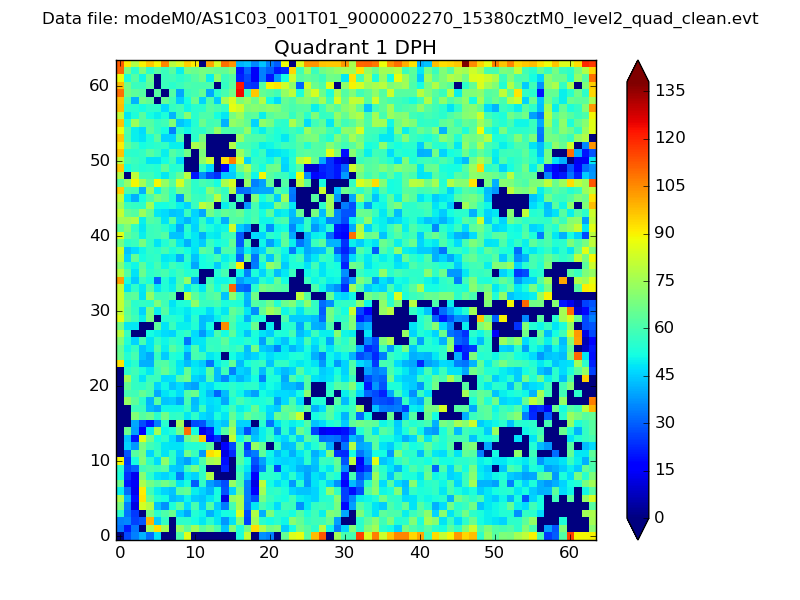 |
Quadrant B |
|---|---|---|---|
| Quadrant D | 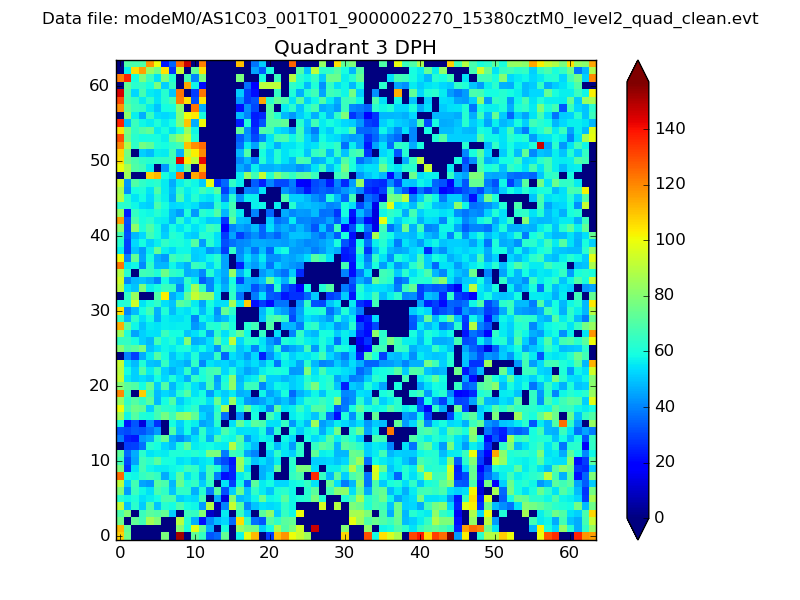 |
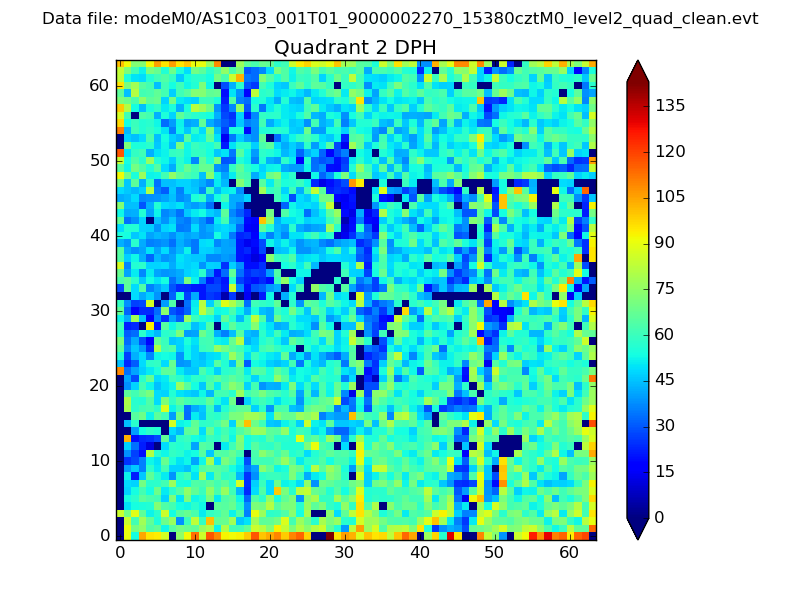 |
Quadrant C |
| Plot type | Count rate plots | Images |
|---|---|---|
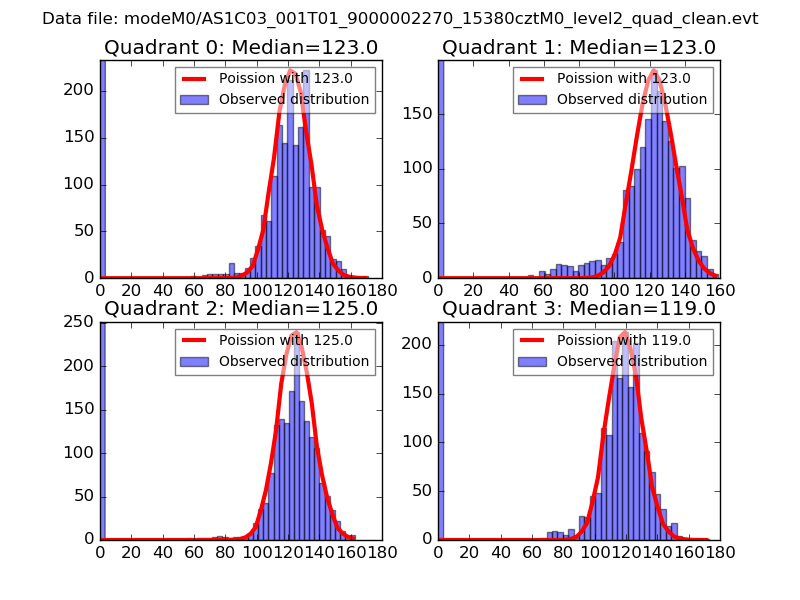
| Comparison with Poisson distribution Blue bars denote a histogram of data divided into 1 sec bins. Red curve is a Poisson curve with rate = median count rate of data. |
 |
 |
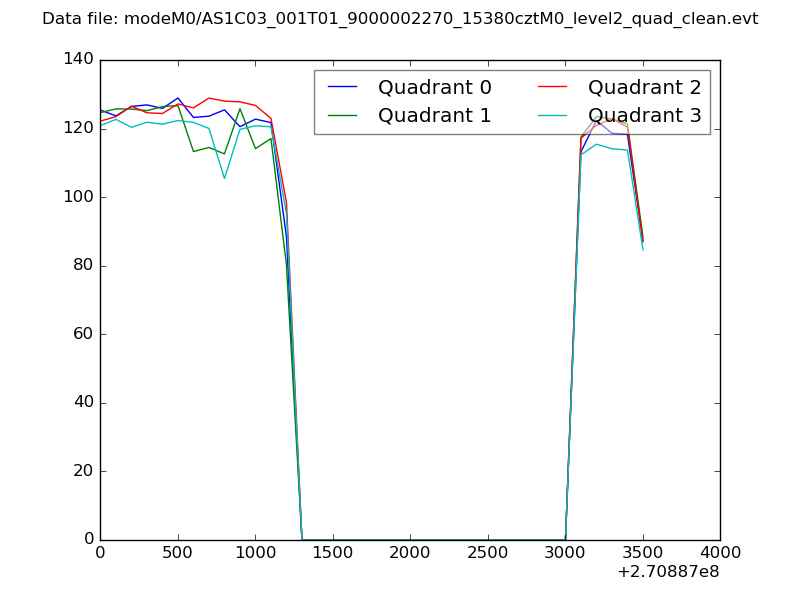
| Quadrant-wise count rates Data is divided into 100 sec bins |
 |
|
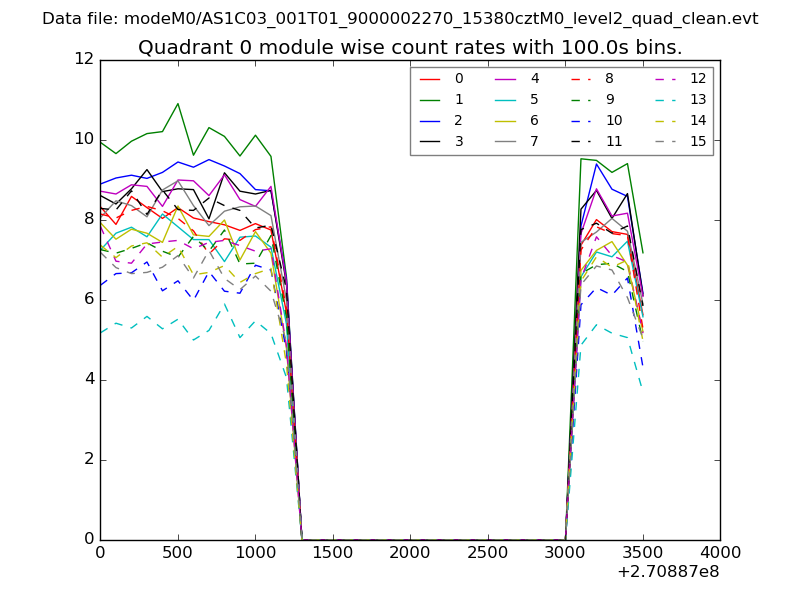
| Module-wise count rates for Quadrant A Data is divided into 100 sec bins |
 |
 |
| Module-wise count rates for Quadrant B Data is divided into 100 sec bins |
 |
 |
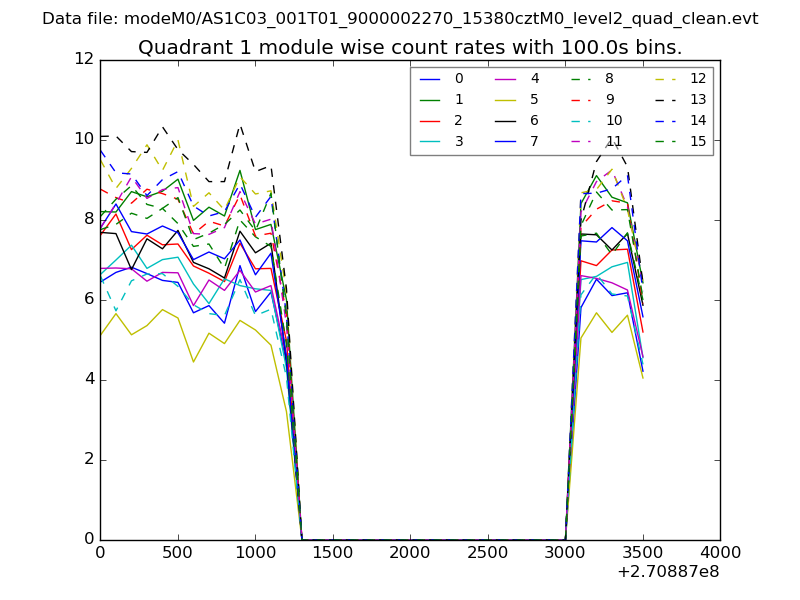
| Module-wise count rates for Quadrant C Data is divided into 100 sec bins |
 |
 |
| Module-wise count rates for Quadrant D Data is divided into 100 sec bins |
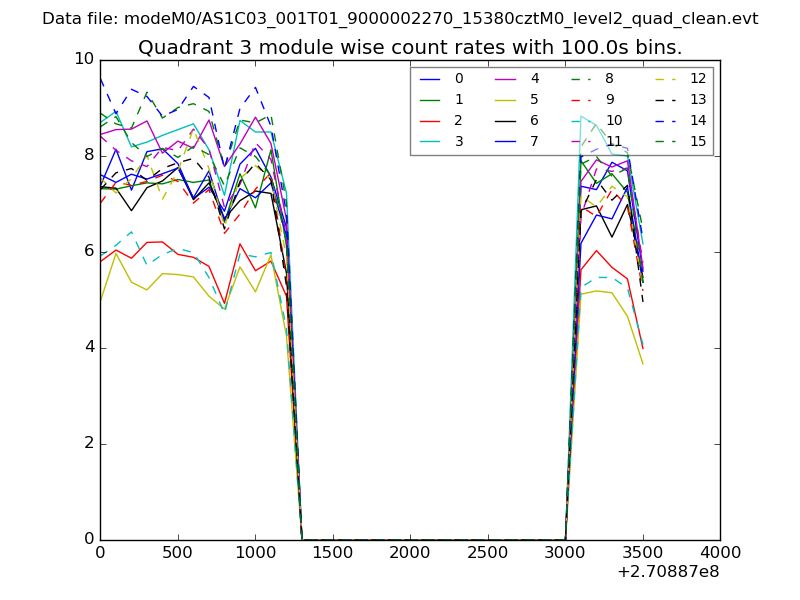 |
 |
| Parameter | Plot |
|---|---|
| CZT HV Monitor | 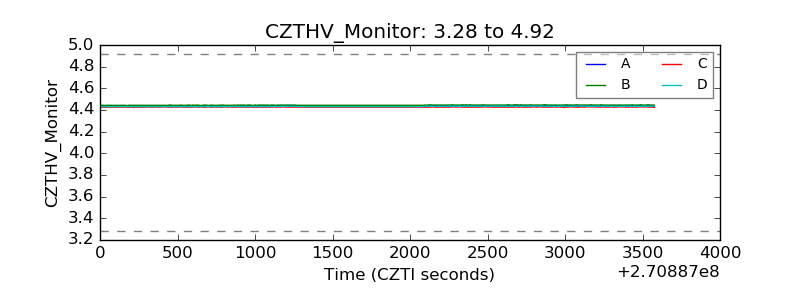 |
| D_VDD | 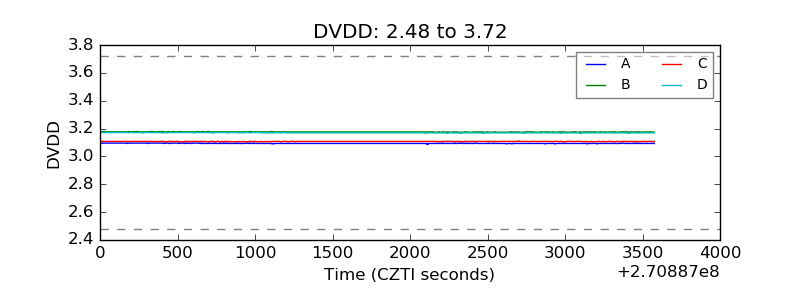 |
| Temperature 1 | 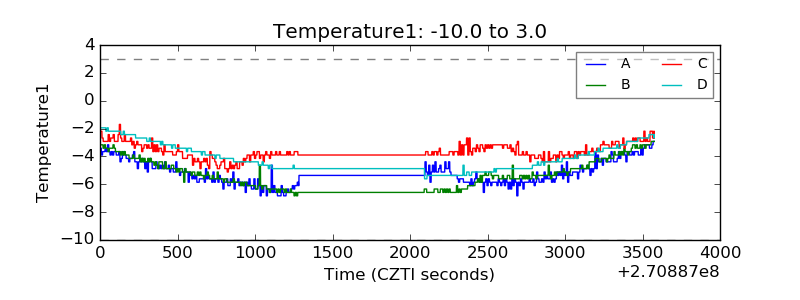 |
| Veto HV Monitor | 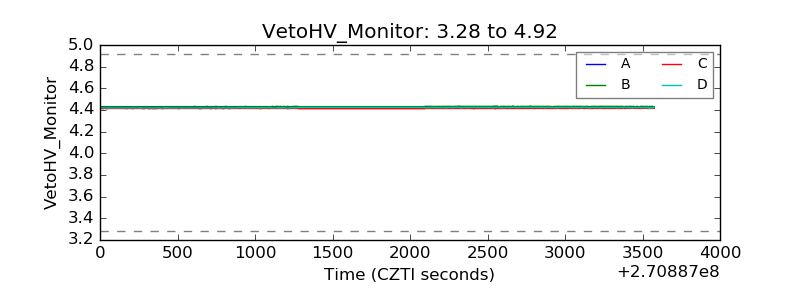 |
| Veto LLD | 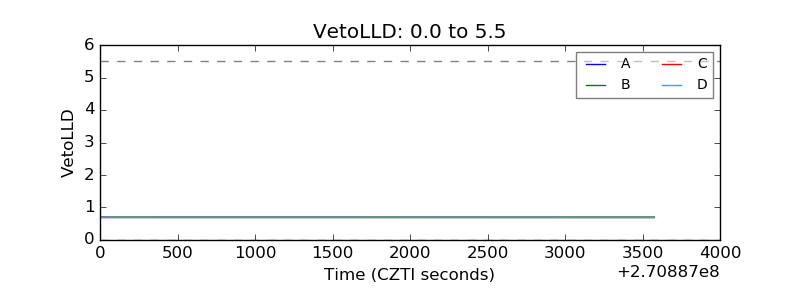 |
| Alpha Counter | 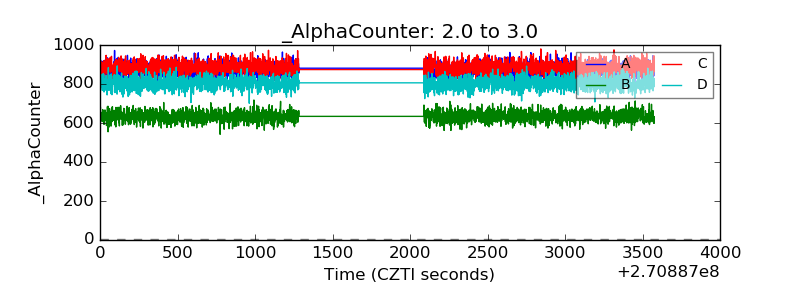 |
| _CPM_Rate | 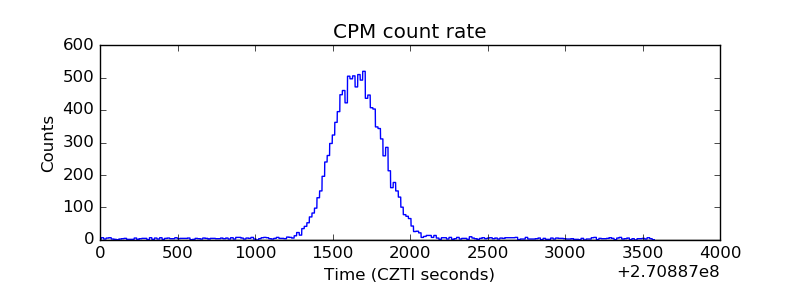 |
| CZT Counter | 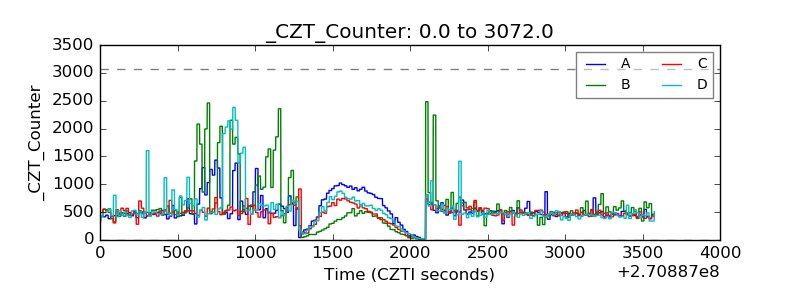 |
| +2.5 Volts monitor | 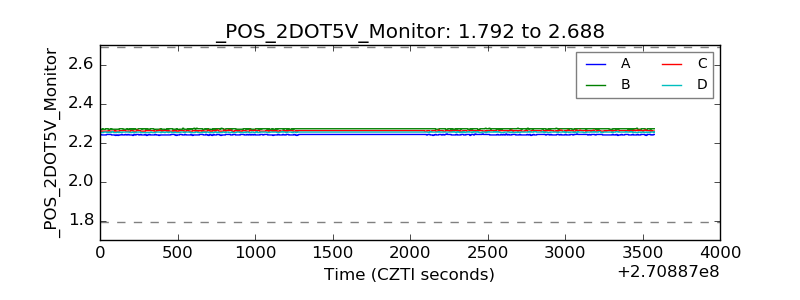 |
| +5 Volts monitor | 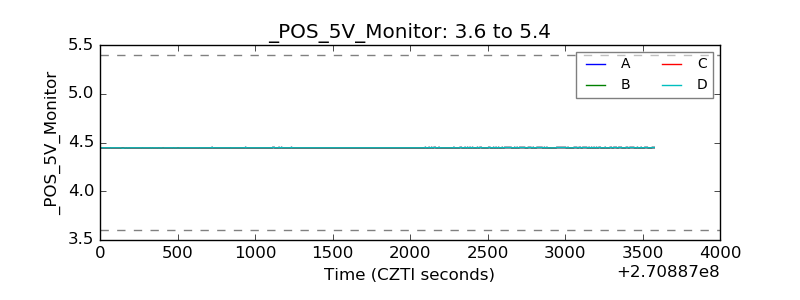 |
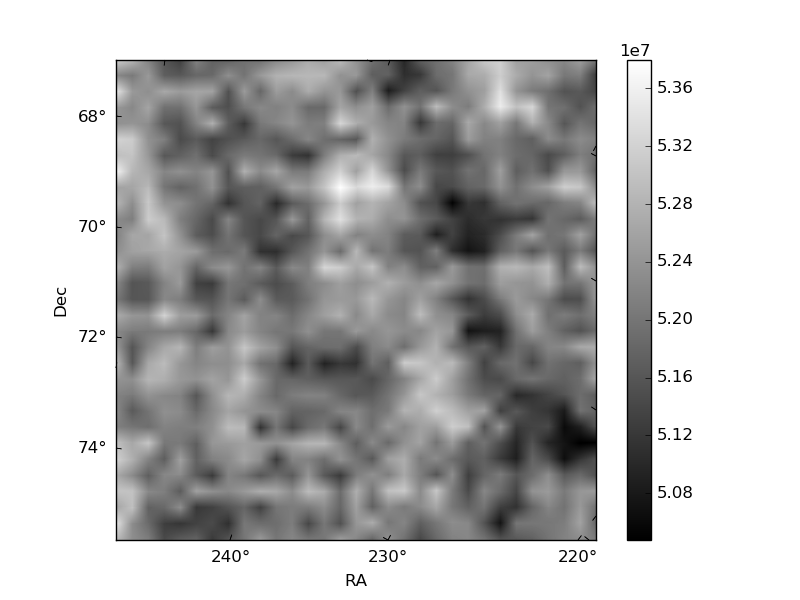
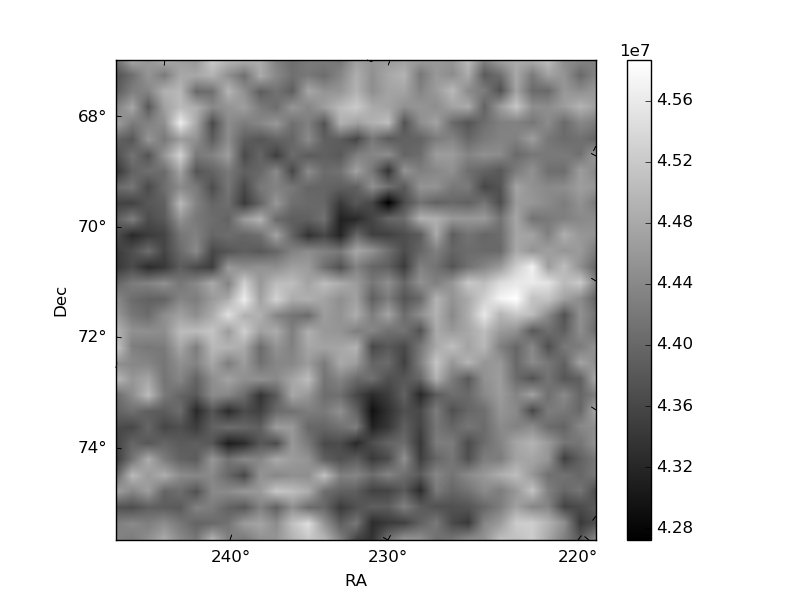
| _ROLL_ROT | 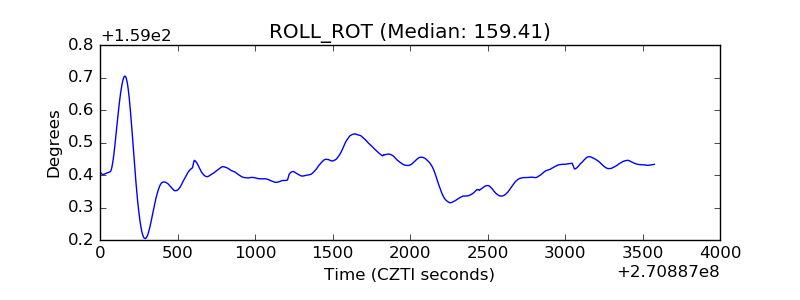 |
| _Roll_DEC | 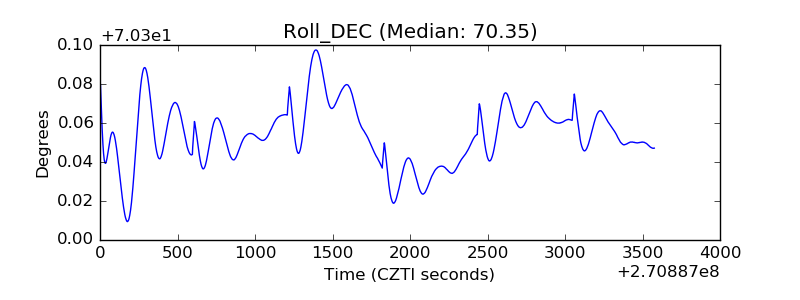 |
| _Roll_RA | 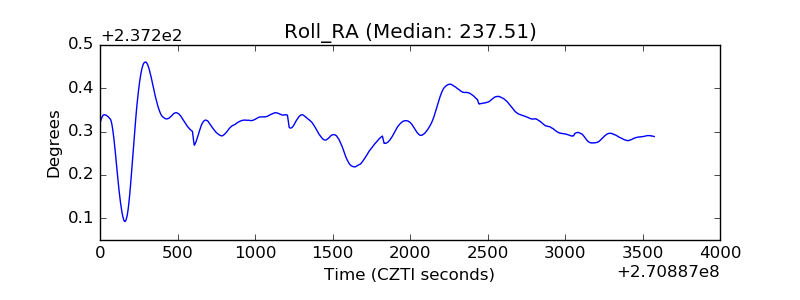 |
| Veto Counter | 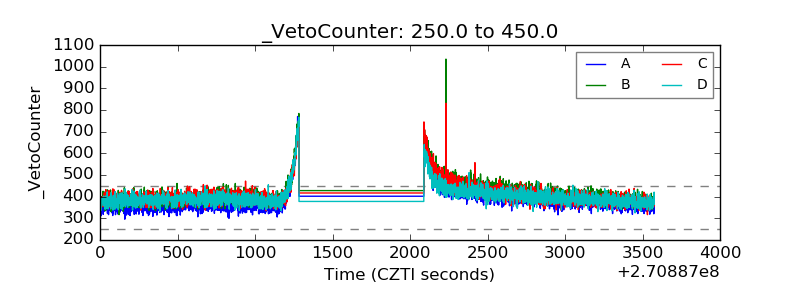 |