| Param | Original file | Final file |
|---|---|---|
| Filename | modeM0/AS1C03_001T01_9000002270_15381cztM0_level2.evt | modeM0/AS1C03_001T01_9000002270_15381cztM0_level2_quad_clean.evt |
| Size (bytes) | 507,870,720 | 95,466,240 |
| Size | 484.3 MB | 91.0 MB |
| Events in quadrant A | 3,964,259 | 592,177 |
| Events in quadrant B | 4,048,656 | 626,187 |
| Events in quadrant C | 3,237,389 | 617,297 |
| Events in quadrant D | 3,678,243 | 590,718 |
| Mode SS | |||
|---|---|---|---|
| Quadrant | BADHDUFLAG | Total packets | Discarded packets |
| A | 0 | 136 | 0 |
| B | 0 | 136 | 0 |
| C | 0 | 136 | 0 |
| D | 0 | 136 | 0 |
| Mode M0 | |||
|---|---|---|---|
| Quadrant | BADHDUFLAG | Total packets | Discarded packets |
| A | 0 | 16129 | 2 |
| B | 0 | 16237 | 1 |
| C | 0 | 13636 | 1 |
| D | 0 | 15420 | 1 |
| Mode M9 | |||
|---|---|---|---|
| Quadrant | BADHDUFLAG | Total packets | Discarded packets |
| A | 0 | 9 | 0 |
| B | 0 | 9 | 0 |
| C | 0 | 9 | 0 |
| D | 0 | 9 | 0 |
| Quadrant | Total seconds | Saturated seconds | Saturation percentage |
|---|---|---|---|
| A | 6660 | 437 | 6.561562% |
| B | 6660 | 116 | 1.741742% |
| C | 6660 | 39 | 0.585586% |
| D | 6660 | 137 | 2.057057% |
Noise dominated data is calculated using 1-second bins in cleaned event files. If a bin has >2000 counts, and if more than 50% of those come from <1% of pixels, then it is considered to be noise-dominated and hence unusable.
| Quadrant | # 1 sec bins | Bins with >0 counts | Bins with >2000 counts | High rate bins dominated by noise | Noise dominated (total time) | Noise dominated (detector-on time) | Marked lightcurve |
|---|---|---|---|---|---|---|---|
| A | 7641 | 6661 | 207 | 207 | 2.71% | 3.11% | 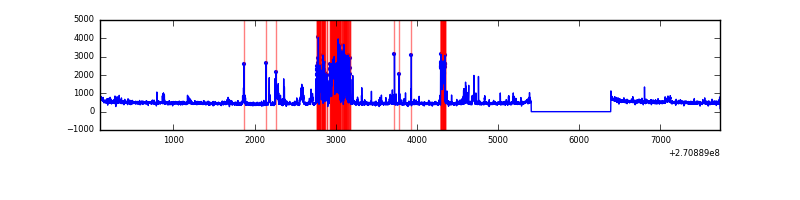 |
| B | 7641 | 6661 | 30 | 30 | 0.39% | 0.45% | 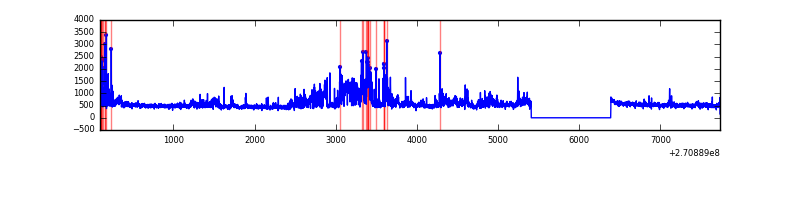 |
| C | 7641 | 6661 | 0 | 0 | 0.00% | 0.00% | 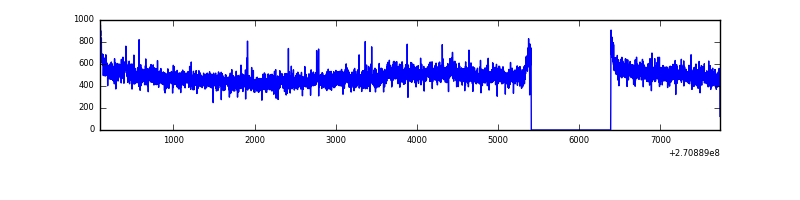 |
| D | 7641 | 6661 | 81 | 81 | 1.06% | 1.22% |  |
Top three noisy pixels from each quadrant. If the there are fewer than three noisy pixels in the level2.evt file, extra rows are filled as -1
| Pixel properties | Quadrant properties | ||||||
|---|---|---|---|---|---|---|---|
| Quadrant | DetID | PixID | Counts | Sigma | Mean | Median | Sigma |
| A | 14 | 238 | 731017 | 4680.22 | 768 | 751 | 156.0 |
| A | 3 | 80 | 121091 | 771.25 | 768 | 751 | 156.0 |
| A | 14 | 237 | 116740 | 743.37 | 768 | 751 | 156.0 |
| B | 8 | 3 | 526124 | 3489.3 | 789 | 770 | 150.6 |
| B | 10 | 245 | 183555 | 1214.02 | 789 | 770 | 150.6 |
| B | 10 | 16 | 80737 | 531.13 | 789 | 770 | 150.6 |
| C | 3 | 233 | 248623 | 1406.62 | 764 | 766 | 176.2 |
| C | 13 | 61 | 5483 | 26.77 | 764 | 766 | 176.2 |
| C | 7 | 247 | 5178 | 25.04 | 764 | 766 | 176.2 |
| D | 13 | 122 | 276291 | 1476.01 | 764 | 742 | 186.7 |
| D | 5 | 222 | 157497 | 839.68 | 764 | 742 | 186.7 |
| D | 7 | 38 | 109205 | 580.99 | 764 | 742 | 186.7 |
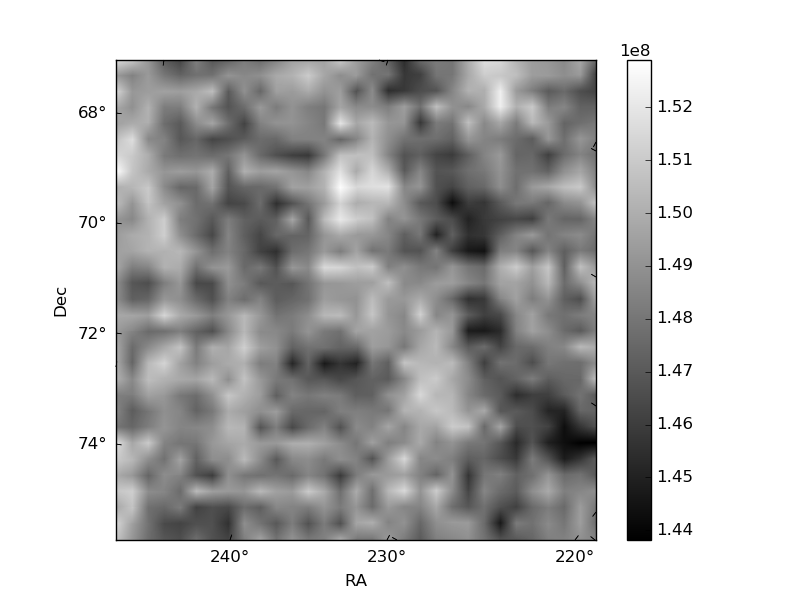
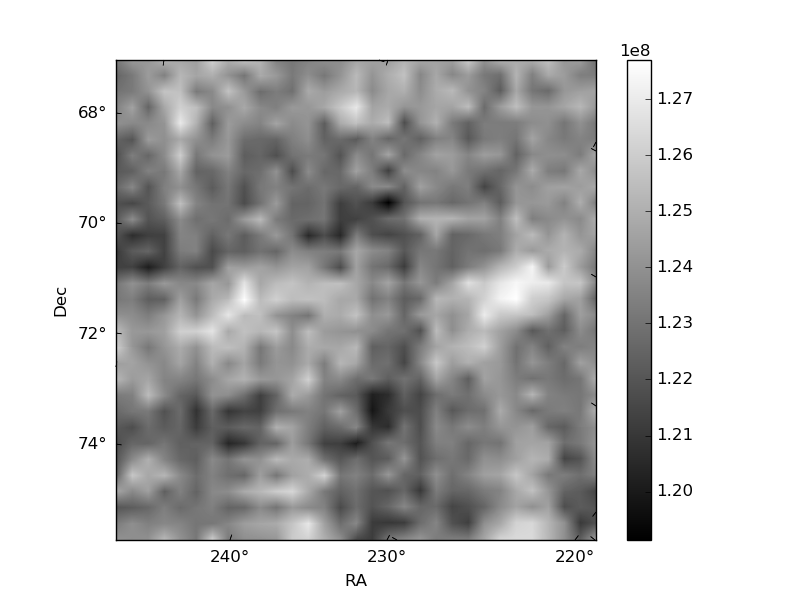
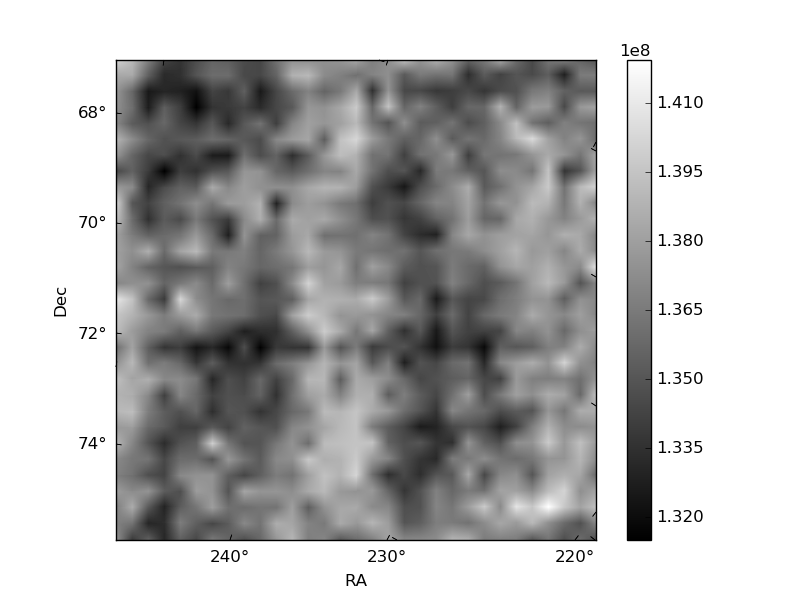
Histogram calculated using DETX and DETY for each event in the final _common_clean file
| Quadrant A |  |
 |
Quadrant B |
|---|---|---|---|
| Quadrant D |  |
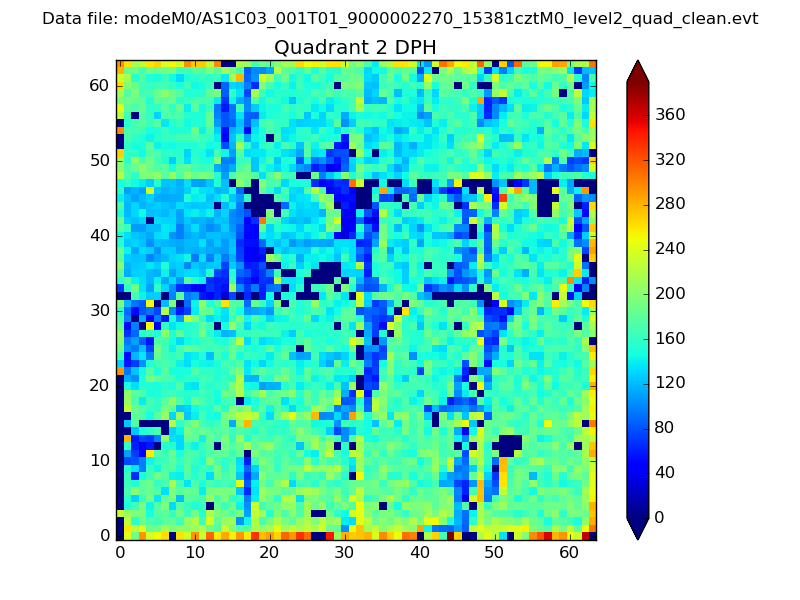 |
Quadrant C |
| Plot type | Count rate plots | Images |
|---|---|---|
| Comparison with Poisson distribution Blue bars denote a histogram of data divided into 1 sec bins. Red curve is a Poisson curve with rate = median count rate of data. |
 |
 |
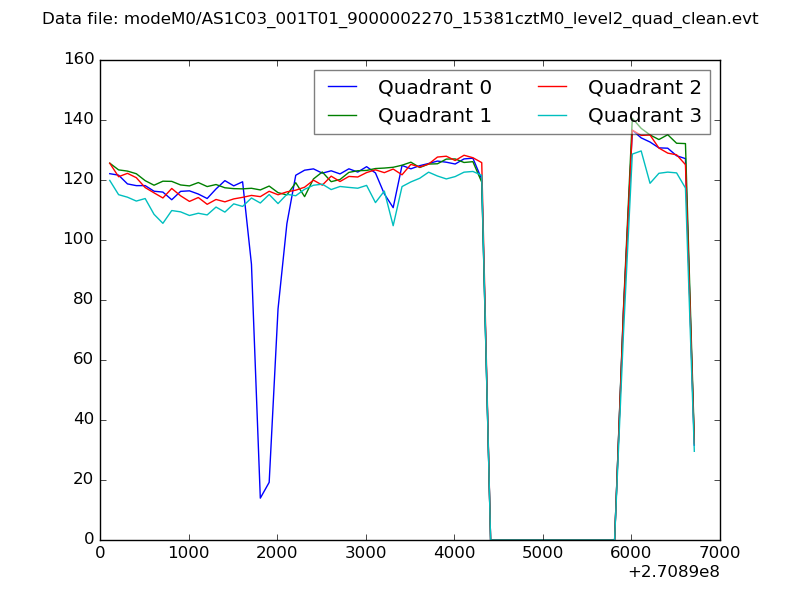
| Quadrant-wise count rates Data is divided into 100 sec bins |
 |
|
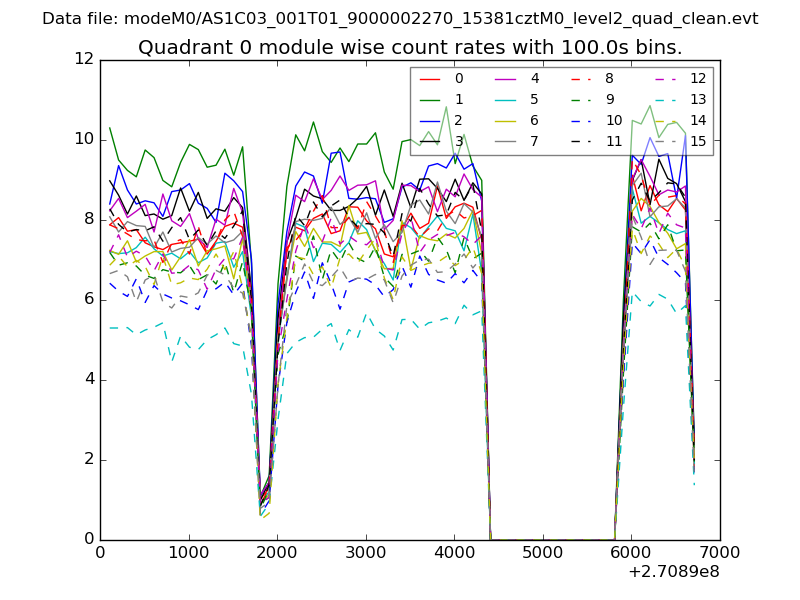
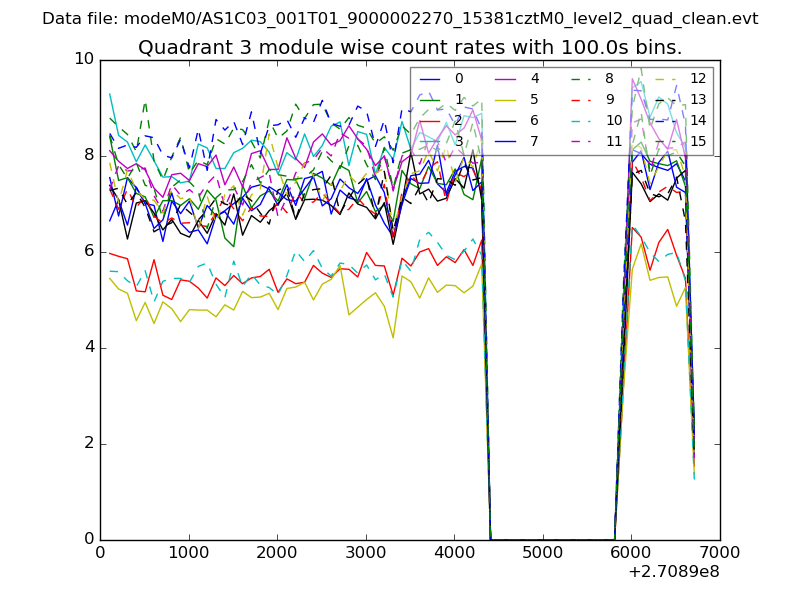
| Module-wise count rates for Quadrant A Data is divided into 100 sec bins |
 |
 |
| Module-wise count rates for Quadrant B Data is divided into 100 sec bins |
 |
 |
| Module-wise count rates for Quadrant C Data is divided into 100 sec bins |
 |
 |
| Module-wise count rates for Quadrant D Data is divided into 100 sec bins |
 |
 |
| Parameter | Plot |
|---|---|
| CZT HV Monitor |  |
| D_VDD | 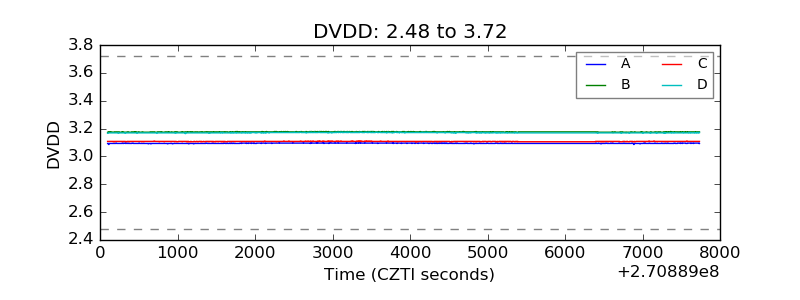 |
| Temperature 1 |  |
| Veto HV Monitor | 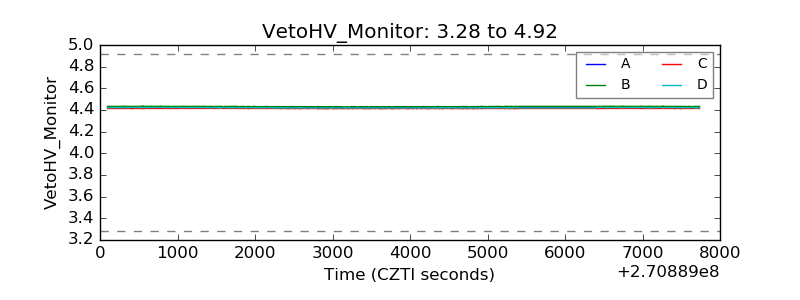 |
| Veto LLD | 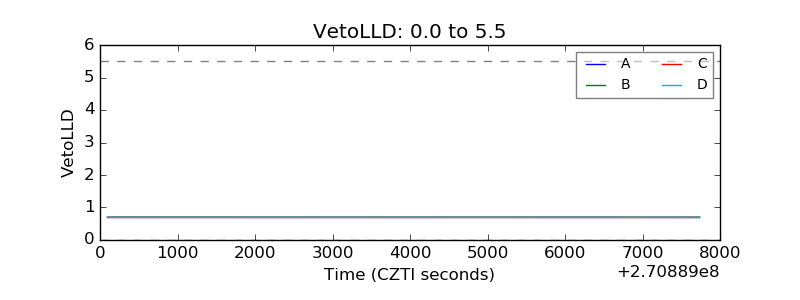 |
| Alpha Counter | 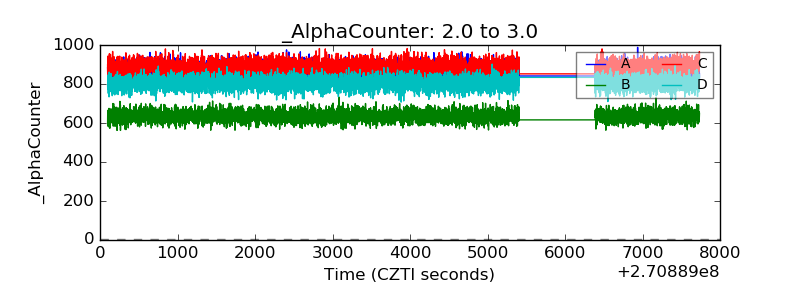 |
| _CPM_Rate | 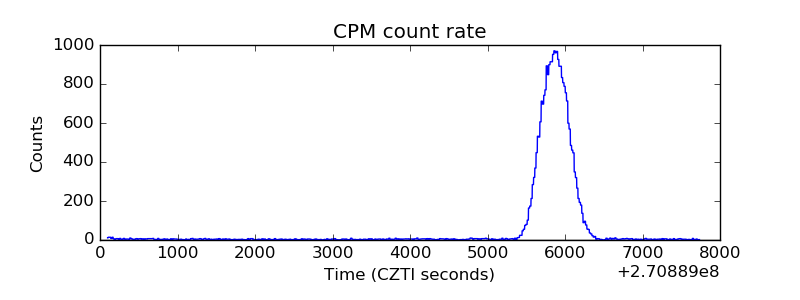 |
| CZT Counter | 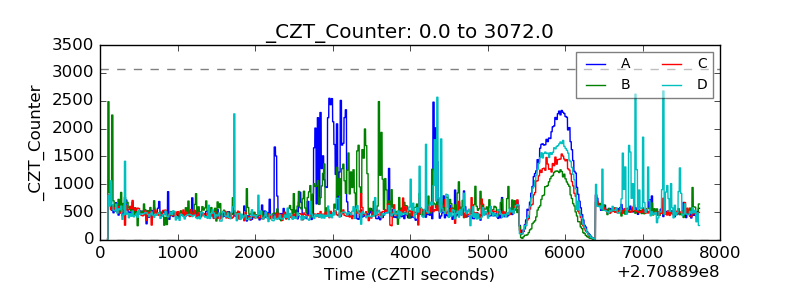 |
| +2.5 Volts monitor |  |
| +5 Volts monitor |  |
| _ROLL_ROT | 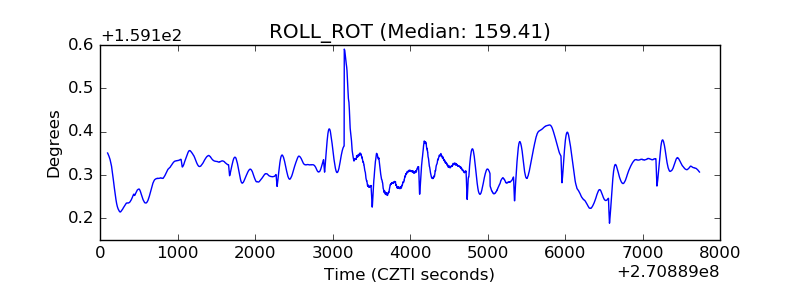 |
| _Roll_DEC | 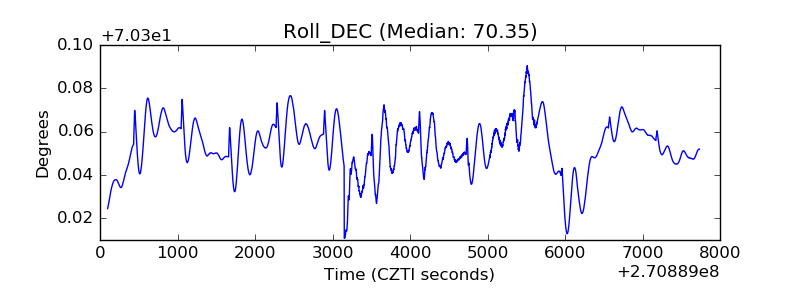 |
| _Roll_RA | 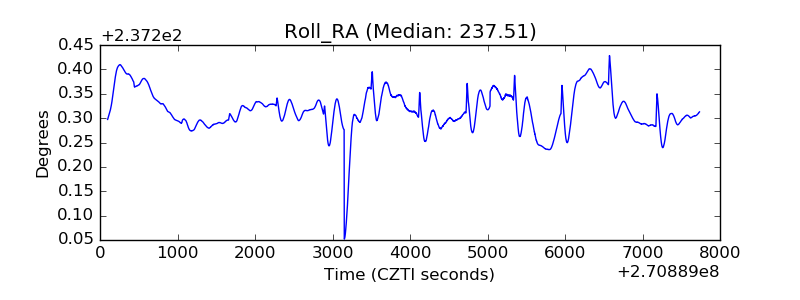 |
| Veto Counter | 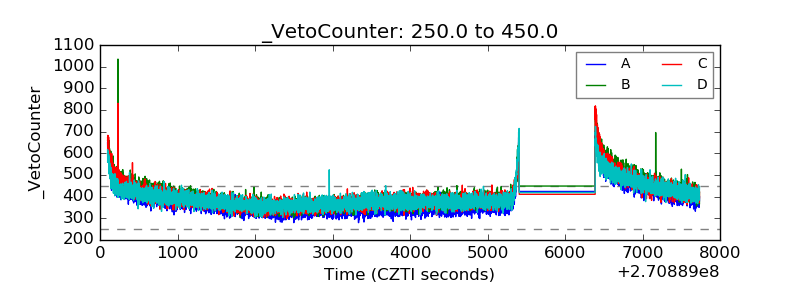 |