| Param | Original file | Final file |
|---|---|---|
| Filename | modeM0/AS1C03_001T01_9000002270_15383cztM0_level2.evt | modeM0/AS1C03_001T01_9000002270_15383cztM0_level2_quad_clean.evt |
| Size (bytes) | 609,779,520 | 109,172,160 |
| Size | 581.5 MB | 104.1 MB |
| Events in quadrant A | 5,857,585 | 681,749 |
| Events in quadrant B | 3,447,235 | 757,210 |
| Events in quadrant C | 2,988,116 | 750,394 |
| Events in quadrant D | 5,764,616 | 693,720 |
| Mode SS | |||
|---|---|---|---|
| Quadrant | BADHDUFLAG | Total packets | Discarded packets |
| A | 0 | 124 | 0 |
| B | 0 | 124 | 0 |
| C | 0 | 124 | 0 |
| D | 0 | 124 | 0 |
| Mode M0 | |||
|---|---|---|---|
| Quadrant | BADHDUFLAG | Total packets | Discarded packets |
| A | 0 | 21462 | 2 |
| B | 0 | 14022 | 1 |
| C | 0 | 12470 | 1 |
| D | 0 | 21250 | 1 |
| Mode M9 | |||
|---|---|---|---|
| Quadrant | BADHDUFLAG | Total packets | Discarded packets |
| A | 0 | 11 | 0 |
| B | 0 | 11 | 0 |
| C | 0 | 11 | 0 |
| D | 0 | 11 | 0 |
| Quadrant | Total seconds | Saturated seconds | Saturation percentage |
|---|---|---|---|
| A | 6048 | 1230 | 20.337302% |
| B | 6048 | 162 | 2.678571% |
| C | 6048 | 42 | 0.694444% |
| D | 6048 | 600 | 9.920635% |
Noise dominated data is calculated using 1-second bins in cleaned event files. If a bin has >2000 counts, and if more than 50% of those come from <1% of pixels, then it is considered to be noise-dominated and hence unusable.
| Quadrant | # 1 sec bins | Bins with >0 counts | Bins with >2000 counts | High rate bins dominated by noise | Noise dominated (total time) | Noise dominated (detector-on time) | Marked lightcurve |
|---|---|---|---|---|---|---|---|
| A | 7144 | 6049 | 731 | 731 | 10.23% | 12.08% | 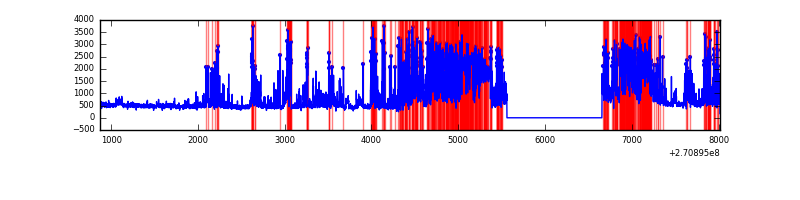 |
| B | 7144 | 6049 | 47 | 47 | 0.66% | 0.78% | 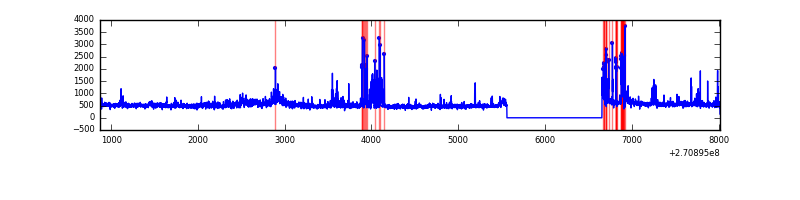 |
| C | 7144 | 6049 | 0 | 0 | 0.00% | 0.00% |  |
| D | 7144 | 6049 | 551 | 551 | 7.71% | 9.11% | 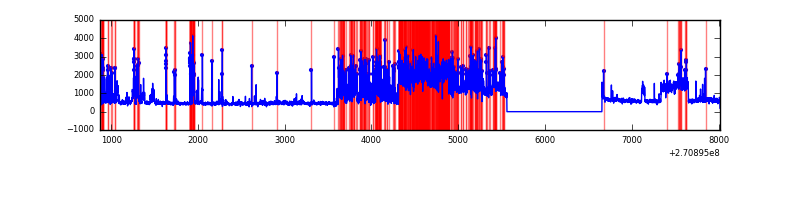 |
Top three noisy pixels from each quadrant. If the there are fewer than three noisy pixels in the level2.evt file, extra rows are filled as -1
| Pixel properties | Quadrant properties | ||||||
|---|---|---|---|---|---|---|---|
| Quadrant | DetID | PixID | Counts | Sigma | Mean | Median | Sigma |
| A | 14 | 238 | 2559467 | 19074.04 | 667 | 652 | 134.2 |
| A | 14 | 237 | 620353 | 4619.4 | 667 | 652 | 134.2 |
| A | 3 | 80 | 87641 | 648.44 | 667 | 652 | 134.2 |
| B | 10 | 245 | 170238 | 1255.72 | 720 | 704 | 135.0 |
| B | 10 | 16 | 115862 | 852.96 | 720 | 704 | 135.0 |
| B | 8 | 3 | 89155 | 655.14 | 720 | 704 | 135.0 |
| C | 3 | 233 | 227340 | 1405.04 | 705 | 709 | 161.3 |
| C | 7 | 247 | 5356 | 28.81 | 705 | 709 | 161.3 |
| C | 13 | 61 | 5111 | 27.29 | 705 | 709 | 161.3 |
| D | 13 | 122 | 1761752 | 10462.05 | 694 | 672 | 168.3 |
| D | 4 | 95 | 878553 | 5215.23 | 694 | 672 | 168.3 |
| D | 2 | 33 | 198602 | 1175.84 | 694 | 672 | 168.3 |
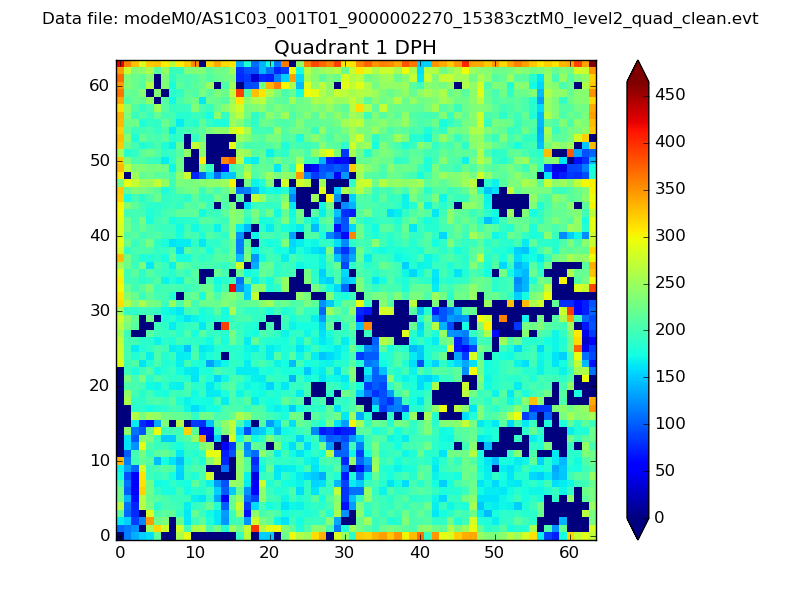
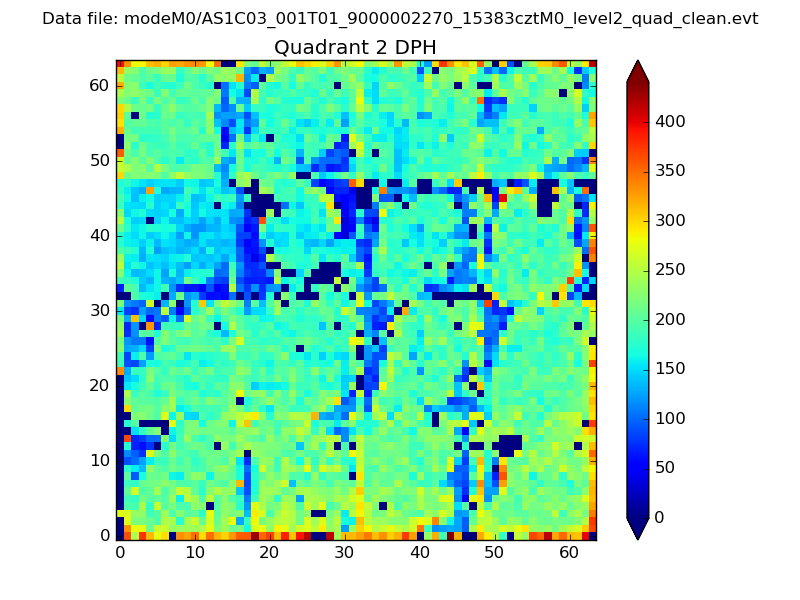
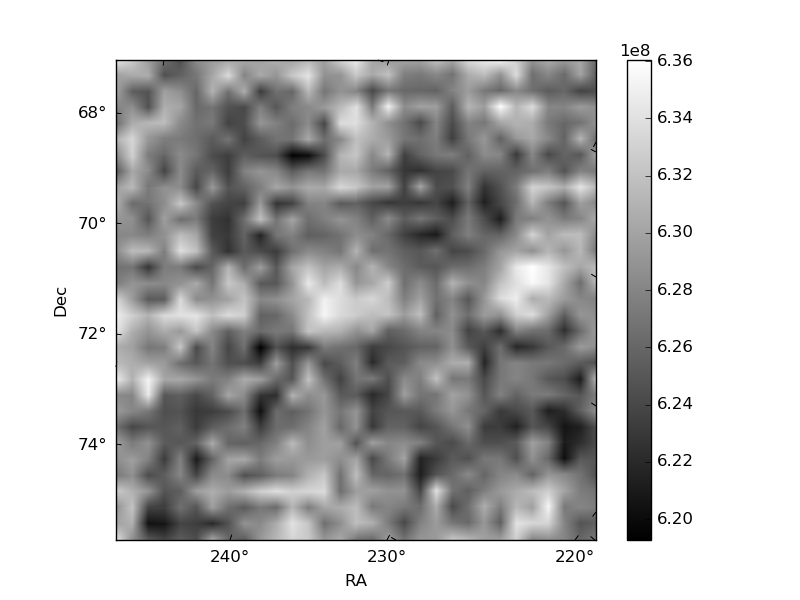
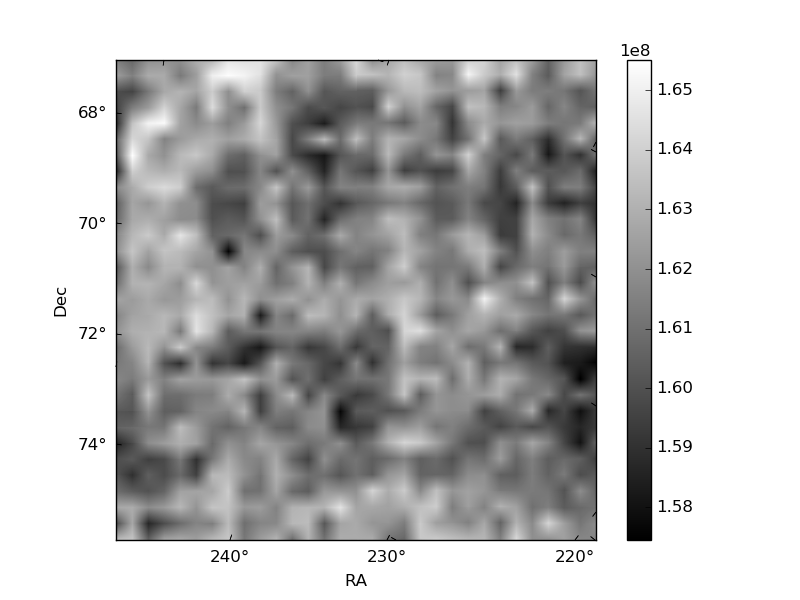
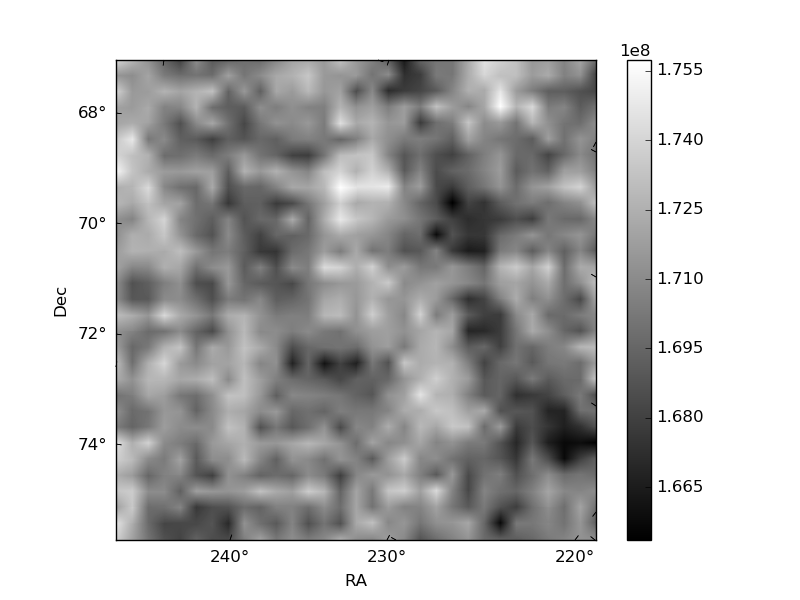
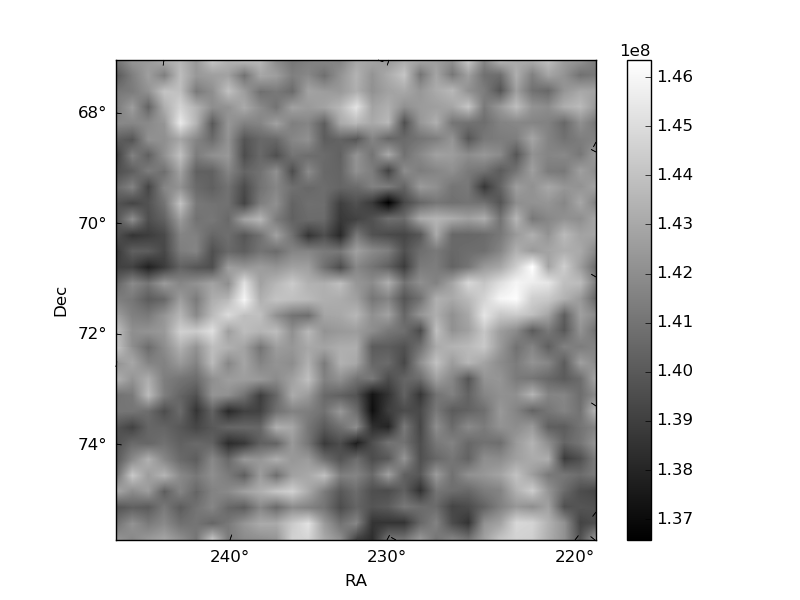
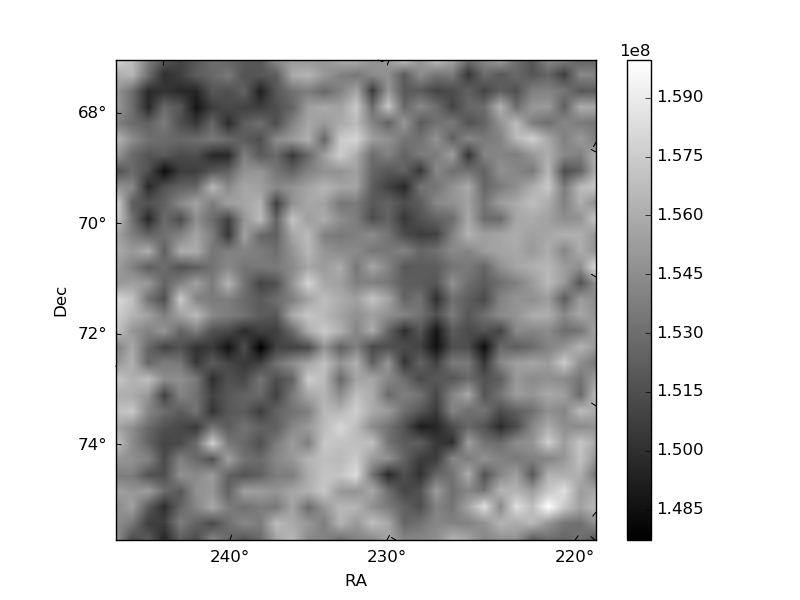
Histogram calculated using DETX and DETY for each event in the final _common_clean file
| Quadrant A | 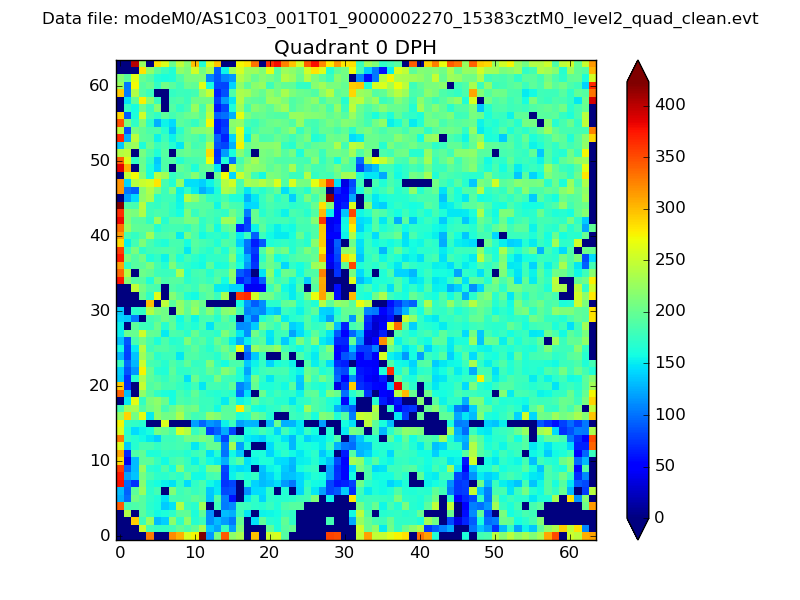 |
 |
Quadrant B |
|---|---|---|---|
| Quadrant D | 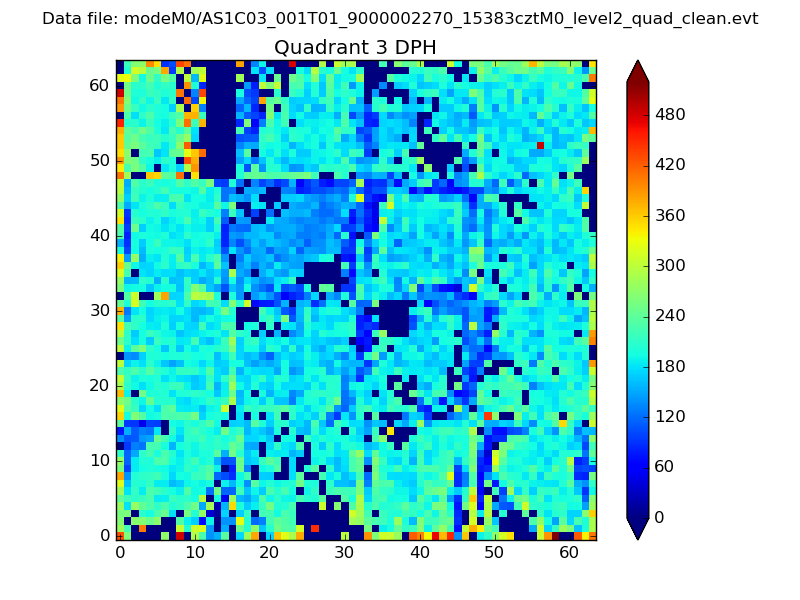 |
 |
Quadrant C |
| Plot type | Count rate plots | Images |
|---|---|---|
| Comparison with Poisson distribution Blue bars denote a histogram of data divided into 1 sec bins. Red curve is a Poisson curve with rate = median count rate of data. |
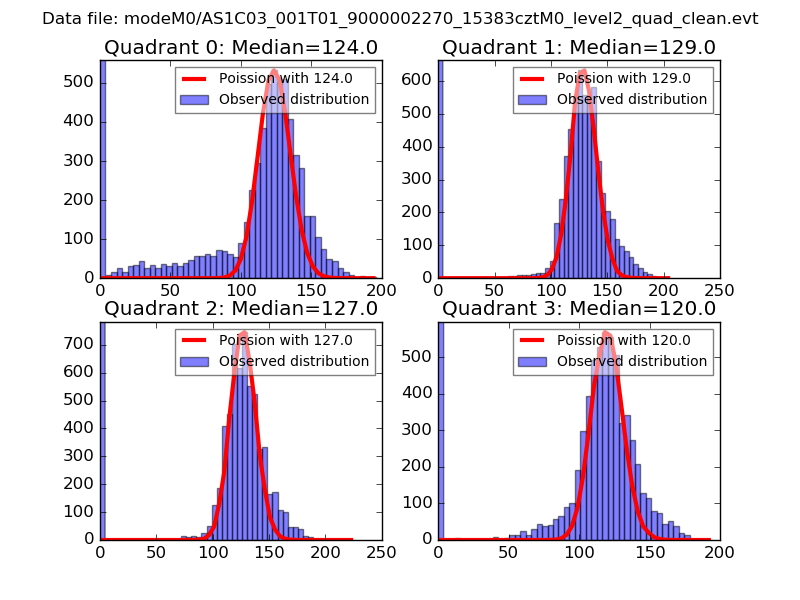 |
 |
| Quadrant-wise count rates Data is divided into 100 sec bins |
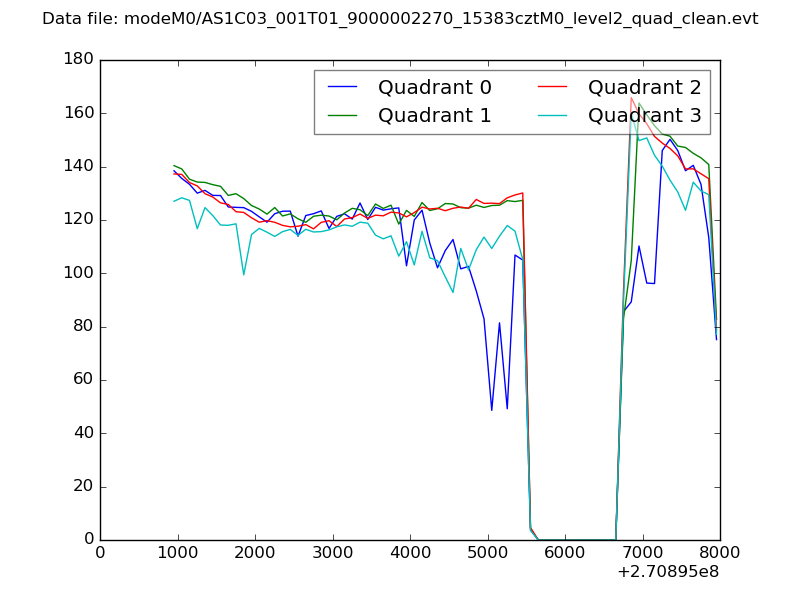 |
|
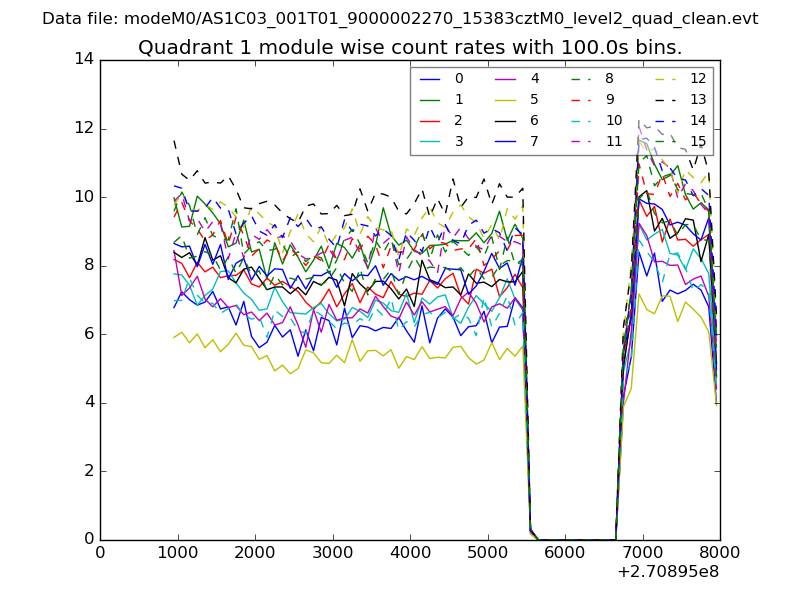
| Module-wise count rates for Quadrant A Data is divided into 100 sec bins |
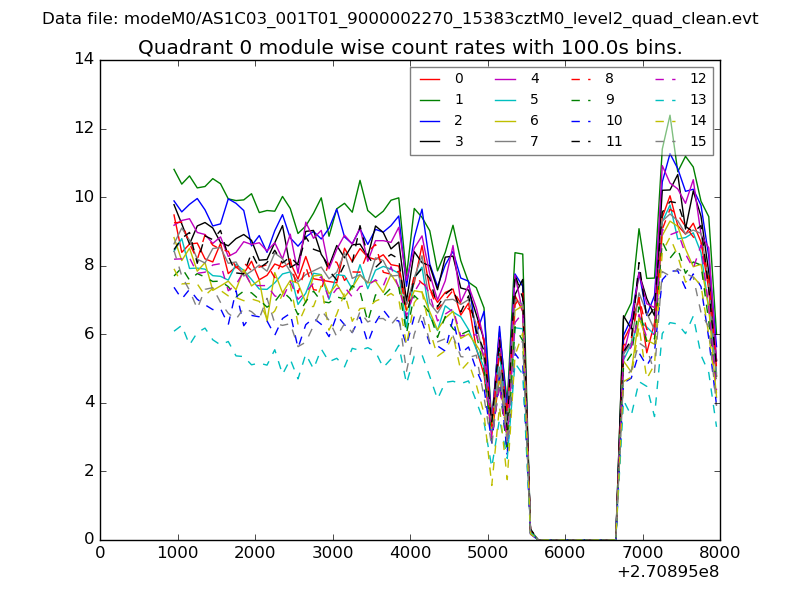 |
 |
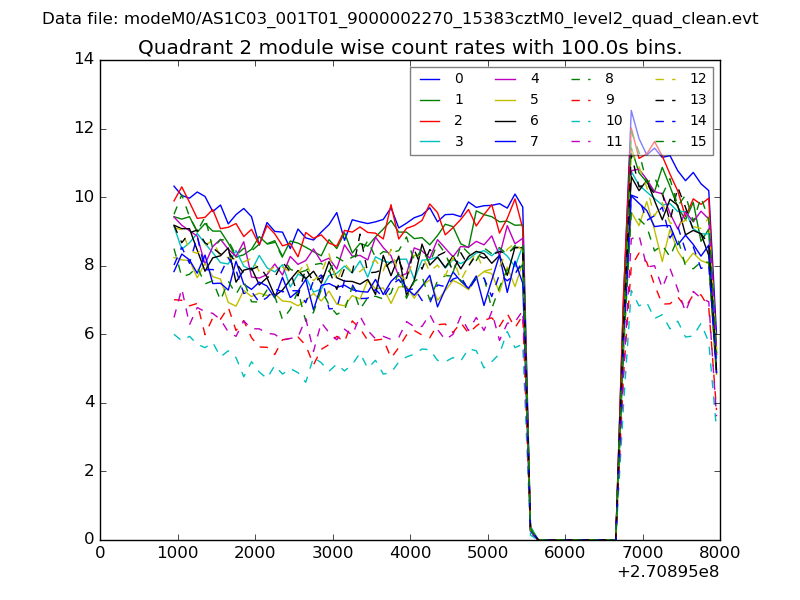
| Module-wise count rates for Quadrant B Data is divided into 100 sec bins |
 |
 |
| Module-wise count rates for Quadrant C Data is divided into 100 sec bins |
 |
 |
| Module-wise count rates for Quadrant D Data is divided into 100 sec bins |
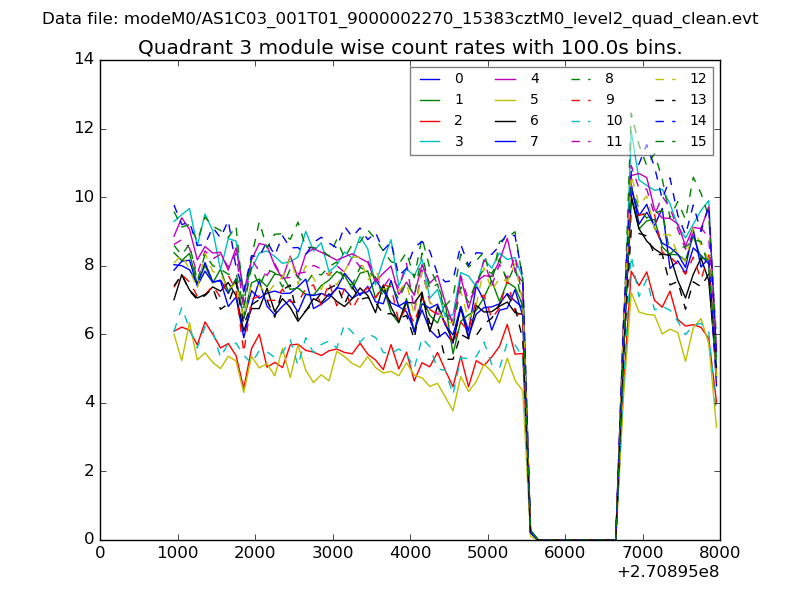 |
 |
| Parameter | Plot |
|---|---|
| CZT HV Monitor | 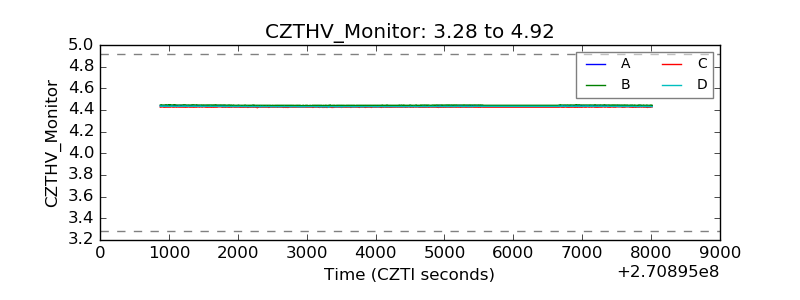 |
| D_VDD | 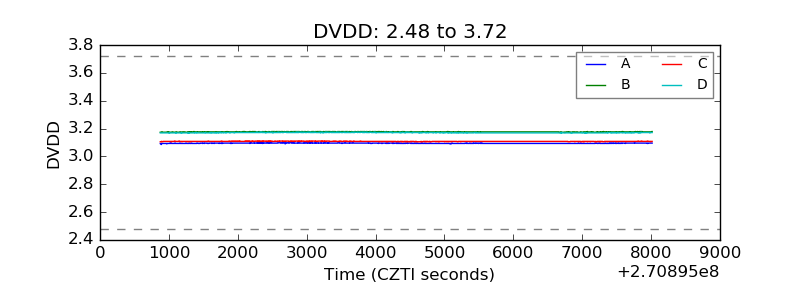 |
| Temperature 1 | 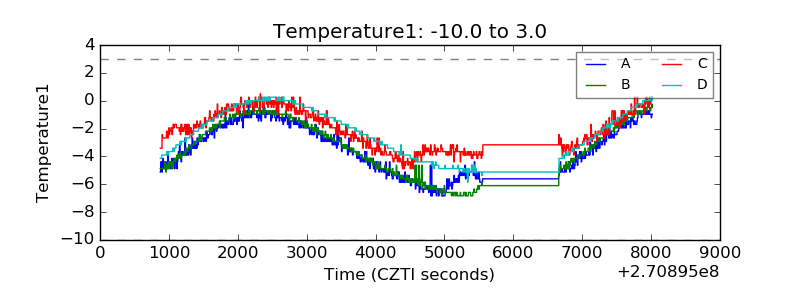 |
| Veto HV Monitor | 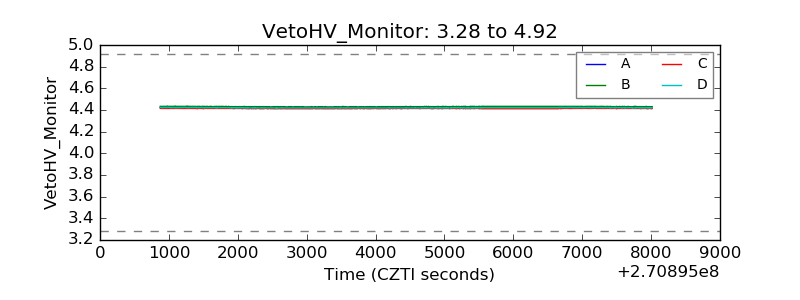 |
| Veto LLD | 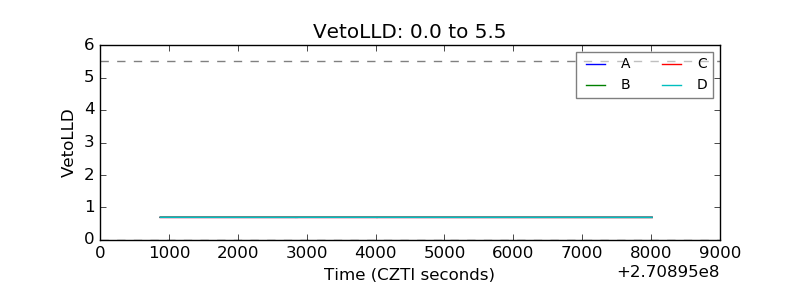 |
| Alpha Counter | 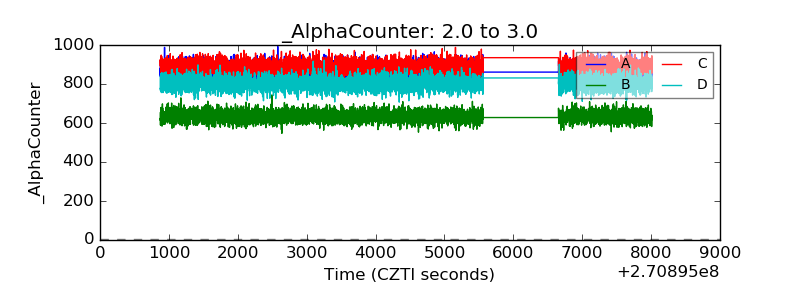 |
| _CPM_Rate | 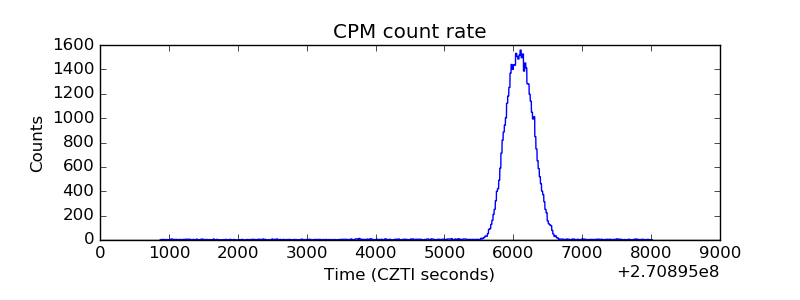 |
| CZT Counter | 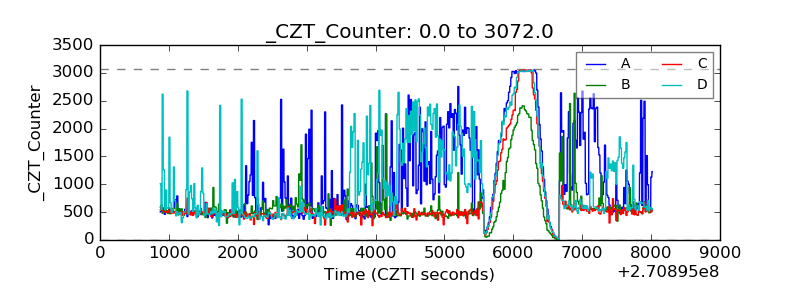 |
| +2.5 Volts monitor | 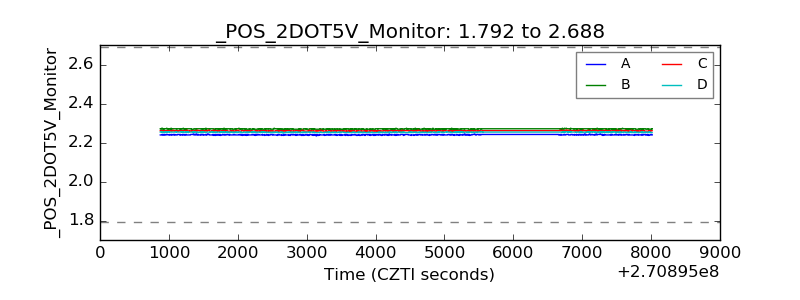 |
| +5 Volts monitor | 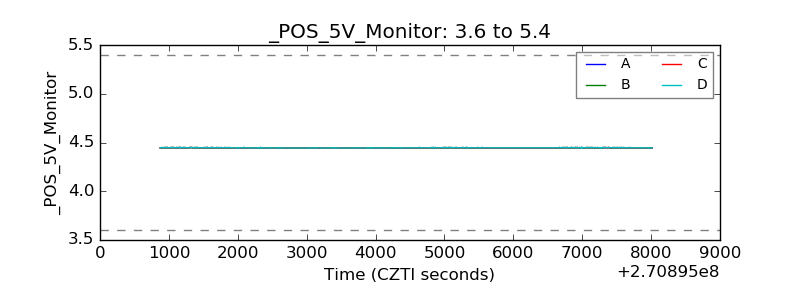 |
| _ROLL_ROT | 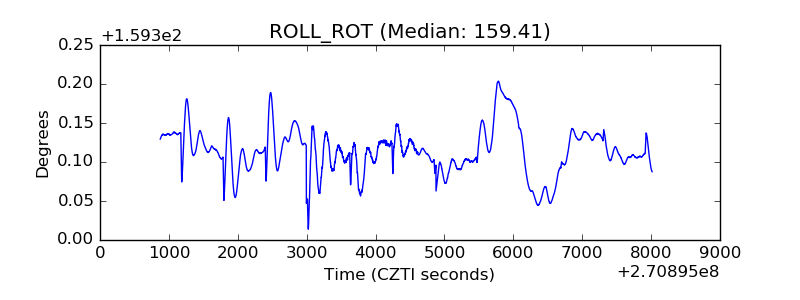 |
| _Roll_DEC | 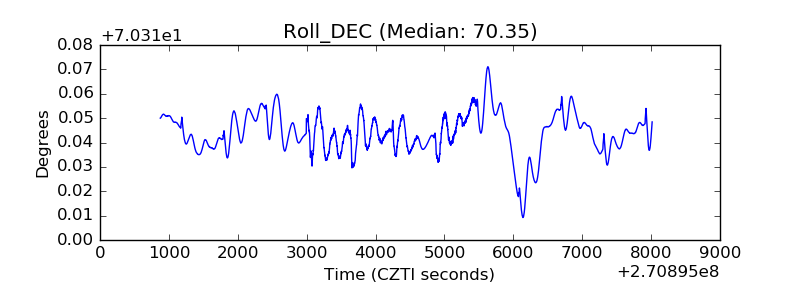 |
| _Roll_RA | 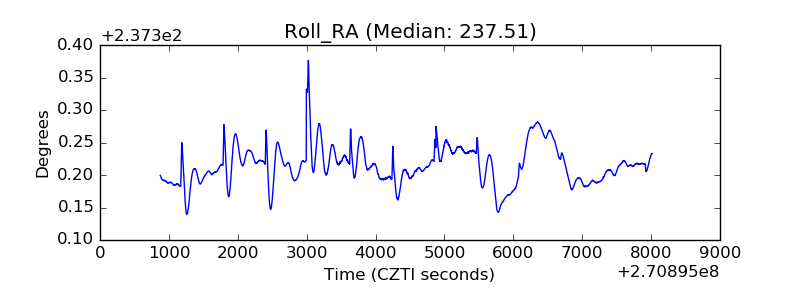 |
| Veto Counter | 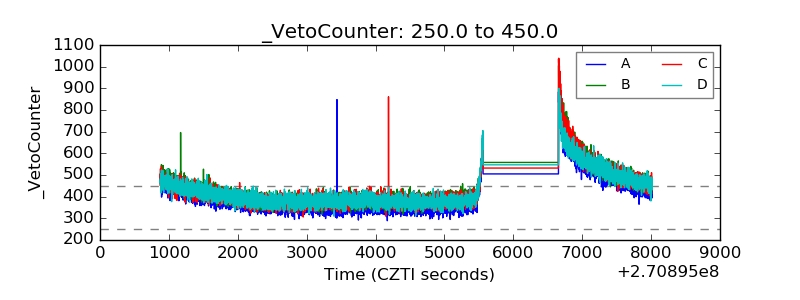 |