| Param | Original file | Final file |
|---|---|---|
| Filename | modeM0/AS1C03_001T01_9000002270_15384cztM0_level2.evt | modeM0/AS1C03_001T01_9000002270_15384cztM0_level2_quad_clean.evt |
| Size (bytes) | 741,556,800 | 117,132,480 |
| Size | 707.2 MB | 111.7 MB |
| Events in quadrant A | 6,557,972 | 714,439 |
| Events in quadrant B | 4,497,007 | 825,524 |
| Events in quadrant C | 3,264,552 | 826,368 |
| Events in quadrant D | 7,713,201 | 740,437 |
| Mode SS | |||
|---|---|---|---|
| Quadrant | BADHDUFLAG | Total packets | Discarded packets |
| A | 0 | 128 | 0 |
| B | 0 | 128 | 0 |
| C | 0 | 128 | 0 |
| D | 0 | 128 | 0 |
| Mode M0 | |||
|---|---|---|---|
| Quadrant | BADHDUFLAG | Total packets | Discarded packets |
| A | 0 | 23691 | 2 |
| B | 0 | 17423 | 1 |
| C | 0 | 13360 | 1 |
| D | 0 | 27199 | 1 |
| Mode M9 | |||
|---|---|---|---|
| Quadrant | BADHDUFLAG | Total packets | Discarded packets |
| A | 0 | 12 | 0 |
| B | 0 | 12 | 0 |
| C | 0 | 12 | 0 |
| D | 0 | 12 | 0 |
| Quadrant | Total seconds | Saturated seconds | Saturation percentage |
|---|---|---|---|
| A | 6295 | 1614 | 25.639396% |
| B | 6295 | 329 | 5.226370% |
| C | 6295 | 67 | 1.064337% |
| D | 6295 | 1490 | 23.669579% |
Noise dominated data is calculated using 1-second bins in cleaned event files. If a bin has >2000 counts, and if more than 50% of those come from <1% of pixels, then it is considered to be noise-dominated and hence unusable.
| Quadrant | # 1 sec bins | Bins with >0 counts | Bins with >2000 counts | High rate bins dominated by noise | Noise dominated (total time) | Noise dominated (detector-on time) | Marked lightcurve |
|---|---|---|---|---|---|---|---|
| A | 7486 | 6296 | 879 | 879 | 11.74% | 13.96% | 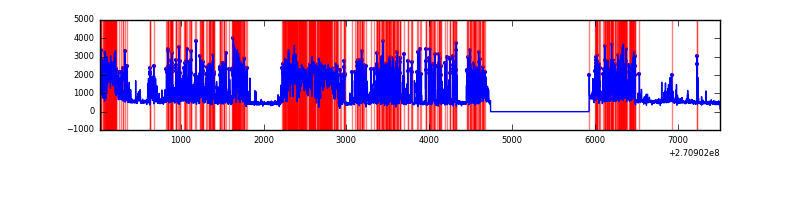 |
| B | 7486 | 6296 | 193 | 193 | 2.58% | 3.07% | 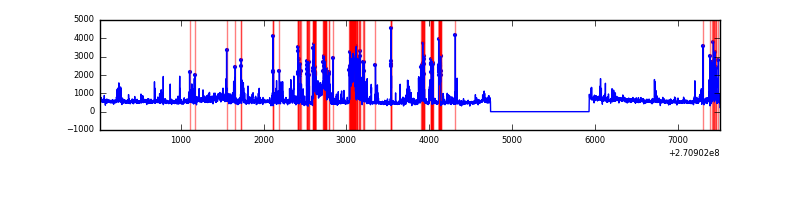 |
| C | 7486 | 6296 | 2 | 2 | 0.03% | 0.03% | 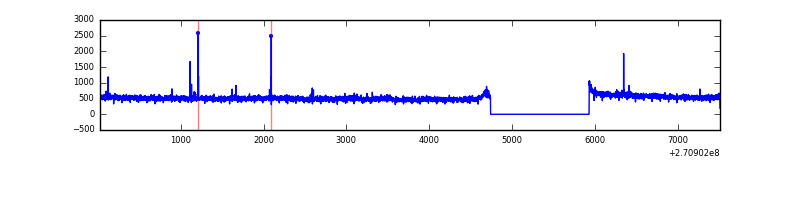 |
| D | 7486 | 6296 | 1244 | 1244 | 16.62% | 19.76% | 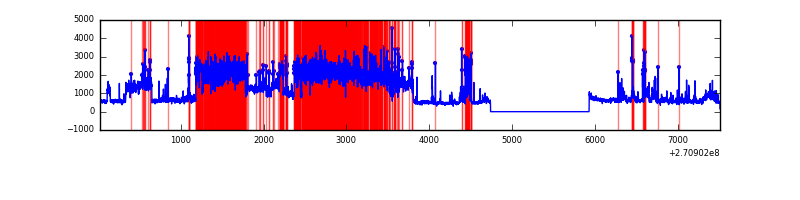 |
Top three noisy pixels from each quadrant. If the there are fewer than three noisy pixels in the level2.evt file, extra rows are filled as -1
| Pixel properties | Quadrant properties | ||||||
|---|---|---|---|---|---|---|---|
| Quadrant | DetID | PixID | Counts | Sigma | Mean | Median | Sigma |
| A | 14 | 238 | 2974051 | 22082.5 | 679 | 667 | 134.6 |
| A | 14 | 237 | 929013 | 6894.57 | 679 | 667 | 134.6 |
| A | 9 | 143 | 27143 | 196.63 | 679 | 667 | 134.6 |
| B | 10 | 245 | 665554 | 4673.81 | 768 | 750 | 142.2 |
| B | 10 | 16 | 329353 | 2310.2 | 768 | 750 | 142.2 |
| B | 7 | 220 | 98098 | 684.39 | 768 | 750 | 142.2 |
| C | 3 | 233 | 285102 | 1655.73 | 758 | 761 | 171.7 |
| C | 0 | 207 | 14998 | 82.9 | 758 | 761 | 171.7 |
| C | 10 | 22 | 7737 | 40.62 | 758 | 761 | 171.7 |
| D | 13 | 122 | 4314624 | 24213.12 | 729 | 707 | 178.2 |
| D | 2 | 33 | 201599 | 1127.56 | 729 | 707 | 178.2 |
| D | 5 | 222 | 143093 | 799.18 | 729 | 707 | 178.2 |
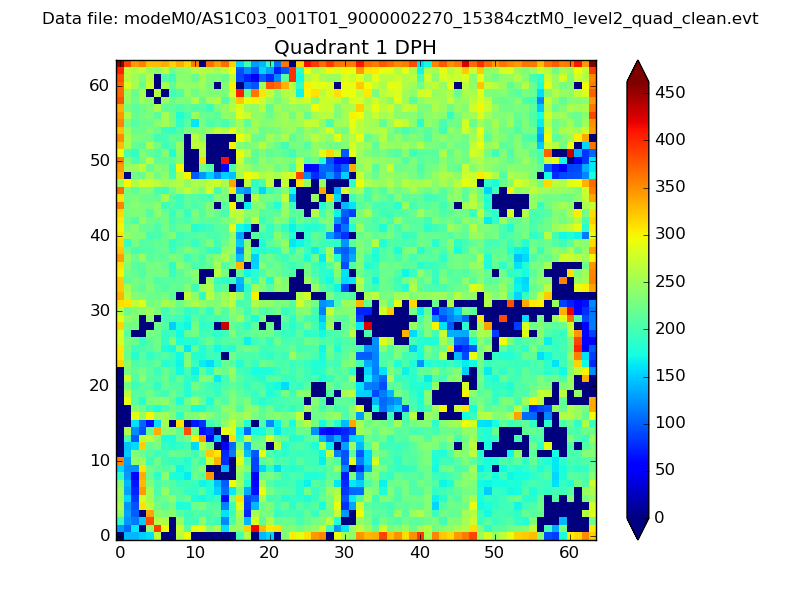
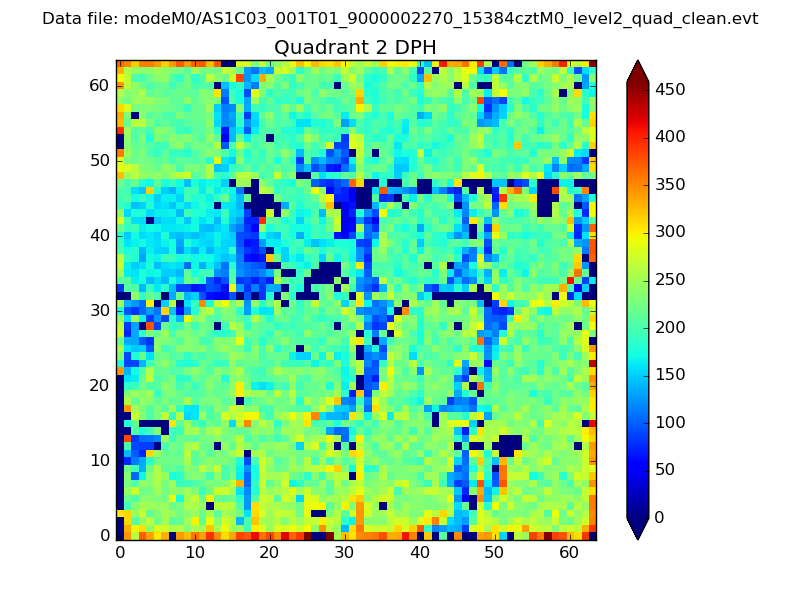
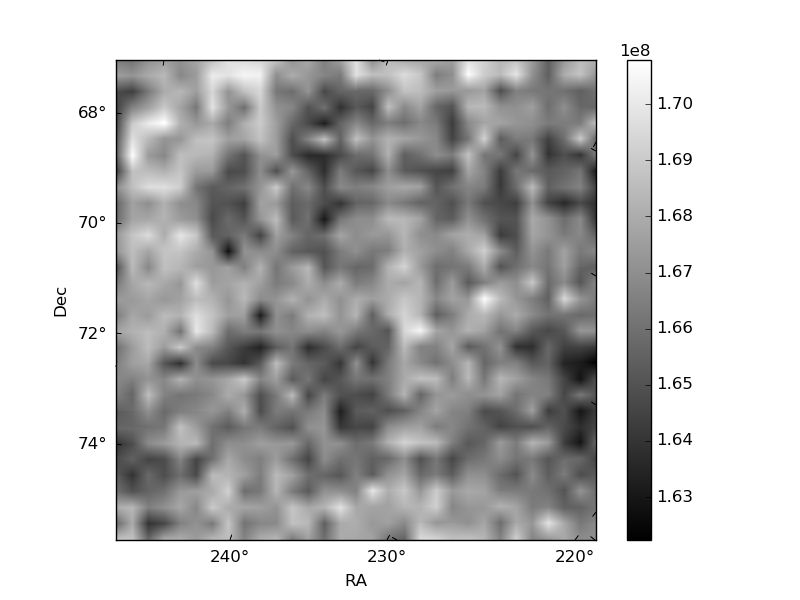
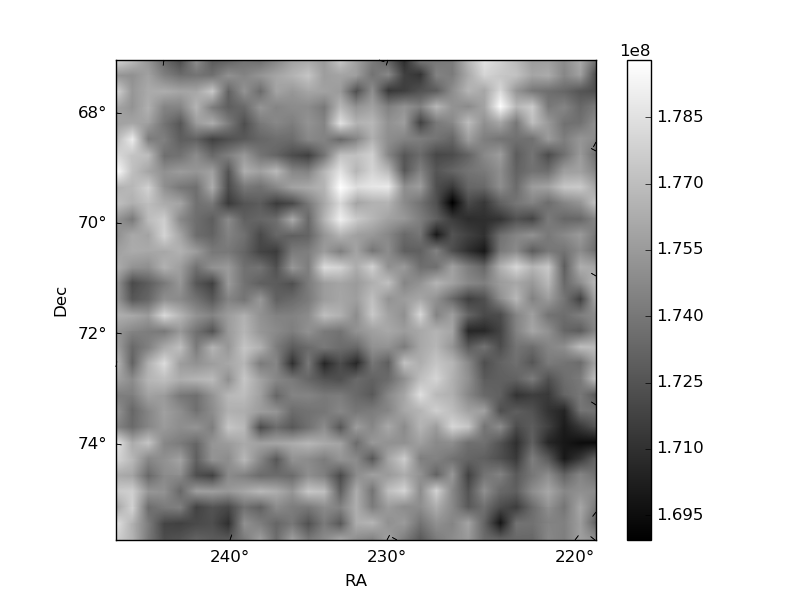
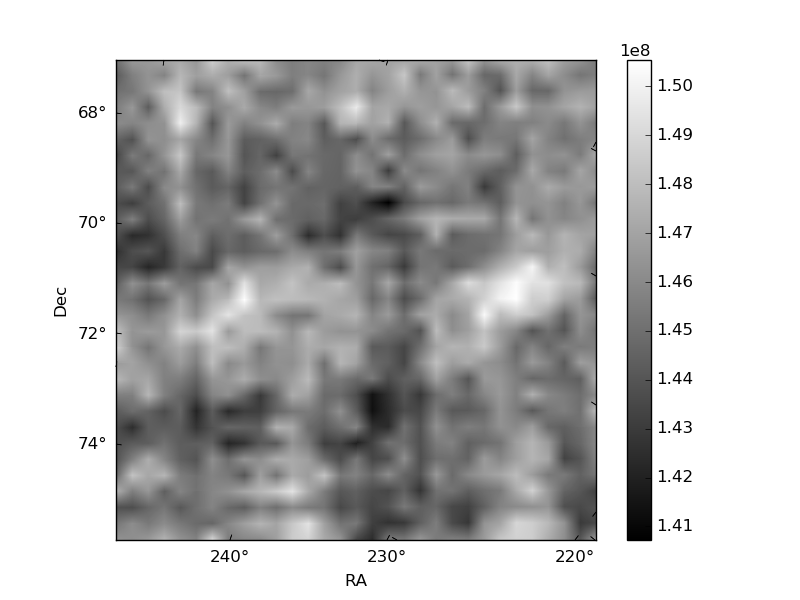
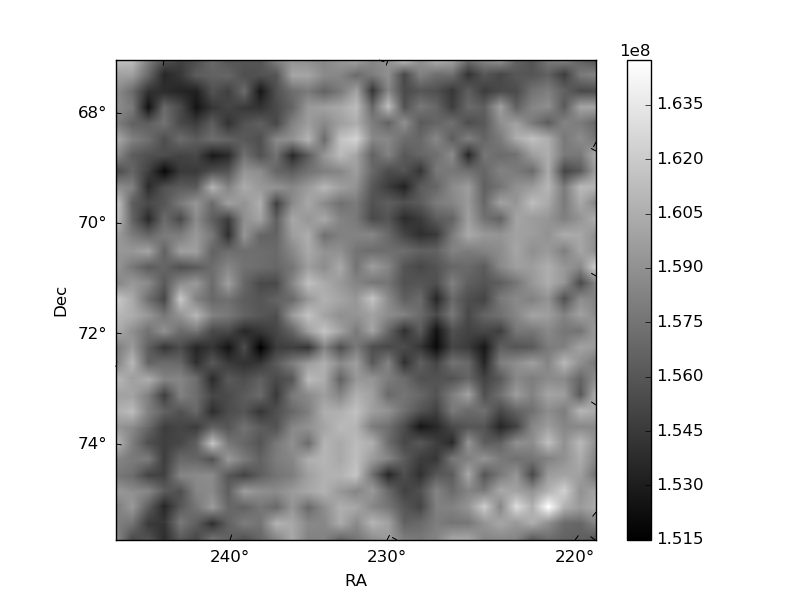
Histogram calculated using DETX and DETY for each event in the final _common_clean file
| Quadrant A |  |
 |
Quadrant B |
|---|---|---|---|
| Quadrant D | 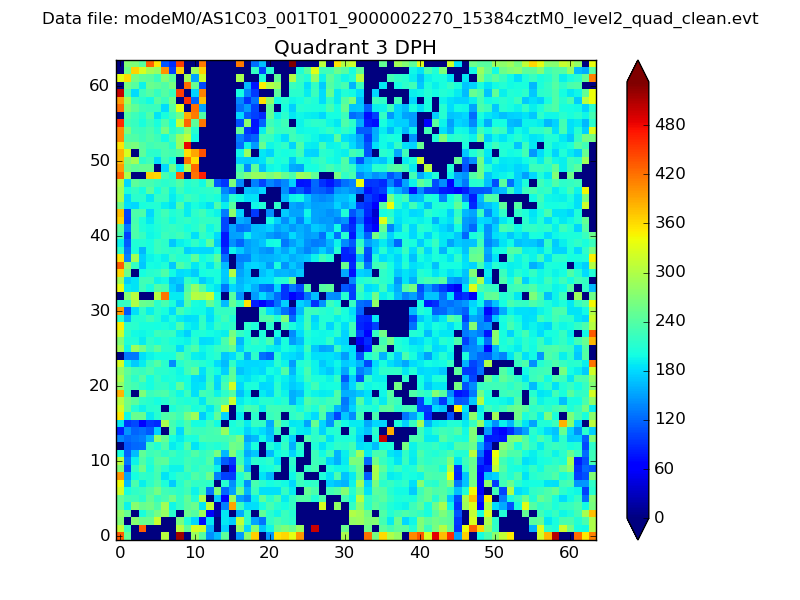 |
 |
Quadrant C |
| Plot type | Count rate plots | Images |
|---|---|---|
| Comparison with Poisson distribution Blue bars denote a histogram of data divided into 1 sec bins. Red curve is a Poisson curve with rate = median count rate of data. |
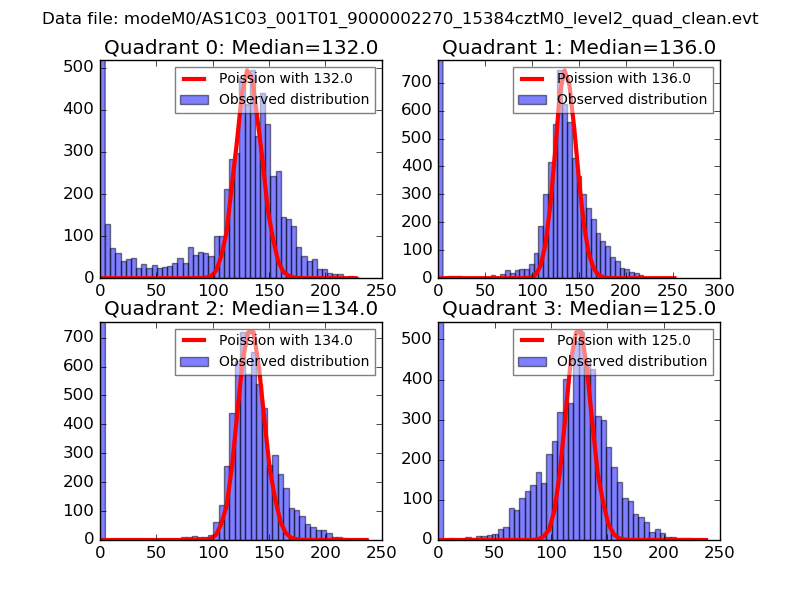 |
 |
| Quadrant-wise count rates Data is divided into 100 sec bins |
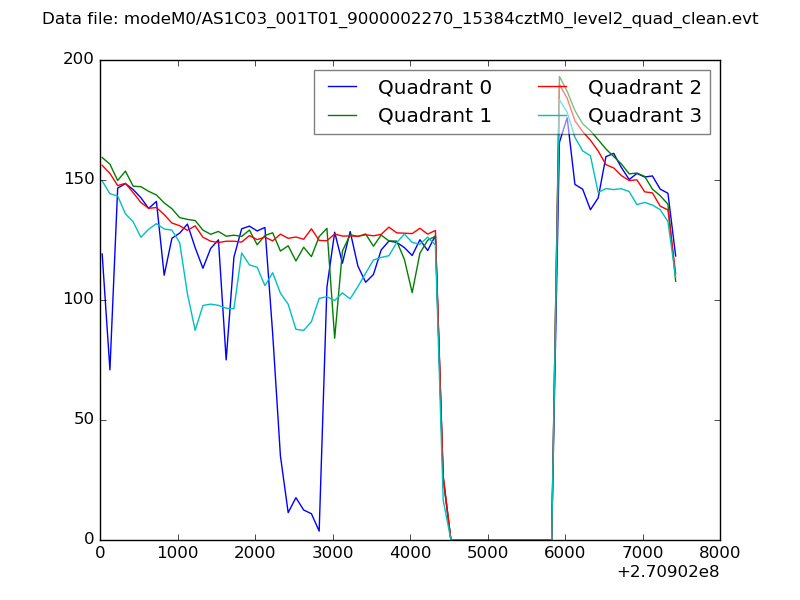 |
|
| Module-wise count rates for Quadrant A Data is divided into 100 sec bins |
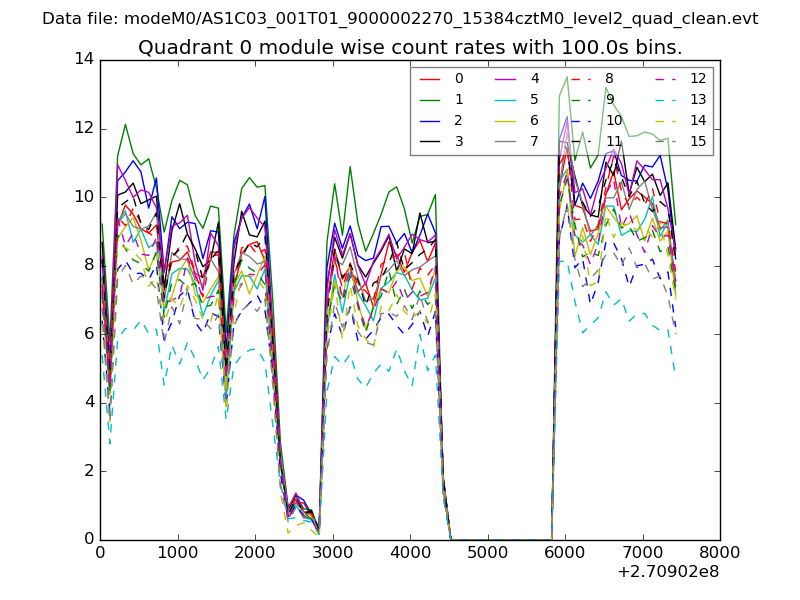 |
 |
| Module-wise count rates for Quadrant B Data is divided into 100 sec bins |
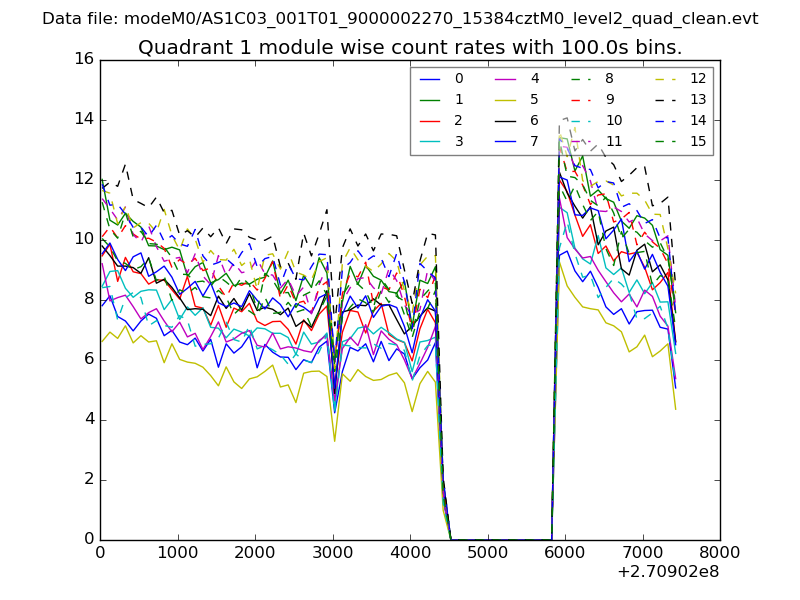 |
 |
| Module-wise count rates for Quadrant C Data is divided into 100 sec bins |
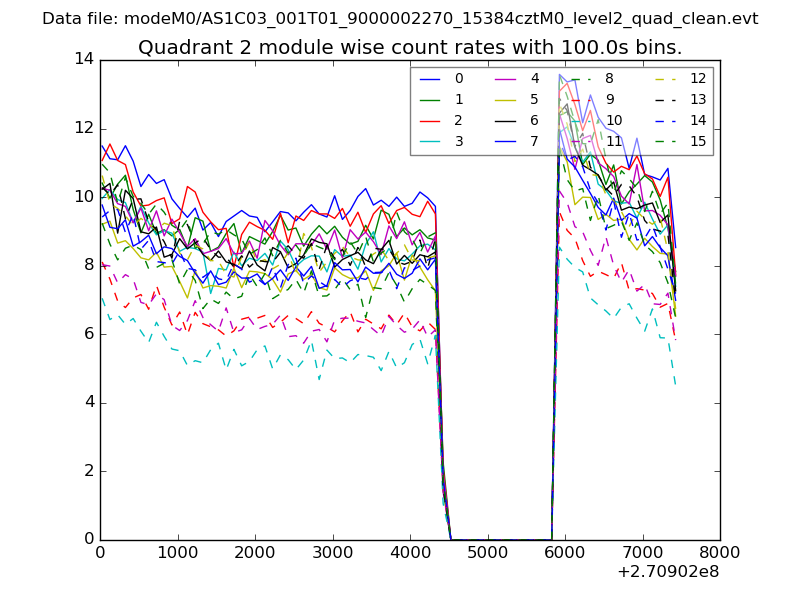 |
 |
| Module-wise count rates for Quadrant D Data is divided into 100 sec bins |
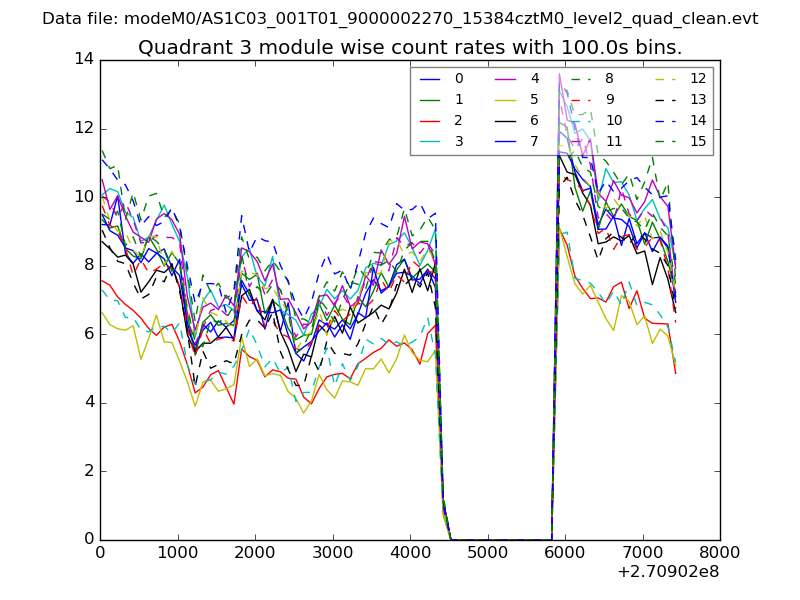 |
 |
| Parameter | Plot |
|---|---|
| CZT HV Monitor | 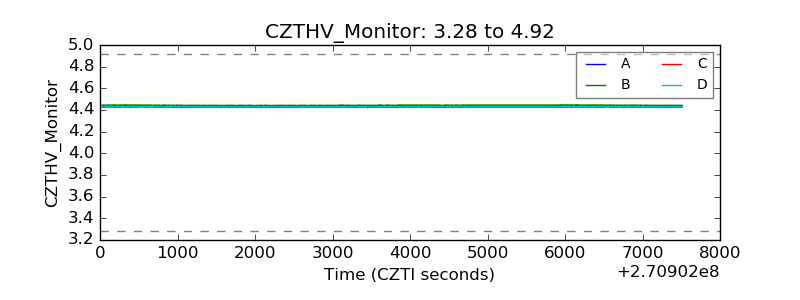 |
| D_VDD | 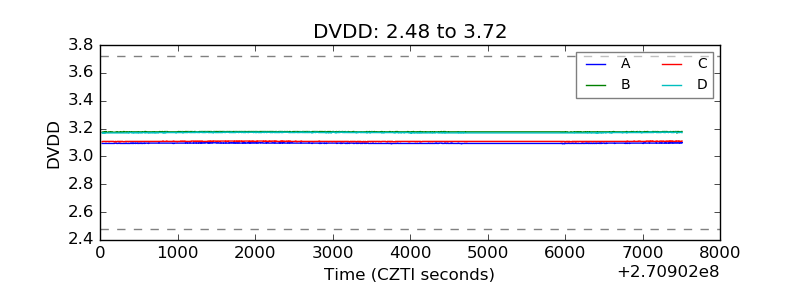 |
| Temperature 1 | 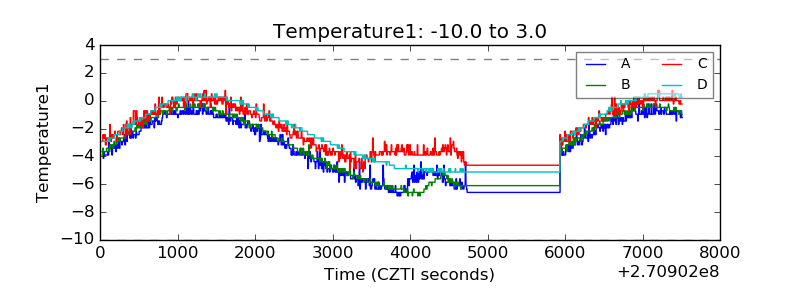 |
| Veto HV Monitor | 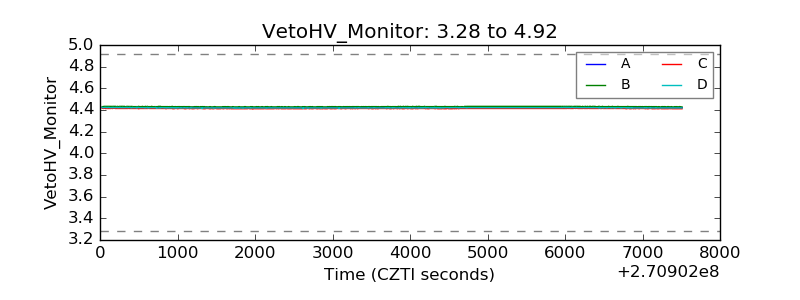 |
| Veto LLD | 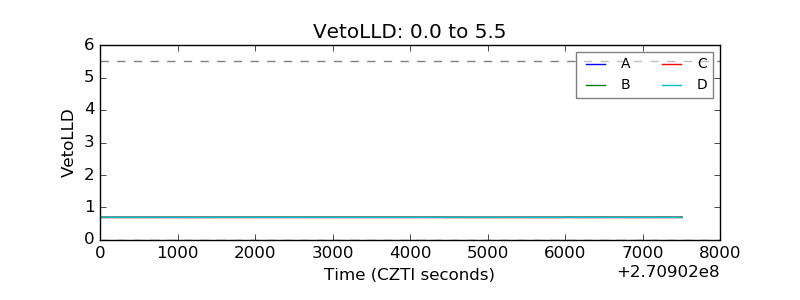 |
| Alpha Counter | 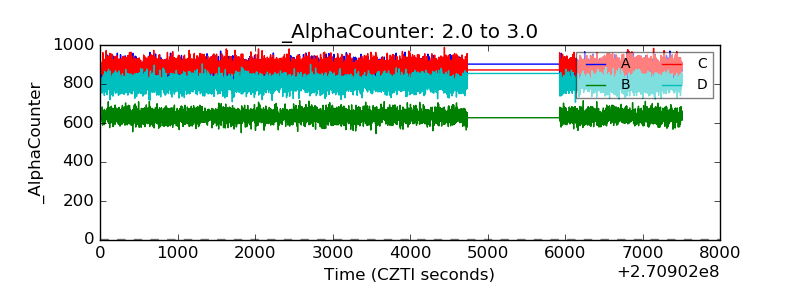 |
| _CPM_Rate | 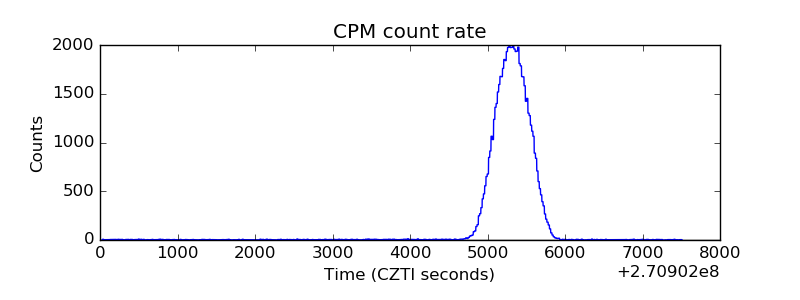 |
| CZT Counter | 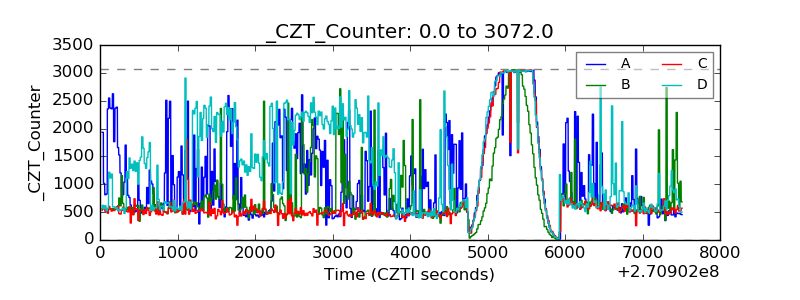 |
| +2.5 Volts monitor | 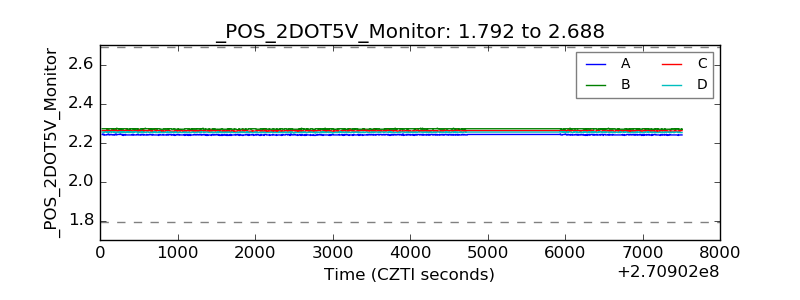 |
| +5 Volts monitor | 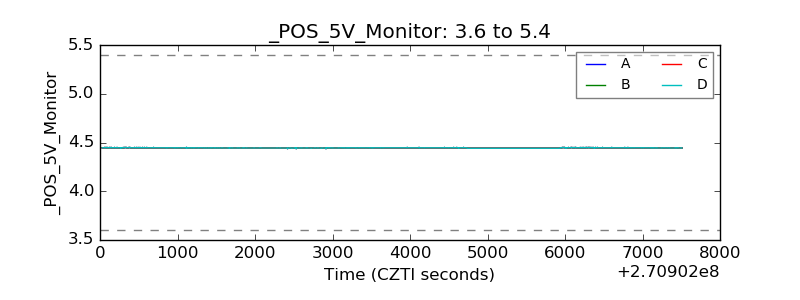 |
| _ROLL_ROT | 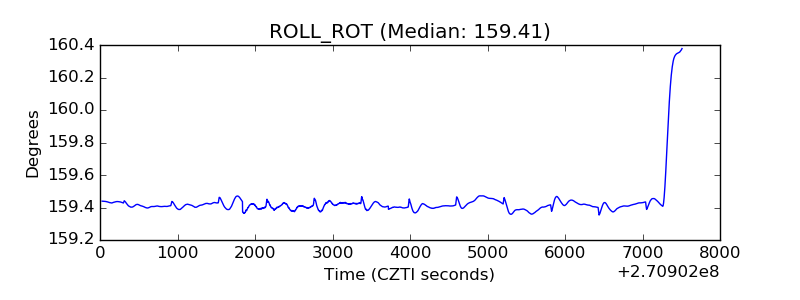 |
| _Roll_DEC | 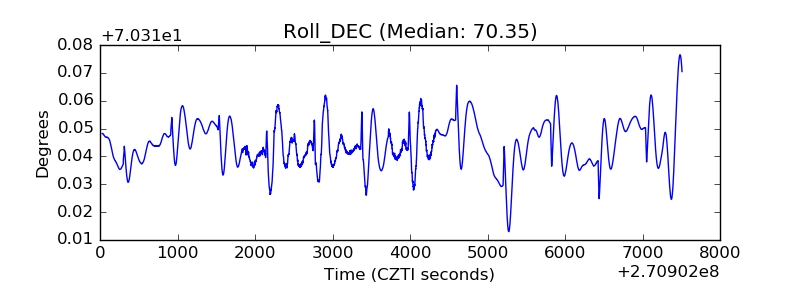 |
| _Roll_RA |  |
| Veto Counter | 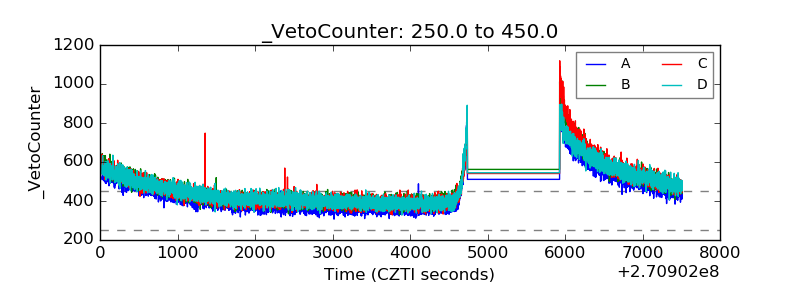 |