| Param | Original file | Final file |
|---|---|---|
| Filename | modeM0/AS1C03_001T01_9000002270_15386cztM0_level2.evt | modeM0/AS1C03_001T01_9000002270_15386cztM0_level2_quad_clean.evt |
| Size (bytes) | 570,623,040 | 111,850,560 |
| Size | 544.2 MB | 106.7 MB |
| Events in quadrant A | 3,736,667 | 724,713 |
| Events in quadrant B | 4,355,031 | 751,172 |
| Events in quadrant C | 3,726,154 | 761,416 |
| Events in quadrant D | 5,044,505 | 717,868 |
| Mode SS | |||
|---|---|---|---|
| Quadrant | BADHDUFLAG | Total packets | Discarded packets |
| A | 0 | 126 | 0 |
| B | 0 | 126 | 0 |
| C | 0 | 126 | 0 |
| D | 0 | 126 | 0 |
| Mode M0 | |||
|---|---|---|---|
| Quadrant | BADHDUFLAG | Total packets | Discarded packets |
| A | 0 | 15187 | 2 |
| B | 0 | 17174 | 1 |
| C | 0 | 15176 | 1 |
| D | 0 | 19344 | 1 |
| Mode M9 | |||
|---|---|---|---|
| Quadrant | BADHDUFLAG | Total packets | Discarded packets |
| A | 0 | 13 | 0 |
| B | 0 | 13 | 0 |
| C | 0 | 13 | 0 |
| D | 0 | 13 | 0 |
| Quadrant | Total seconds | Saturated seconds | Saturation percentage |
|---|---|---|---|
| A | 6190 | 392 | 6.332795% |
| B | 6190 | 308 | 4.975767% |
| C | 6190 | 40 | 0.646204% |
| D | 6190 | 284 | 4.588045% |
Noise dominated data is calculated using 1-second bins in cleaned event files. If a bin has >2000 counts, and if more than 50% of those come from <1% of pixels, then it is considered to be noise-dominated and hence unusable.
| Quadrant | # 1 sec bins | Bins with >0 counts | Bins with >2000 counts | High rate bins dominated by noise | Noise dominated (total time) | Noise dominated (detector-on time) | Marked lightcurve |
|---|---|---|---|---|---|---|---|
| A | 7516 | 6192 | 187 | 187 | 2.49% | 3.02% | 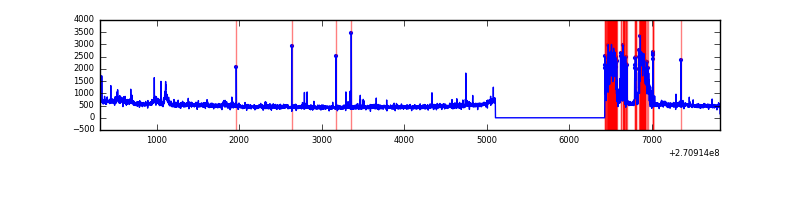 |
| B | 7516 | 6192 | 188 | 188 | 2.50% | 3.04% | 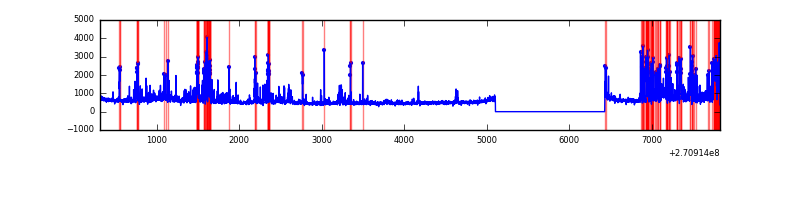 |
| C | 7516 | 6192 | 0 | 0 | 0.00% | 0.00% | 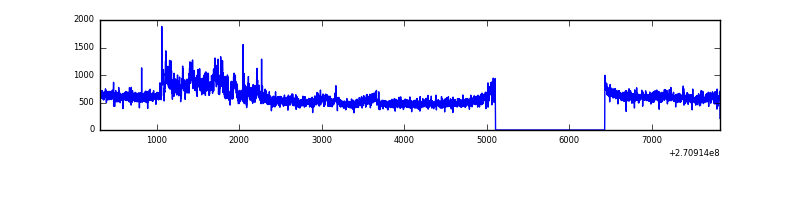 |
| D | 7516 | 6192 | 282 | 282 | 3.75% | 4.55% | 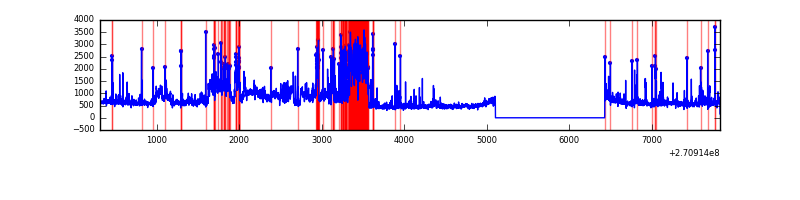 |
Top three noisy pixels from each quadrant. If the there are fewer than three noisy pixels in the level2.evt file, extra rows are filled as -1
| Pixel properties | Quadrant properties | ||||||
|---|---|---|---|---|---|---|---|
| Quadrant | DetID | PixID | Counts | Sigma | Mean | Median | Sigma |
| A | 14 | 238 | 722503 | 4770.54 | 752 | 738 | 151.3 |
| A | 14 | 237 | 61456 | 401.32 | 752 | 738 | 151.3 |
| A | 3 | 80 | 32423 | 209.42 | 752 | 738 | 151.3 |
| B | 10 | 245 | 673263 | 4755.86 | 773 | 756 | 141.4 |
| B | 7 | 220 | 95413 | 669.4 | 773 | 756 | 141.4 |
| B | 0 | 219 | 93200 | 653.75 | 773 | 756 | 141.4 |
| C | 3 | 233 | 703506 | 4008.67 | 771 | 777 | 175.3 |
| C | 0 | 207 | 11662 | 62.09 | 771 | 777 | 175.3 |
| C | 7 | 247 | 6927 | 35.08 | 771 | 777 | 175.3 |
| D | 13 | 122 | 1524085 | 8161.24 | 770 | 749 | 186.7 |
| D | 7 | 38 | 250009 | 1335.4 | 770 | 749 | 186.7 |
| D | 5 | 222 | 61589 | 325.95 | 770 | 749 | 186.7 |
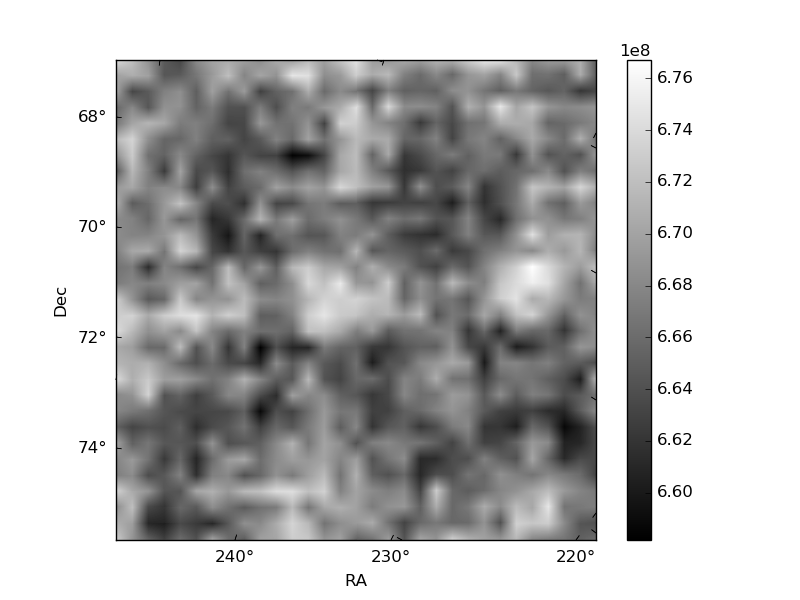
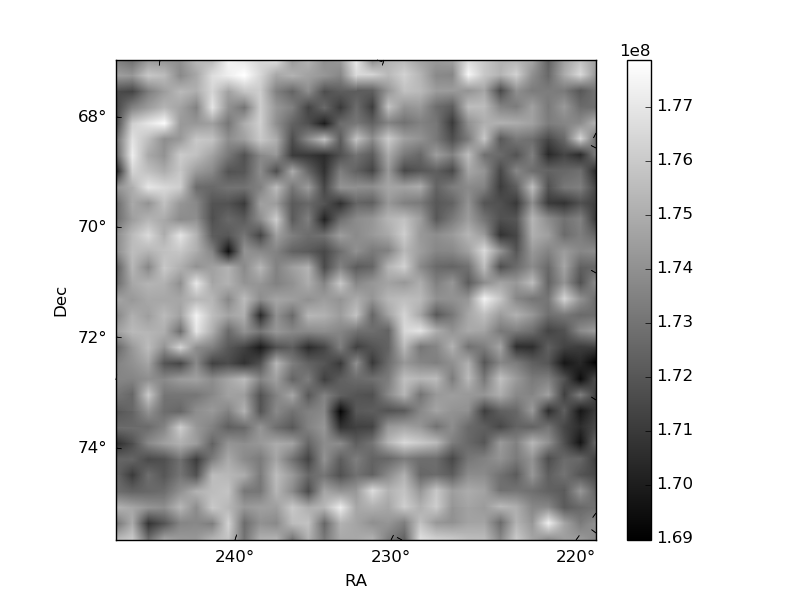
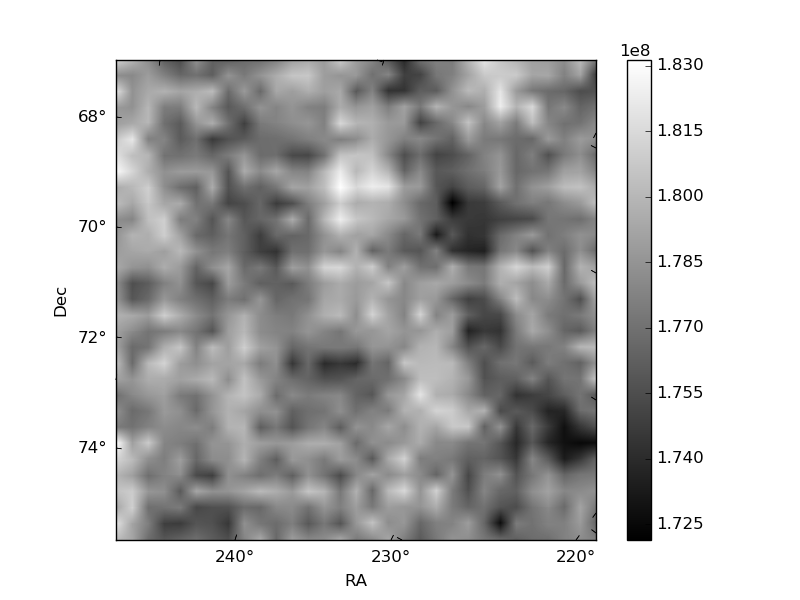
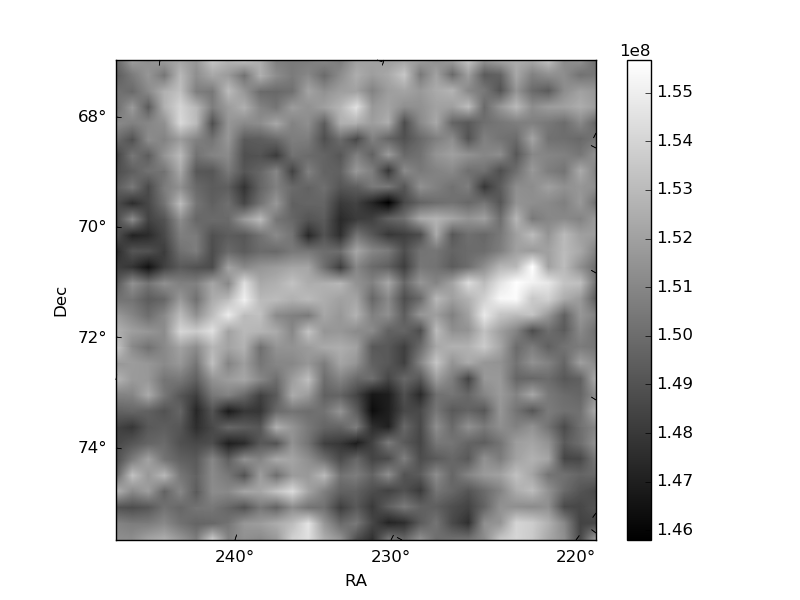
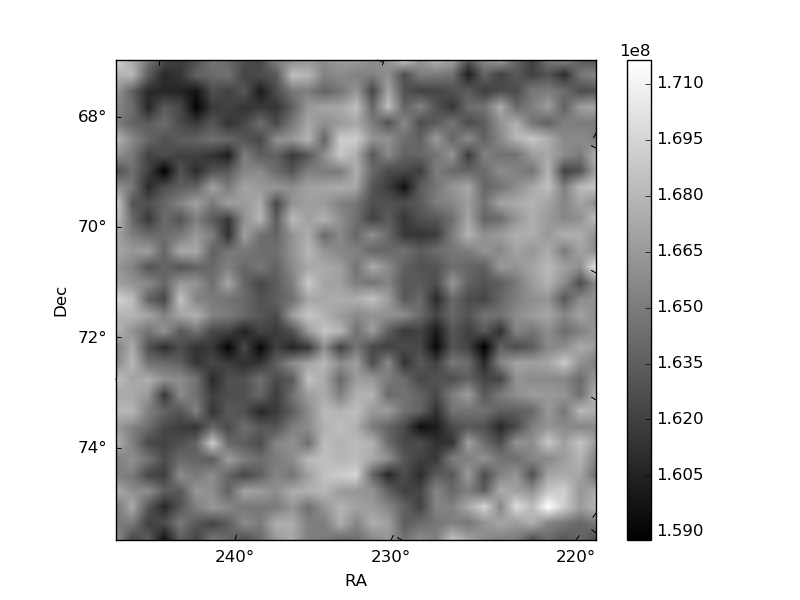
Histogram calculated using DETX and DETY for each event in the final _common_clean file
| Quadrant A |  |
 |
Quadrant B |
|---|---|---|---|
| Quadrant D |  |
 |
Quadrant C |
| Plot type | Count rate plots | Images |
|---|---|---|
| Comparison with Poisson distribution Blue bars denote a histogram of data divided into 1 sec bins. Red curve is a Poisson curve with rate = median count rate of data. |
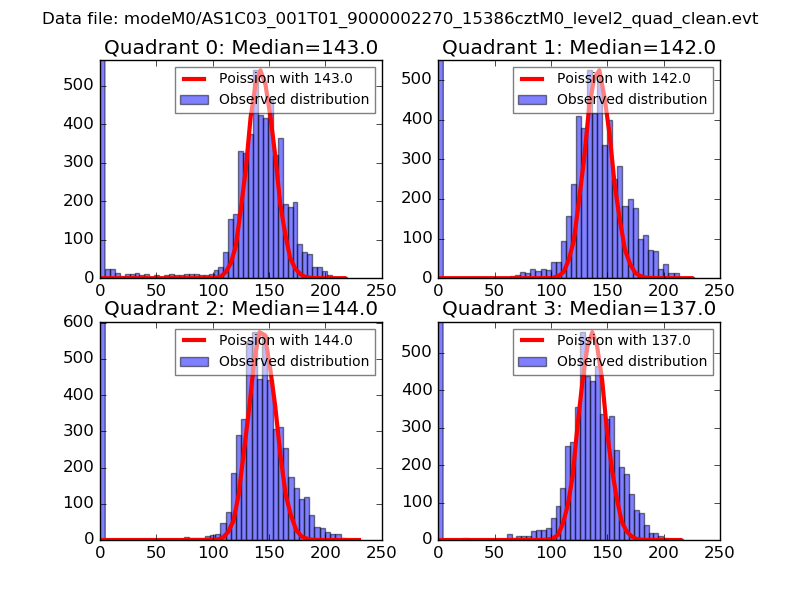 |
 |
| Quadrant-wise count rates Data is divided into 100 sec bins |
 |
|
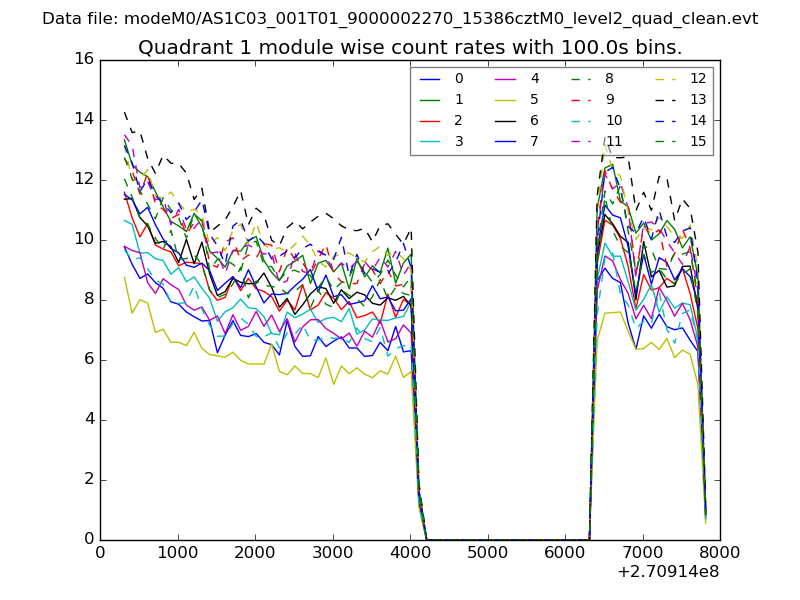
| Module-wise count rates for Quadrant A Data is divided into 100 sec bins |
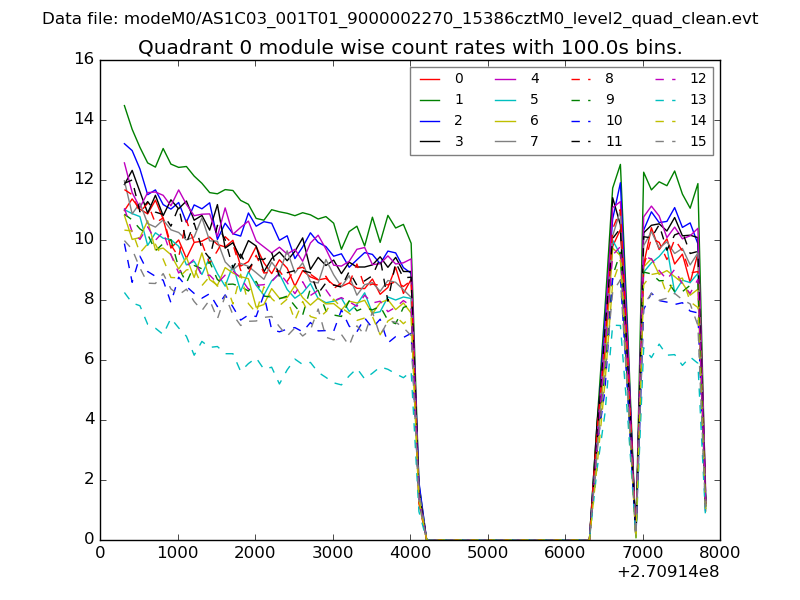 |
 |
| Module-wise count rates for Quadrant B Data is divided into 100 sec bins |
 |
 |
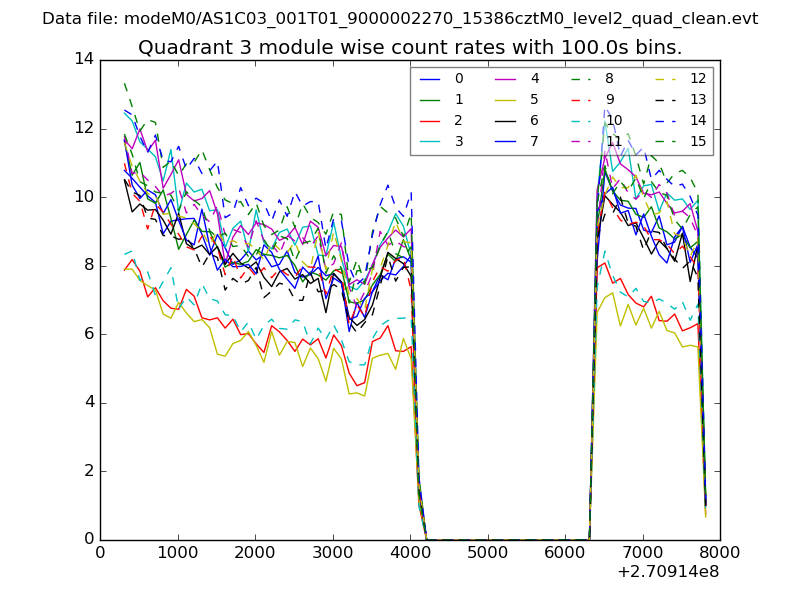
| Module-wise count rates for Quadrant C Data is divided into 100 sec bins |
 |
 |
| Module-wise count rates for Quadrant D Data is divided into 100 sec bins |
 |
 |
| Parameter | Plot |
|---|---|
| CZT HV Monitor |  |
| D_VDD | 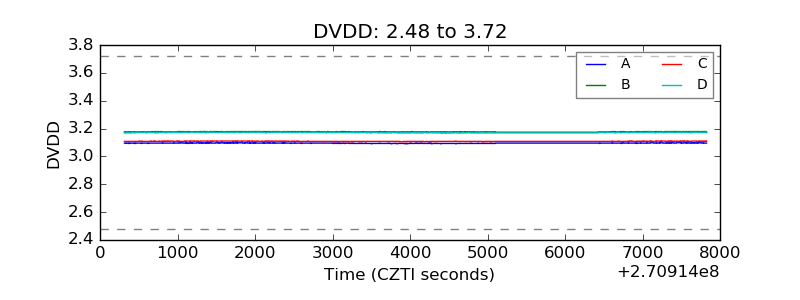 |
| Temperature 1 | 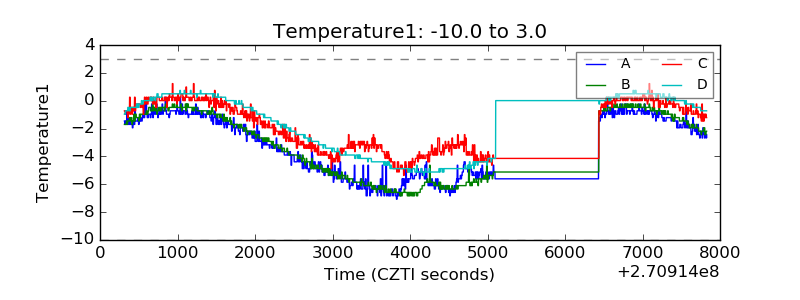 |
| Veto HV Monitor | 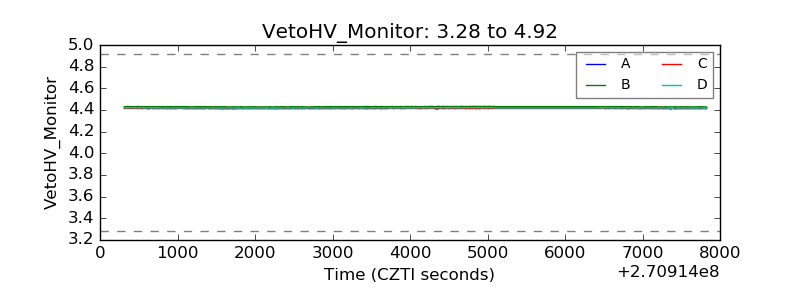 |
| Veto LLD | 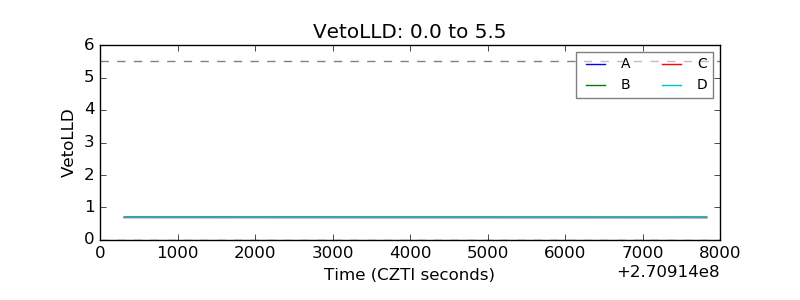 |
| Alpha Counter | 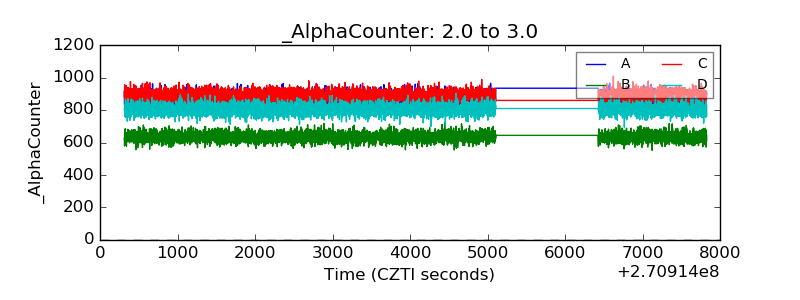 |
| _CPM_Rate | 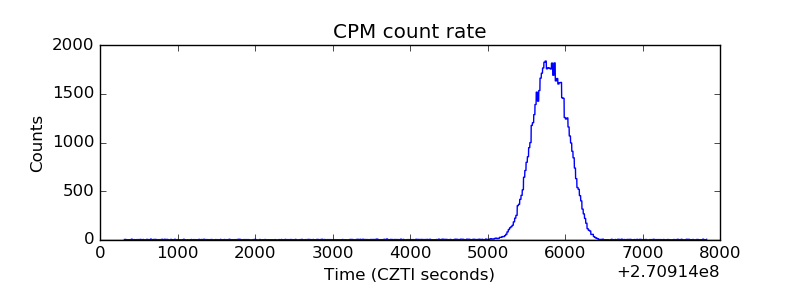 |
| CZT Counter | 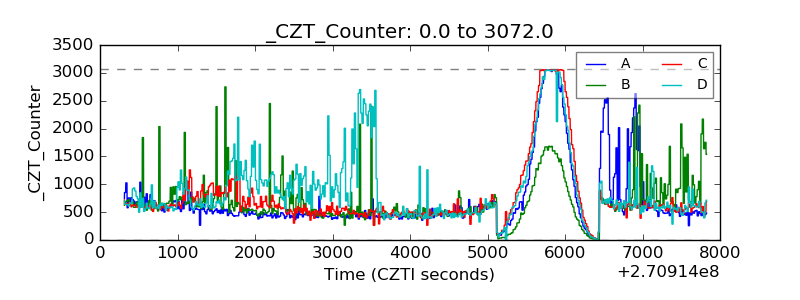 |
| +2.5 Volts monitor |  |
| +5 Volts monitor |  |
| _ROLL_ROT | 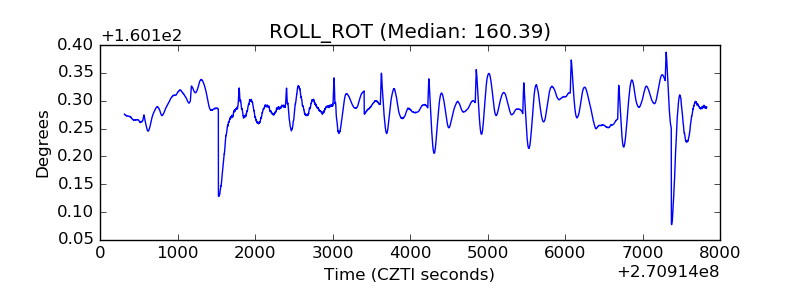 |
| _Roll_DEC | 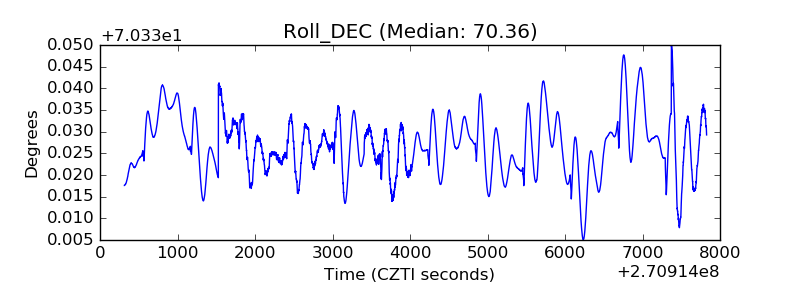 |
| _Roll_RA | 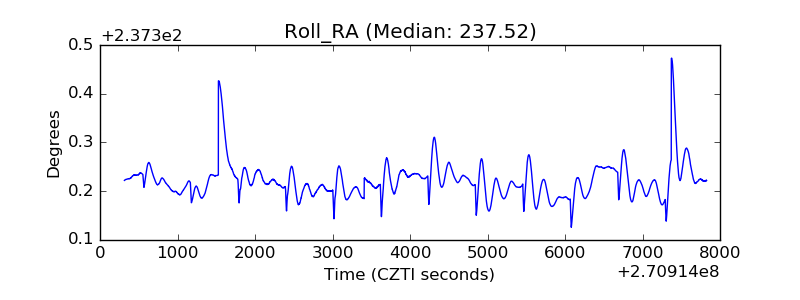 |
| Veto Counter | 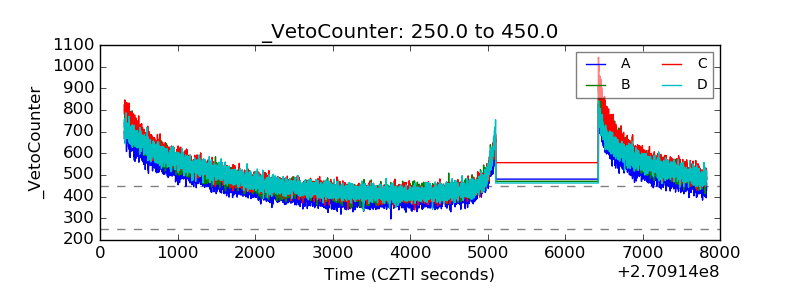 |