| Param | Original file | Final file |
|---|---|---|
| Filename | modeM0/AS1C03_001T01_9000002270_15387cztM0_level2.evt | modeM0/AS1C03_001T01_9000002270_15387cztM0_level2_quad_clean.evt |
| Size (bytes) | 620,288,640 | 100,071,360 |
| Size | 591.6 MB | 95.4 MB |
| Events in quadrant A | 4,231,771 | 649,109 |
| Events in quadrant B | 6,808,547 | 610,857 |
| Events in quadrant C | 3,230,184 | 689,574 |
| Events in quadrant D | 4,101,534 | 653,807 |
| Mode SS | |||
|---|---|---|---|
| Quadrant | BADHDUFLAG | Total packets | Discarded packets |
| A | 0 | 126 | 0 |
| B | 0 | 126 | 0 |
| C | 0 | 126 | 0 |
| D | 0 | 126 | 0 |
| Mode M0 | |||
|---|---|---|---|
| Quadrant | BADHDUFLAG | Total packets | Discarded packets |
| A | 0 | 16557 | 2 |
| B | 0 | 24334 | 1 |
| C | 0 | 13576 | 1 |
| D | 0 | 16352 | 1 |
| Mode M9 | |||
|---|---|---|---|
| Quadrant | BADHDUFLAG | Total packets | Discarded packets |
| A | 0 | 12 | 0 |
| B | 0 | 12 | 0 |
| C | 0 | 12 | 0 |
| D | 0 | 12 | 0 |
| Quadrant | Total seconds | Saturated seconds | Saturation percentage |
|---|---|---|---|
| A | 6102 | 449 | 7.358243% |
| B | 6102 | 1366 | 22.386103% |
| C | 6102 | 60 | 0.983284% |
| D | 6102 | 174 | 2.851524% |
Noise dominated data is calculated using 1-second bins in cleaned event files. If a bin has >2000 counts, and if more than 50% of those come from <1% of pixels, then it is considered to be noise-dominated and hence unusable.
| Quadrant | # 1 sec bins | Bins with >0 counts | Bins with >2000 counts | High rate bins dominated by noise | Noise dominated (total time) | Noise dominated (detector-on time) | Marked lightcurve |
|---|---|---|---|---|---|---|---|
| A | 7353 | 6103 | 224 | 224 | 3.05% | 3.67% | 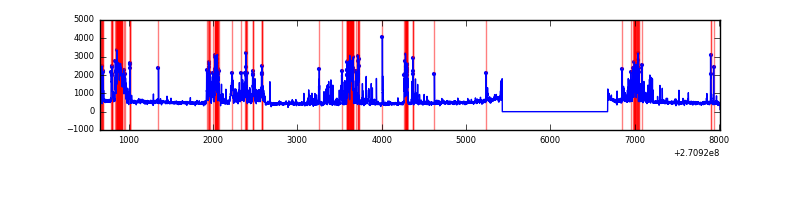 |
| B | 7353 | 6104 | 1126 | 1126 | 15.31% | 18.45% | 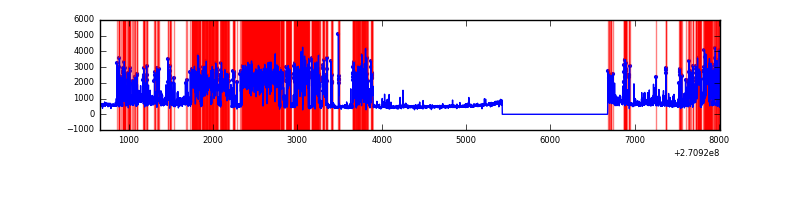 |
| C | 7353 | 6104 | 0 | 0 | 0.00% | 0.00% | 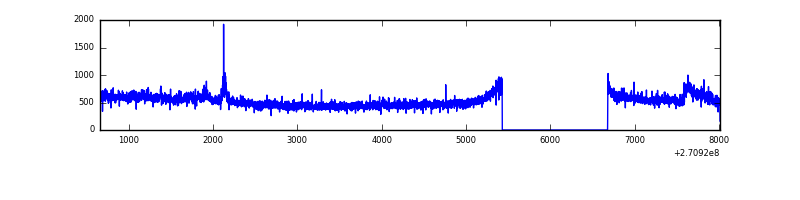 |
| D | 7353 | 6103 | 91 | 91 | 1.24% | 1.49% | 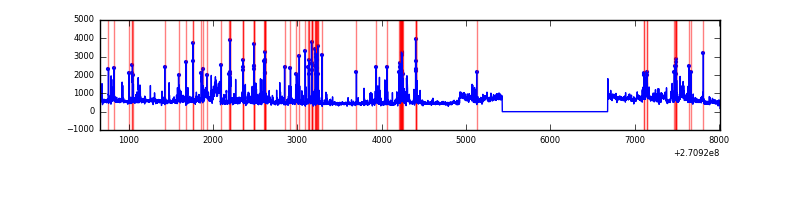 |
Top three noisy pixels from each quadrant. If the there are fewer than three noisy pixels in the level2.evt file, extra rows are filled as -1
| Pixel properties | Quadrant properties | ||||||
|---|---|---|---|---|---|---|---|
| Quadrant | DetID | PixID | Counts | Sigma | Mean | Median | Sigma |
| A | 14 | 238 | 999011 | 6991.53 | 719 | 705 | 142.8 |
| A | 14 | 237 | 413849 | 2893.41 | 719 | 705 | 142.8 |
| A | 9 | 143 | 27516 | 187.77 | 719 | 705 | 142.8 |
| B | 10 | 245 | 3461826 | 27033.36 | 696 | 679 | 128.0 |
| B | 0 | 245 | 151305 | 1176.47 | 696 | 679 | 128.0 |
| B | 7 | 220 | 145860 | 1133.94 | 696 | 679 | 128.0 |
| C | 3 | 233 | 318072 | 1882.9 | 740 | 746 | 168.5 |
| C | 7 | 247 | 23077 | 132.5 | 740 | 746 | 168.5 |
| C | 13 | 61 | 5387 | 27.54 | 740 | 746 | 168.5 |
| D | 13 | 122 | 375453 | 2088.6 | 737 | 716 | 179.4 |
| D | 7 | 38 | 243980 | 1355.84 | 737 | 716 | 179.4 |
| D | 2 | 33 | 197031 | 1094.17 | 737 | 716 | 179.4 |
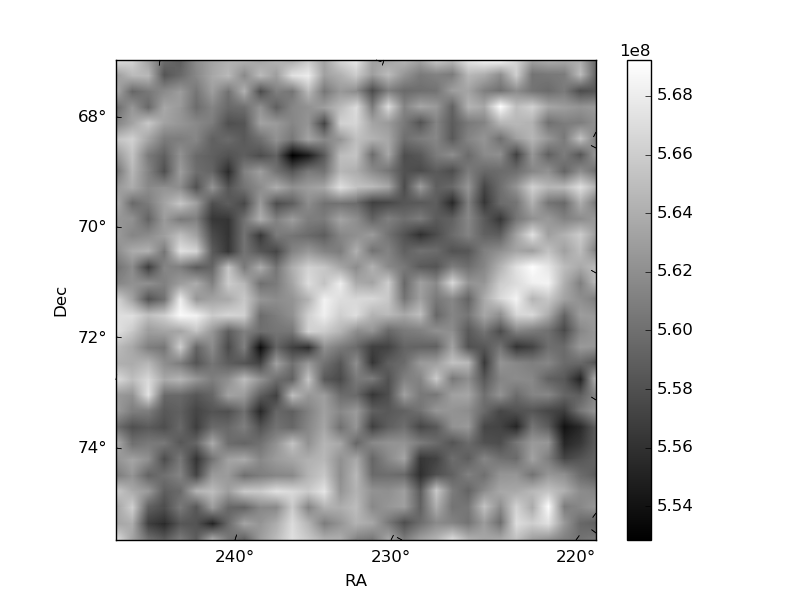
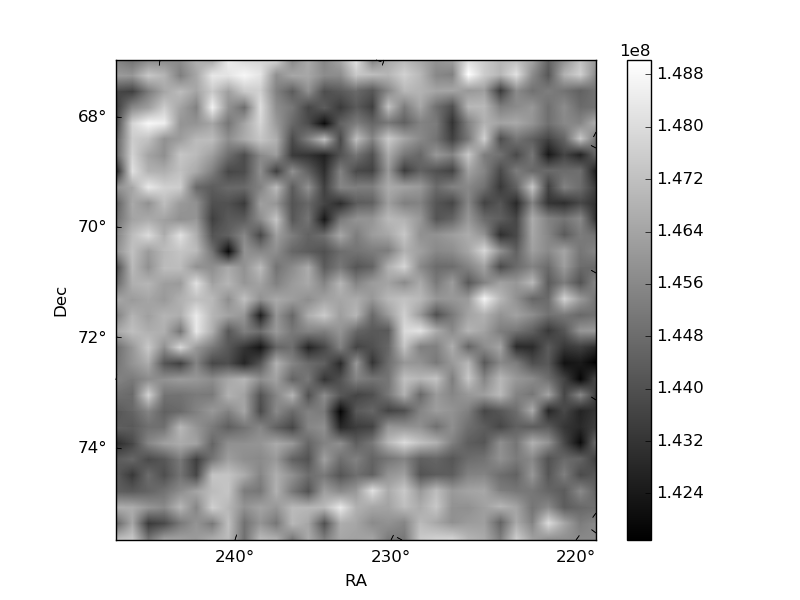
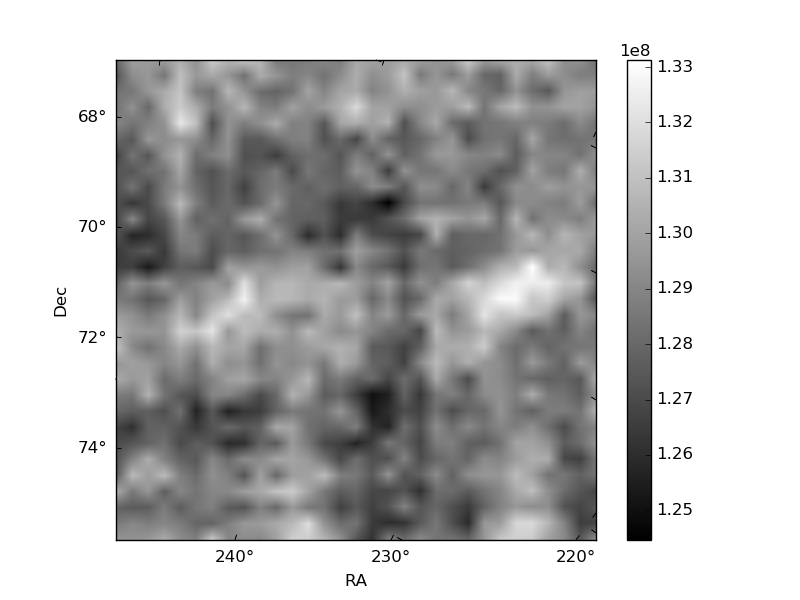
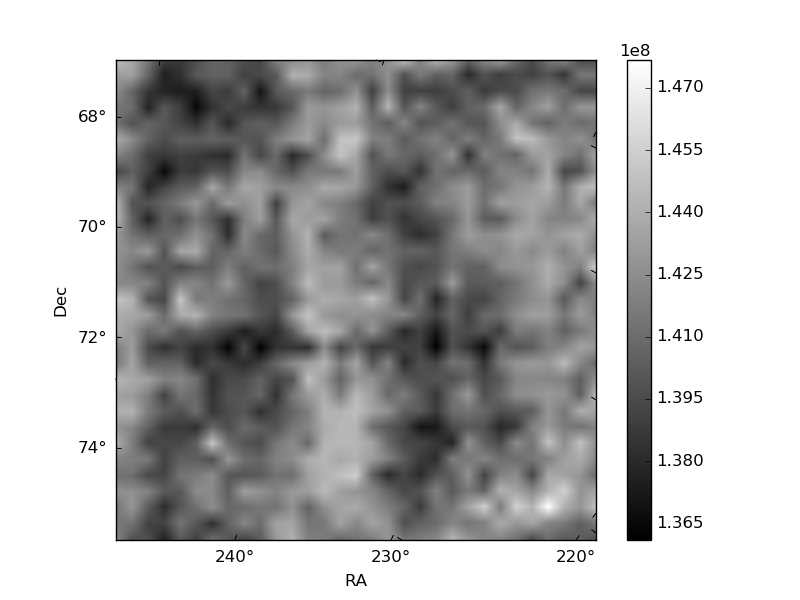
Histogram calculated using DETX and DETY for each event in the final _common_clean file
| Quadrant A | 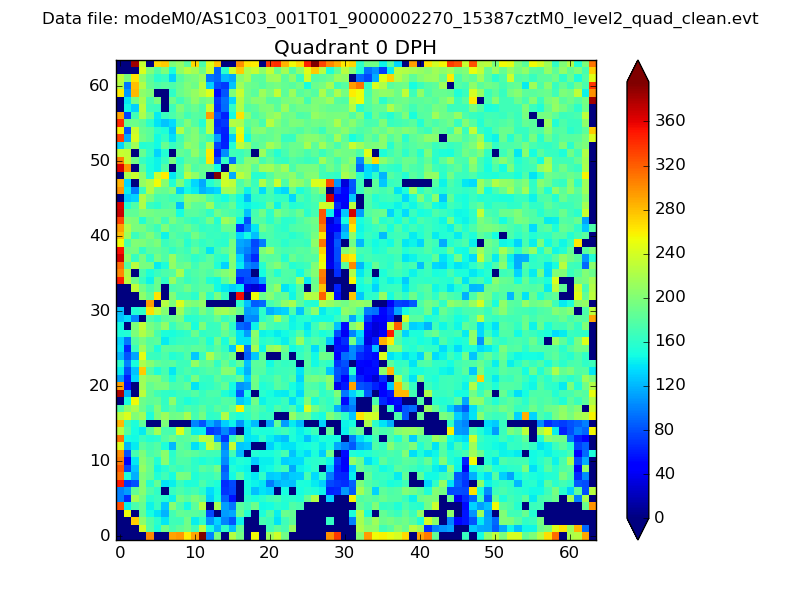 |
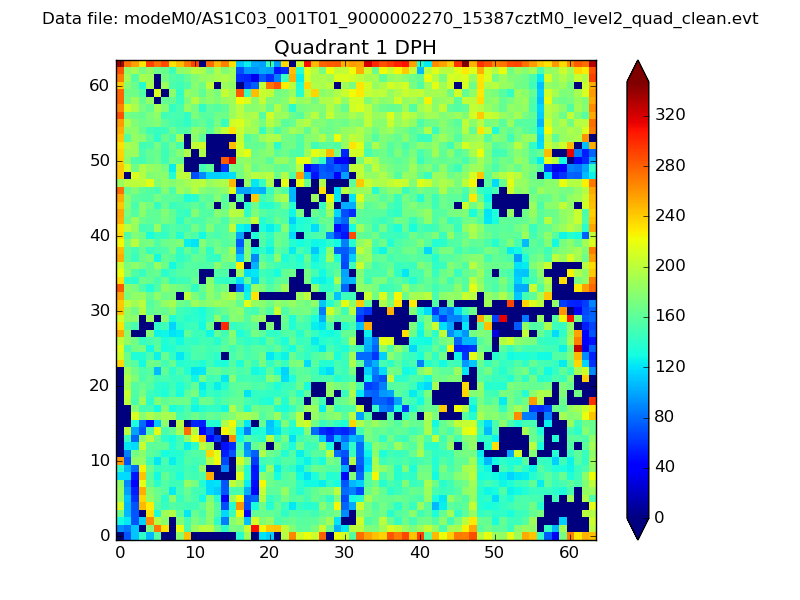 |
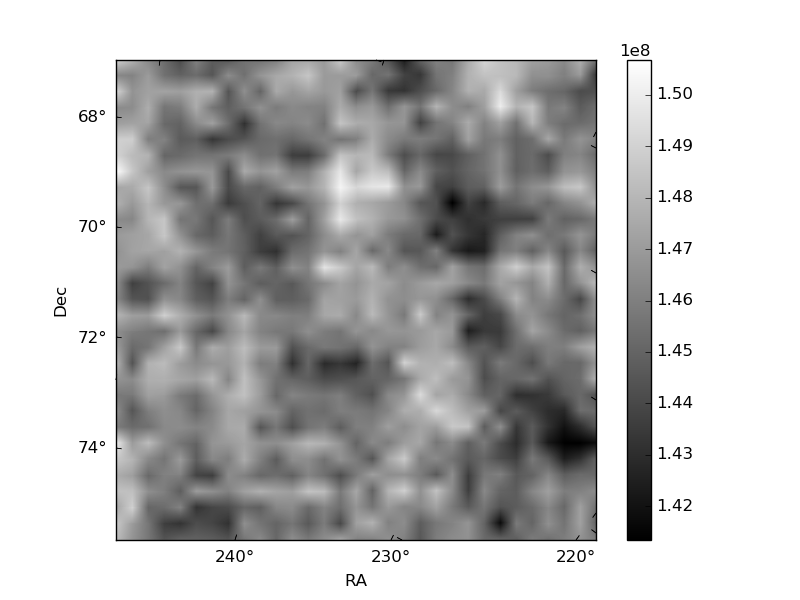
Quadrant B |
|---|---|---|---|
| Quadrant D | 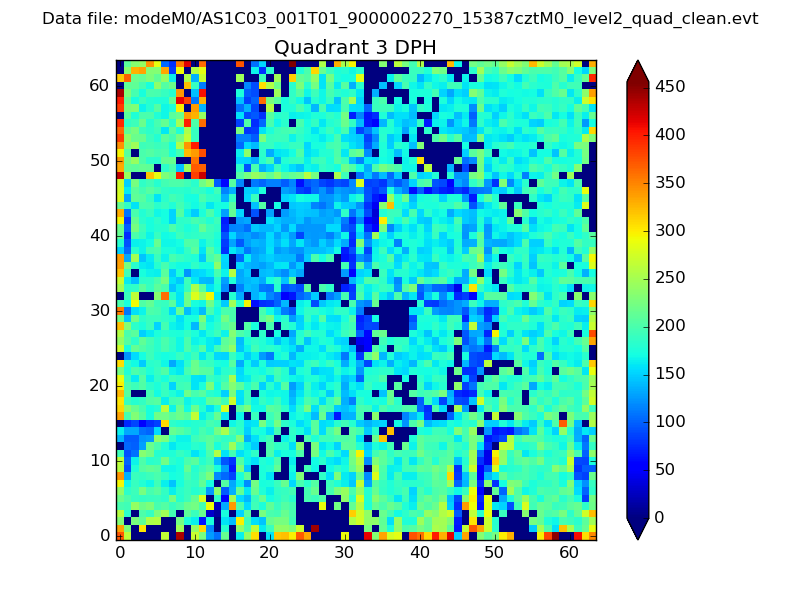 |
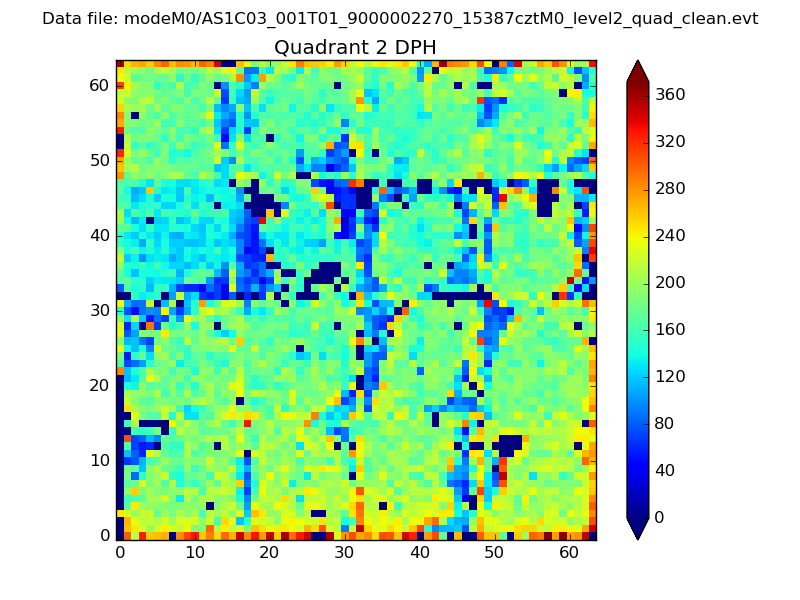 |
Quadrant C |
| Plot type | Count rate plots | Images |
|---|---|---|
| Comparison with Poisson distribution Blue bars denote a histogram of data divided into 1 sec bins. Red curve is a Poisson curve with rate = median count rate of data. |
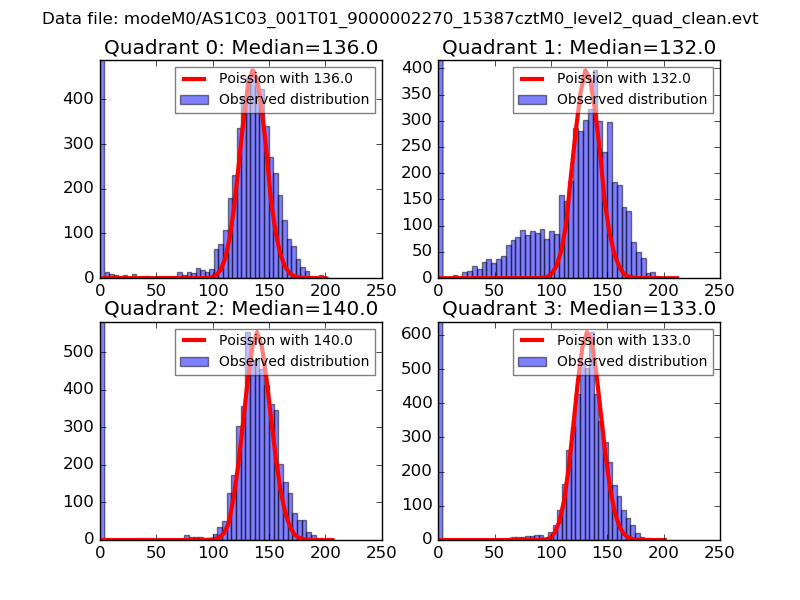 |
 |
| Quadrant-wise count rates Data is divided into 100 sec bins |
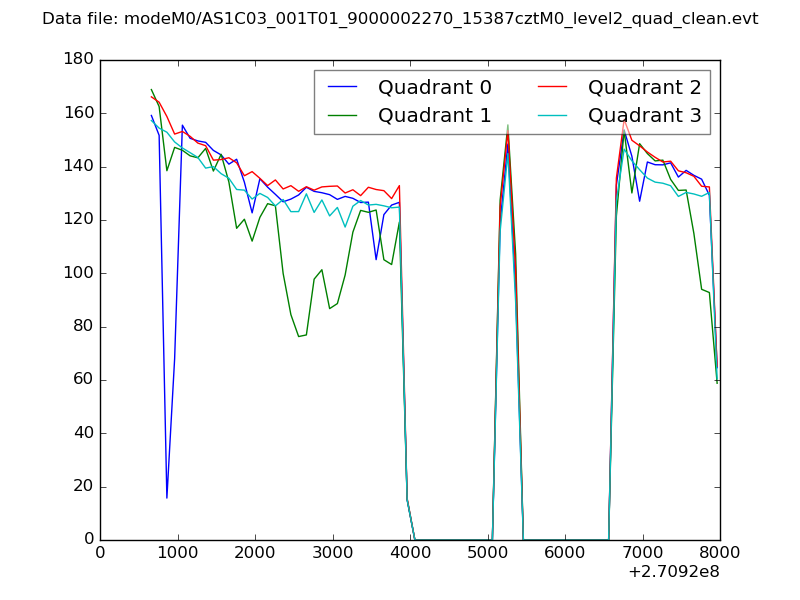 |
|
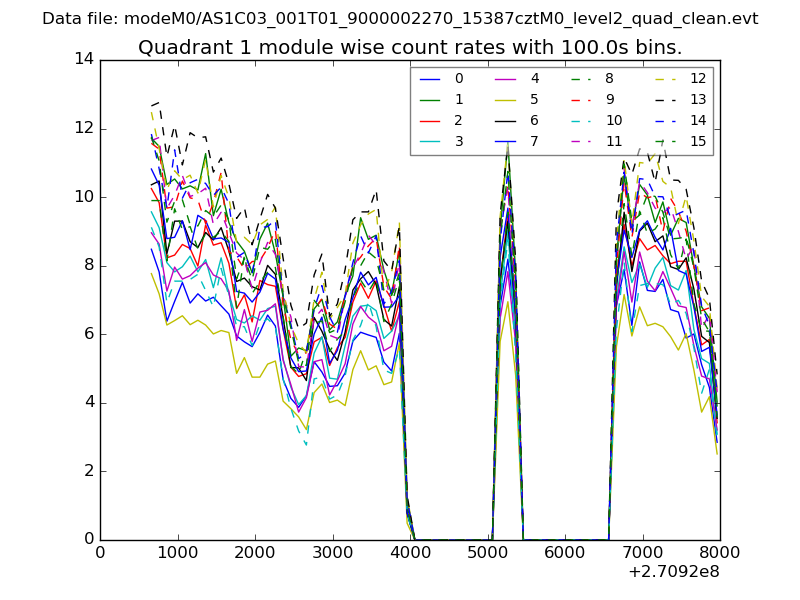
| Module-wise count rates for Quadrant A Data is divided into 100 sec bins |
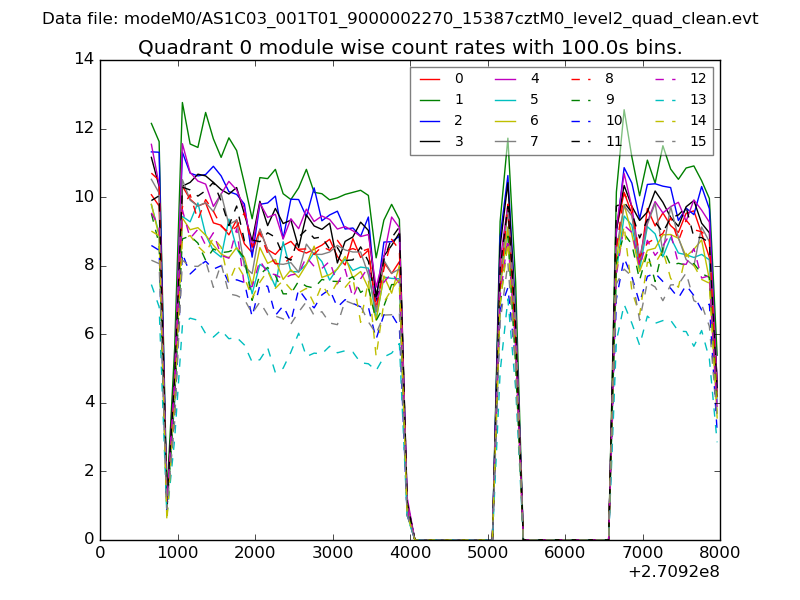 |
 |
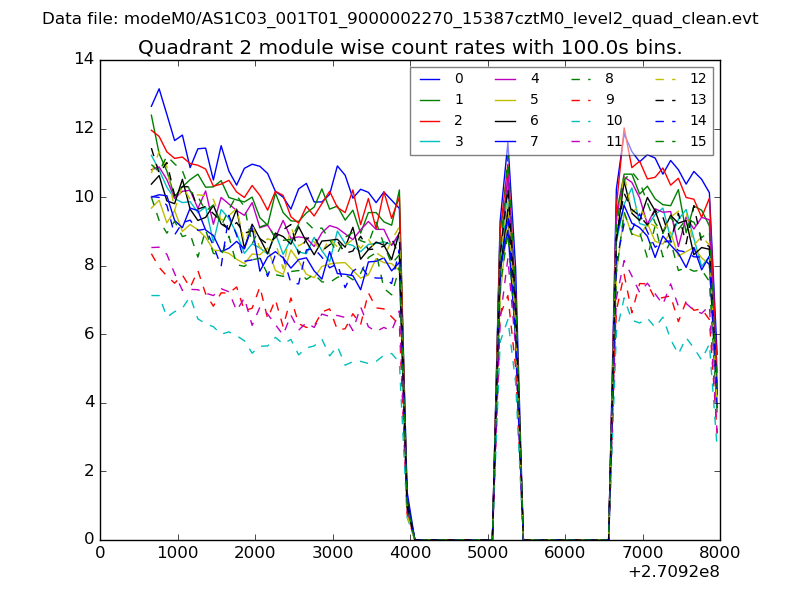
| Module-wise count rates for Quadrant B Data is divided into 100 sec bins |
 |
 |
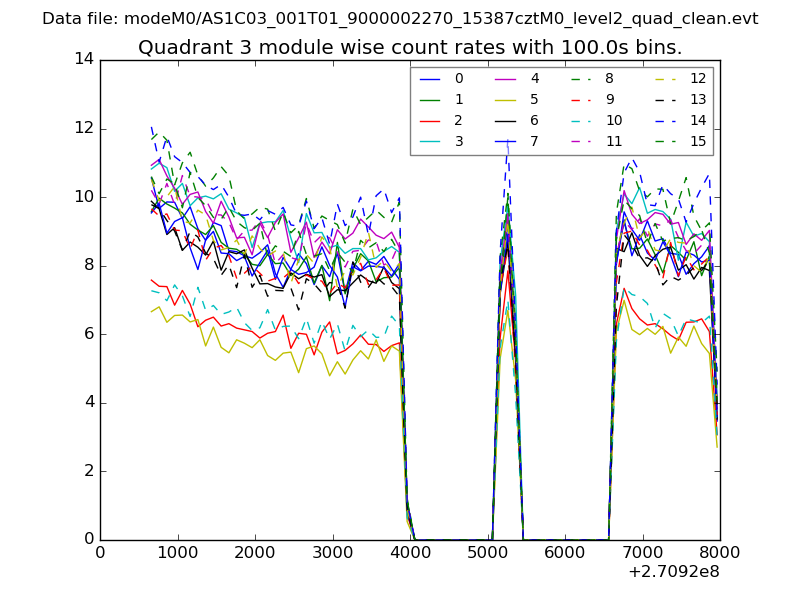
| Module-wise count rates for Quadrant C Data is divided into 100 sec bins |
 |
 |
| Module-wise count rates for Quadrant D Data is divided into 100 sec bins |
 |
 |
| Parameter | Plot |
|---|---|
| CZT HV Monitor | 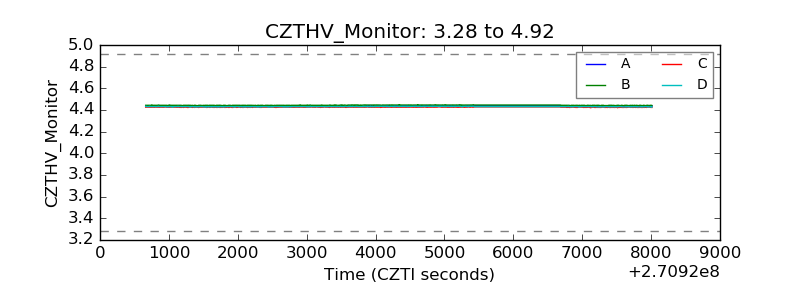 |
| D_VDD | 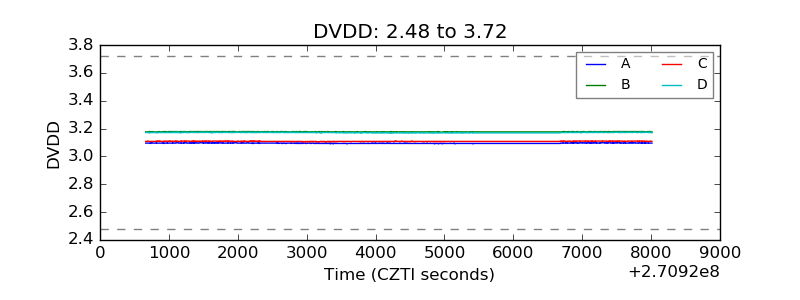 |
| Temperature 1 | 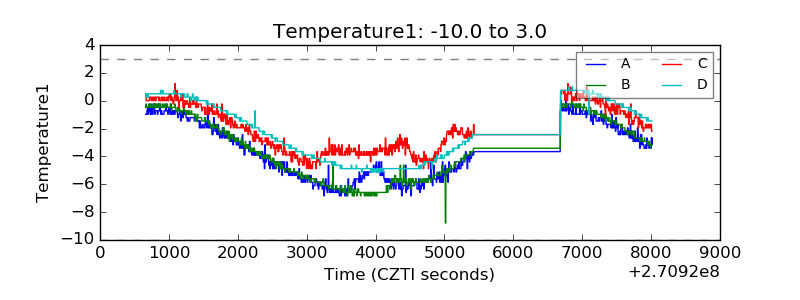 |
| Veto HV Monitor | 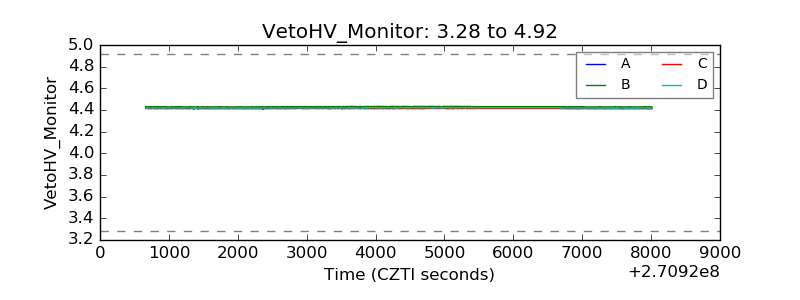 |
| Veto LLD | 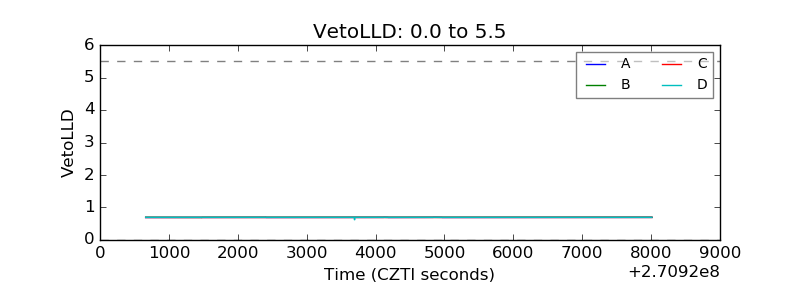 |
| Alpha Counter |  |
| _CPM_Rate | 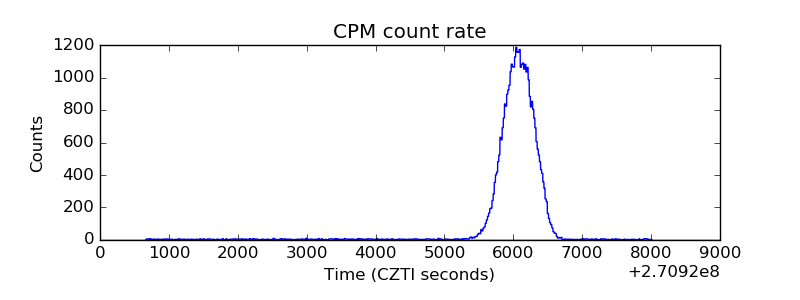 |
| CZT Counter | 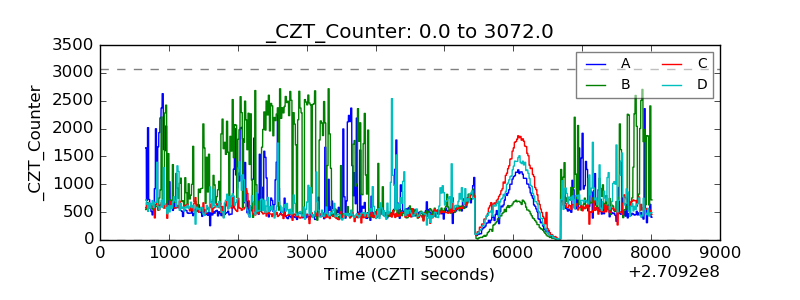 |
| +2.5 Volts monitor |  |
| +5 Volts monitor |  |
| _ROLL_ROT | 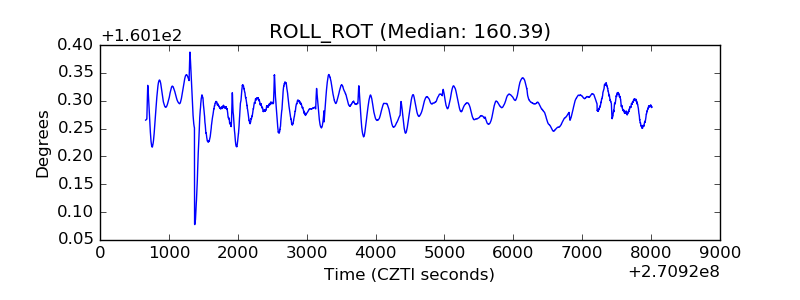 |
| _Roll_DEC | 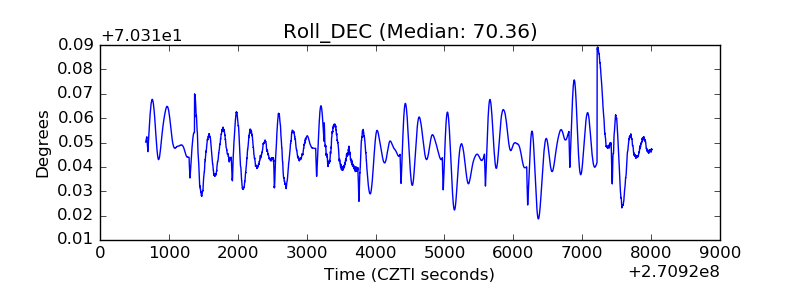 |
| _Roll_RA | 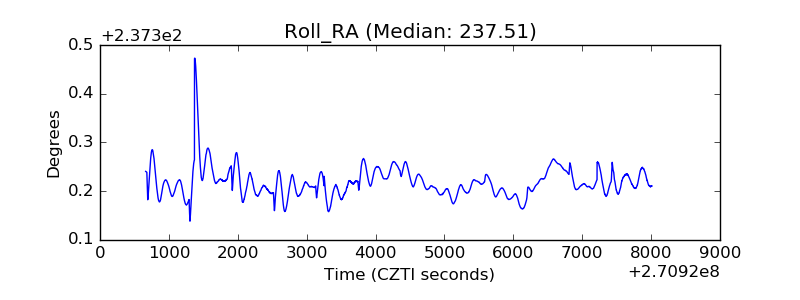 |
| Veto Counter | 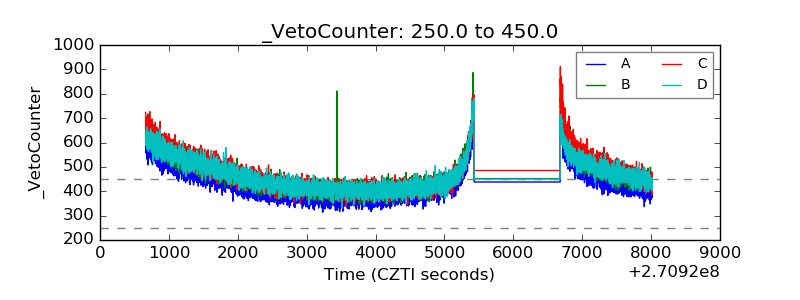 |