| Param | Original file | Final file |
|---|---|---|
| Filename | modeM0/AS1C03_001T01_9000002270_15389cztM0_level2.evt | modeM0/AS1C03_001T01_9000002270_15389cztM0_level2_quad_clean.evt |
| Size (bytes) | 750,568,320 | 101,692,800 |
| Size | 715.8 MB | 97.0 MB |
| Events in quadrant A | 3,833,608 | 693,648 |
| Events in quadrant B | 5,997,536 | 647,945 |
| Events in quadrant C | 3,193,137 | 702,285 |
| Events in quadrant D | 9,250,110 | 563,367 |
| Mode SS | |||
|---|---|---|---|
| Quadrant | BADHDUFLAG | Total packets | Discarded packets |
| A | 0 | 138 | 0 |
| B | 0 | 138 | 0 |
| C | 0 | 138 | 0 |
| D | 0 | 138 | 0 |
| Mode M0 | |||
|---|---|---|---|
| Quadrant | BADHDUFLAG | Total packets | Discarded packets |
| A | 0 | 15970 | 2 |
| B | 0 | 22473 | 1 |
| C | 0 | 13892 | 1 |
| D | 0 | 32219 | 1 |
| Mode M9 | |||
|---|---|---|---|
| Quadrant | BADHDUFLAG | Total packets | Discarded packets |
| A | 0 | 7 | 0 |
| B | 0 | 7 | 0 |
| C | 0 | 7 | 0 |
| D | 0 | 7 | 0 |
| Quadrant | Total seconds | Saturated seconds | Saturation percentage |
|---|---|---|---|
| A | 6754 | 158 | 2.339354% |
| B | 6754 | 895 | 13.251407% |
| C | 6754 | 31 | 0.458987% |
| D | 6754 | 2217 | 32.824993% |
Noise dominated data is calculated using 1-second bins in cleaned event files. If a bin has >2000 counts, and if more than 50% of those come from <1% of pixels, then it is considered to be noise-dominated and hence unusable.
| Quadrant | # 1 sec bins | Bins with >0 counts | Bins with >2000 counts | High rate bins dominated by noise | Noise dominated (total time) | Noise dominated (detector-on time) | Marked lightcurve |
|---|---|---|---|---|---|---|---|
| A | 7470 | 6755 | 97 | 97 | 1.30% | 1.44% | 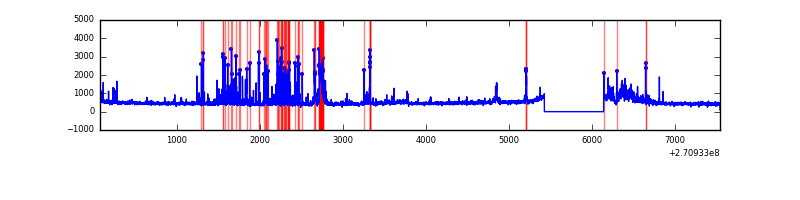 |
| B | 7470 | 6756 | 629 | 629 | 8.42% | 9.31% | 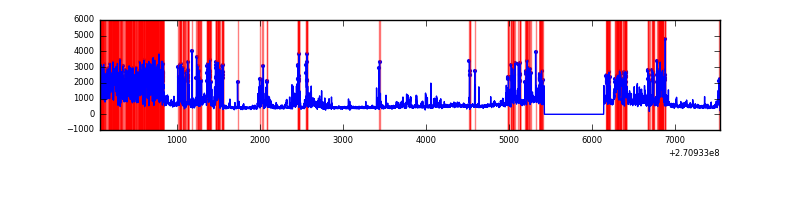 |
| C | 7470 | 6756 | 0 | 0 | 0.00% | 0.00% | 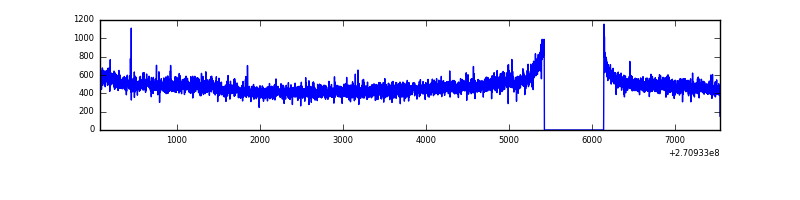 |
| D | 7469 | 6755 | 1760 | 1760 | 23.56% | 26.05% | 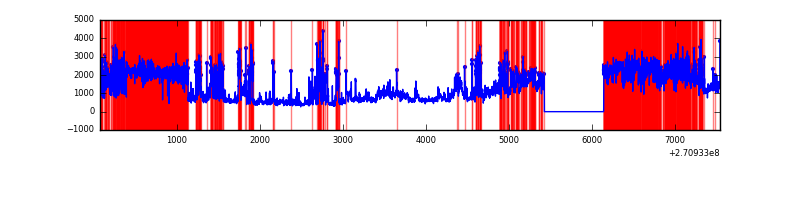 |
Top three noisy pixels from each quadrant. If the there are fewer than three noisy pixels in the level2.evt file, extra rows are filled as -1
| Pixel properties | Quadrant properties | ||||||
|---|---|---|---|---|---|---|---|
| Quadrant | DetID | PixID | Counts | Sigma | Mean | Median | Sigma |
| A | 14 | 238 | 555635 | 3509.94 | 773 | 754 | 158.1 |
| A | 14 | 237 | 216899 | 1367.24 | 773 | 754 | 158.1 |
| A | 9 | 143 | 48614 | 302.74 | 773 | 754 | 158.1 |
| B | 10 | 245 | 2312235 | 16382.86 | 742 | 722 | 141.1 |
| B | 8 | 3 | 215024 | 1518.87 | 742 | 722 | 141.1 |
| B | 10 | 16 | 107472 | 756.59 | 742 | 722 | 141.1 |
| C | 3 | 233 | 190503 | 1075.5 | 768 | 772 | 176.4 |
| C | 13 | 61 | 5709 | 27.99 | 768 | 772 | 176.4 |
| C | 7 | 247 | 2633 | 10.55 | 768 | 772 | 176.4 |
| D | 13 | 122 | 3937720 | 23649.88 | 679 | 657 | 166.5 |
| D | 9 | 68 | 1794718 | 10776.9 | 679 | 657 | 166.5 |
| D | 2 | 33 | 302857 | 1815.31 | 679 | 657 | 166.5 |
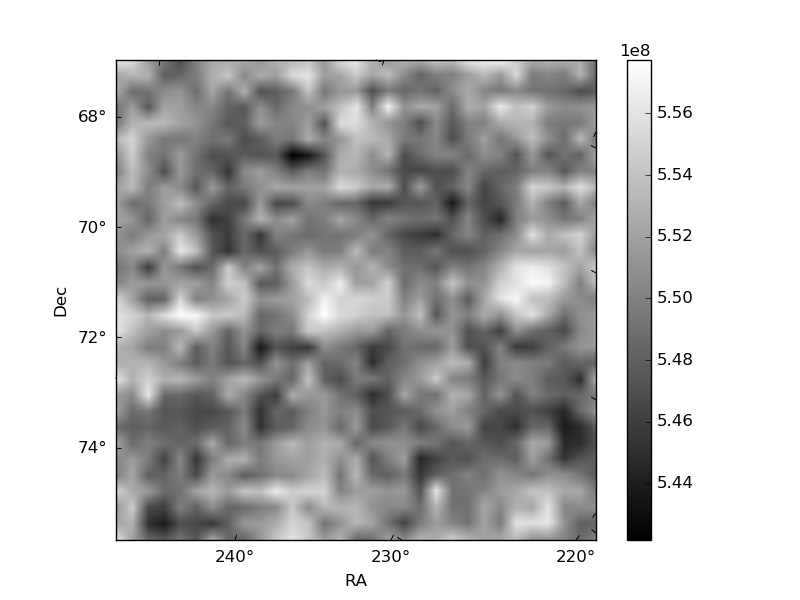
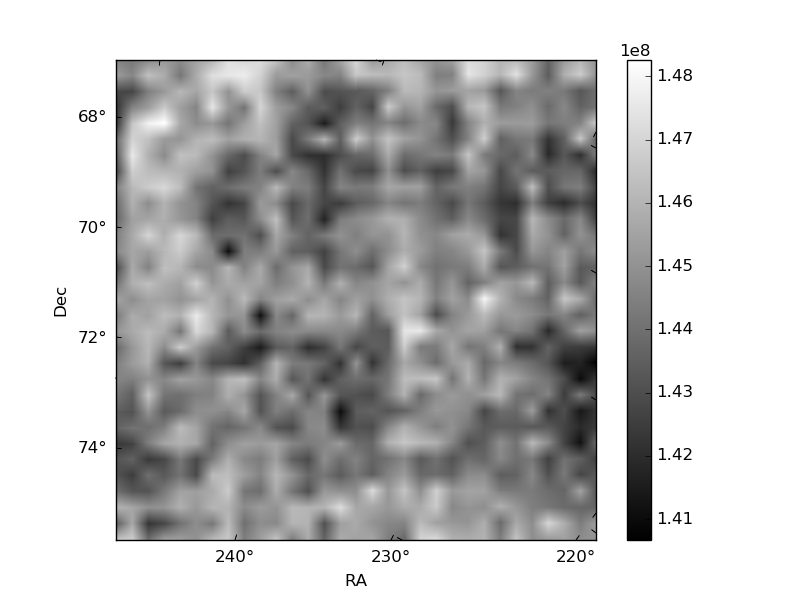
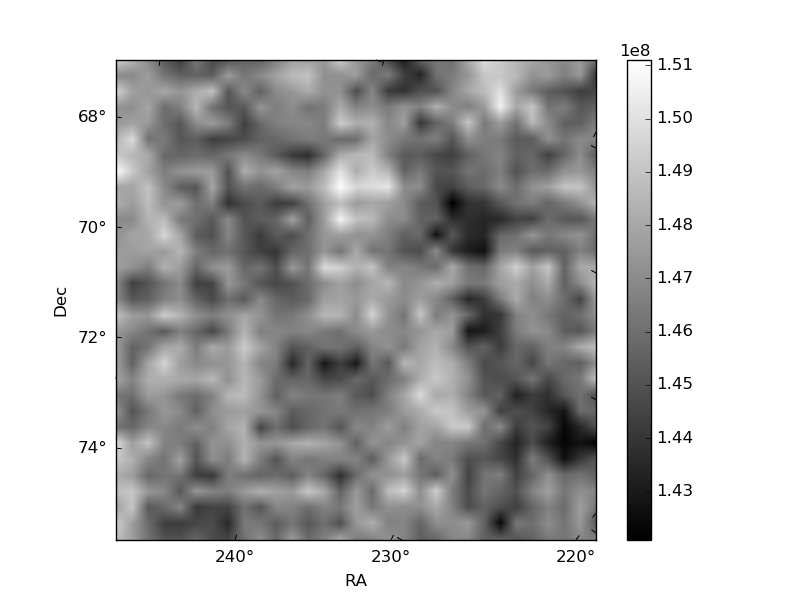
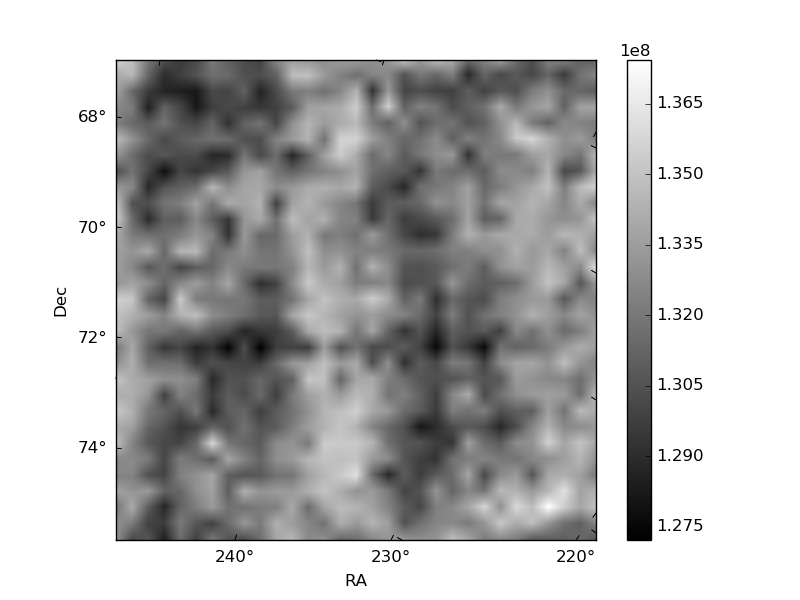
Histogram calculated using DETX and DETY for each event in the final _common_clean file
| Quadrant A | 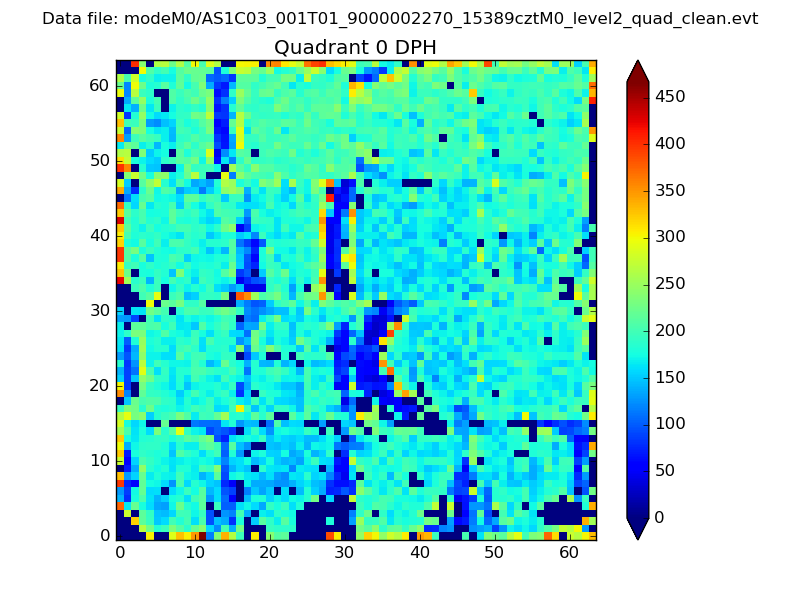 |
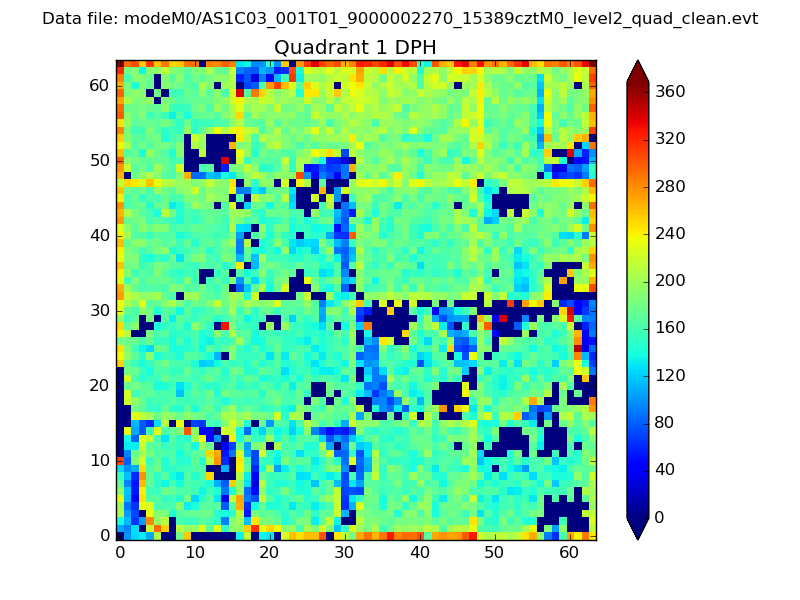 |
Quadrant B |
|---|---|---|---|
| Quadrant D | 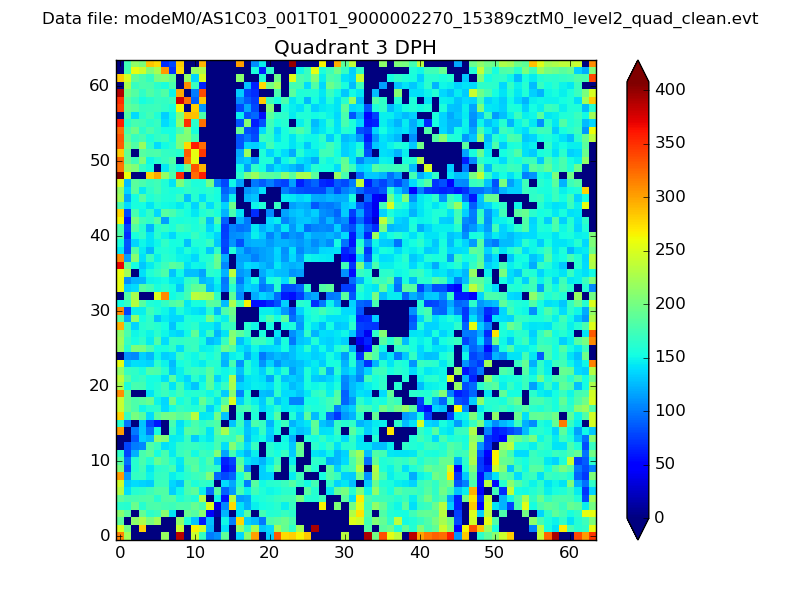 |
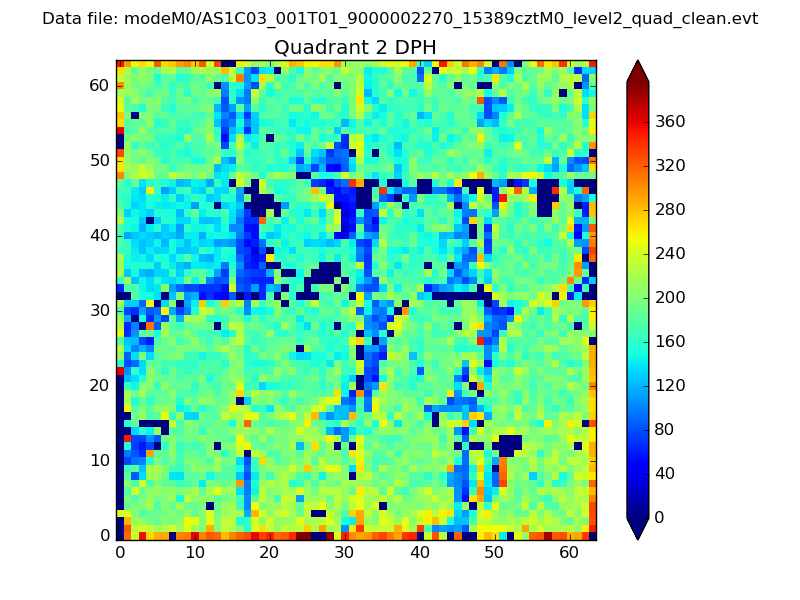 |
Quadrant C |
| Plot type | Count rate plots | Images |
|---|---|---|
| Comparison with Poisson distribution Blue bars denote a histogram of data divided into 1 sec bins. Red curve is a Poisson curve with rate = median count rate of data. |
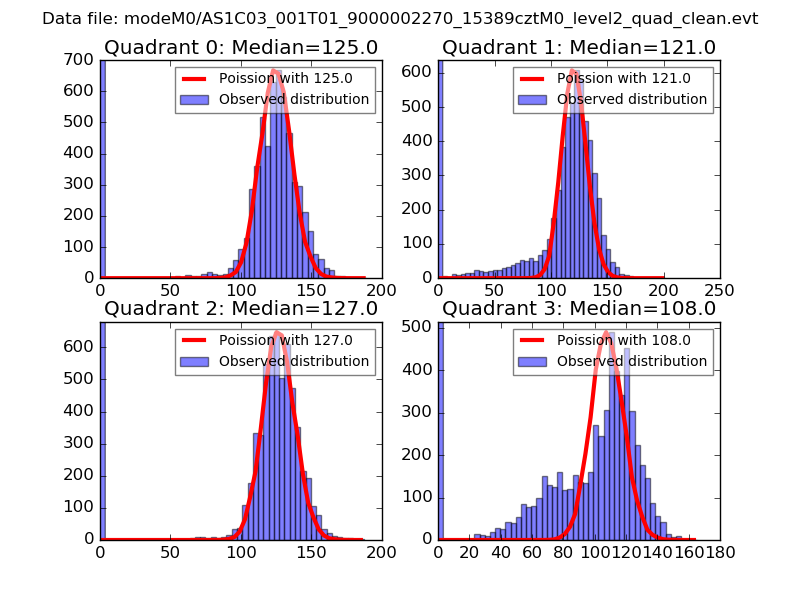 |
 |
| Quadrant-wise count rates Data is divided into 100 sec bins |
 |
|
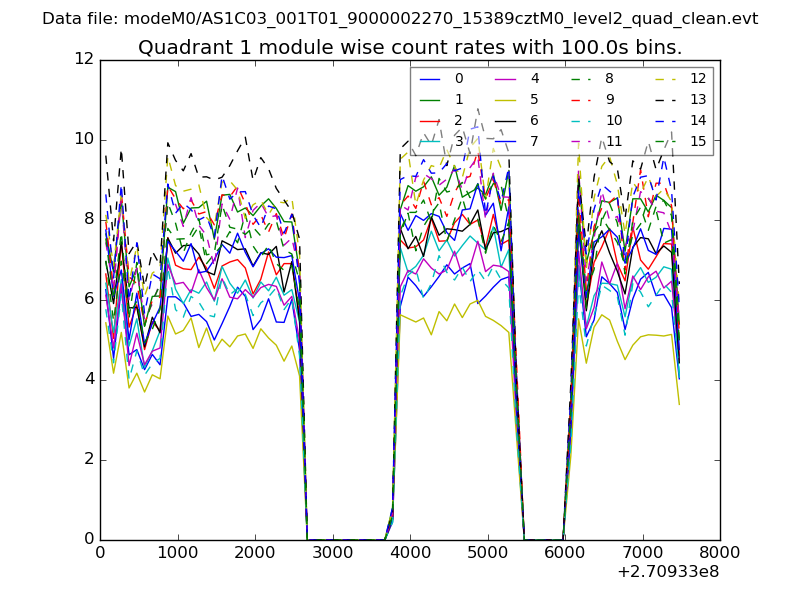
| Module-wise count rates for Quadrant A Data is divided into 100 sec bins |
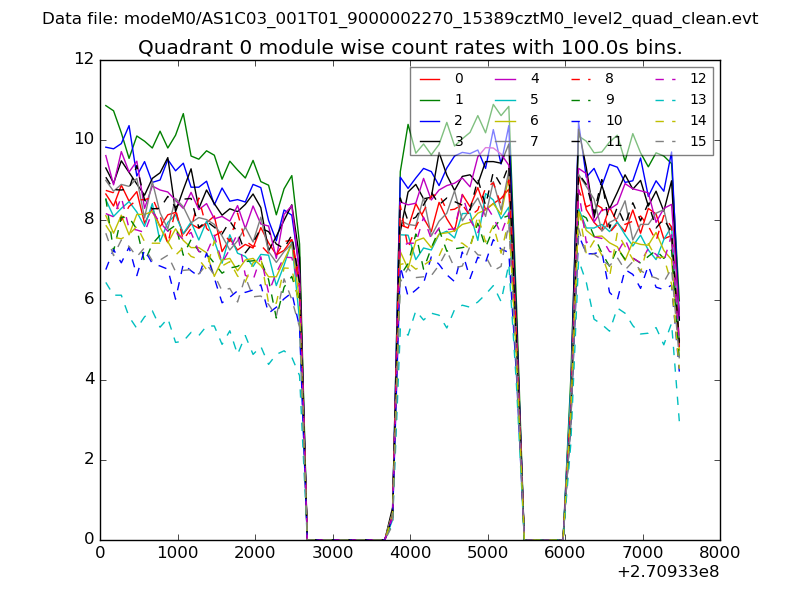 |
 |
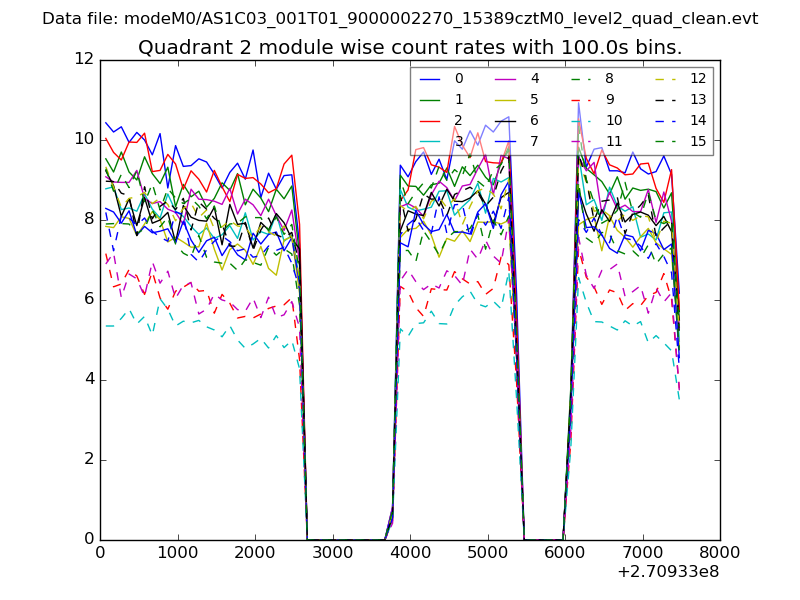
| Module-wise count rates for Quadrant B Data is divided into 100 sec bins |
 |
 |
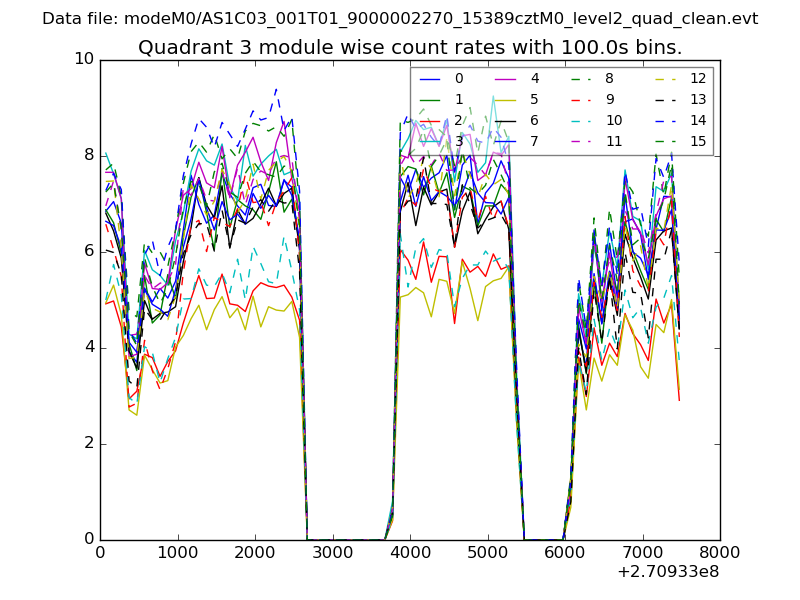
| Module-wise count rates for Quadrant C Data is divided into 100 sec bins |
 |
 |
| Module-wise count rates for Quadrant D Data is divided into 100 sec bins |
 |
 |
| Parameter | Plot |
|---|---|
| CZT HV Monitor | 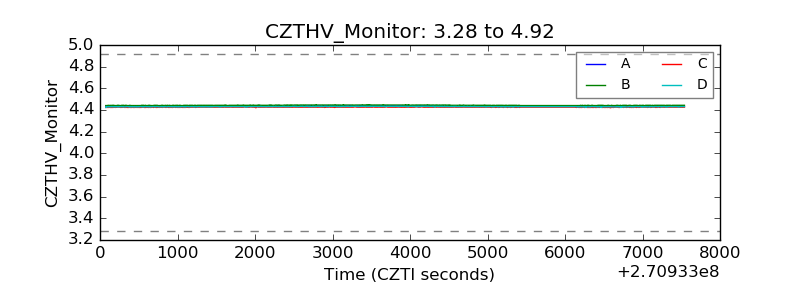 |
| D_VDD | 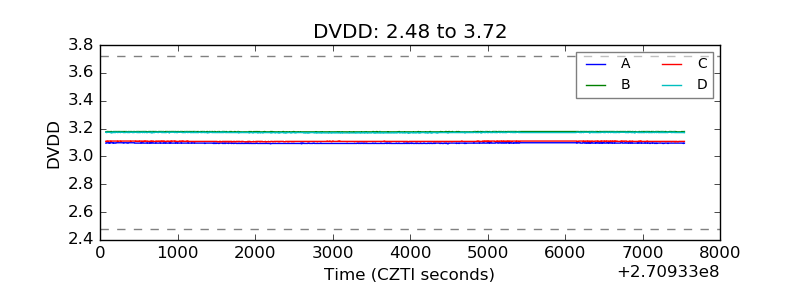 |
| Temperature 1 | 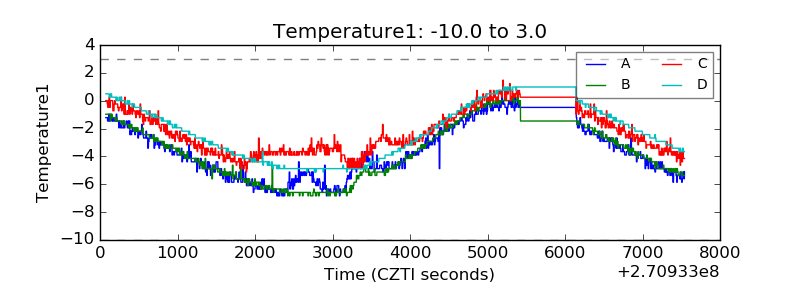 |
| Veto HV Monitor | 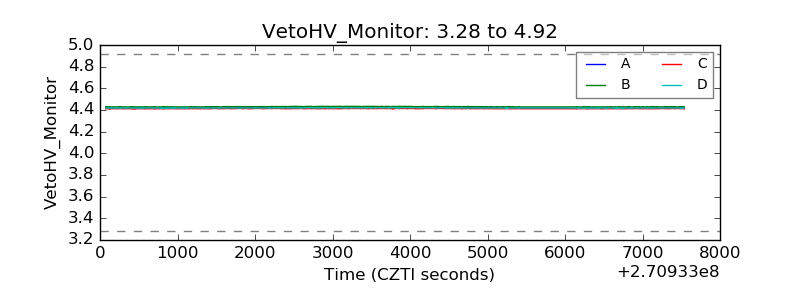 |
| Veto LLD | 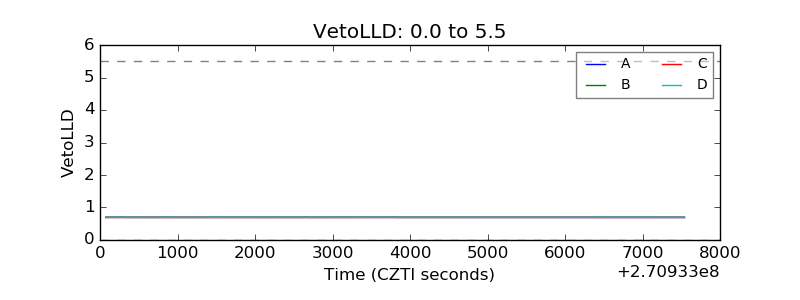 |
| Alpha Counter |  |
| _CPM_Rate | 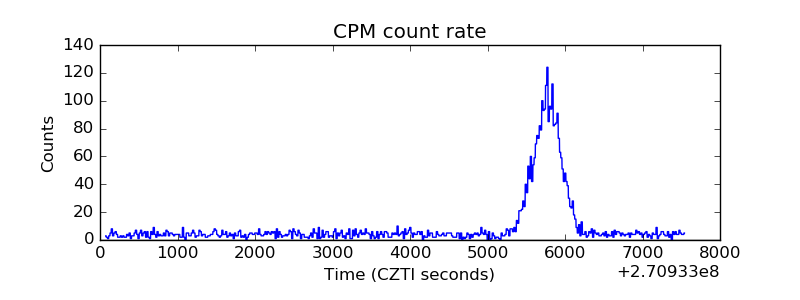 |
| CZT Counter | 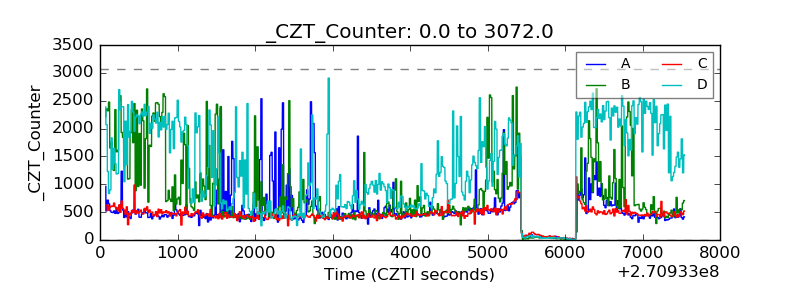 |
| +2.5 Volts monitor |  |
| +5 Volts monitor |  |
| _ROLL_ROT | 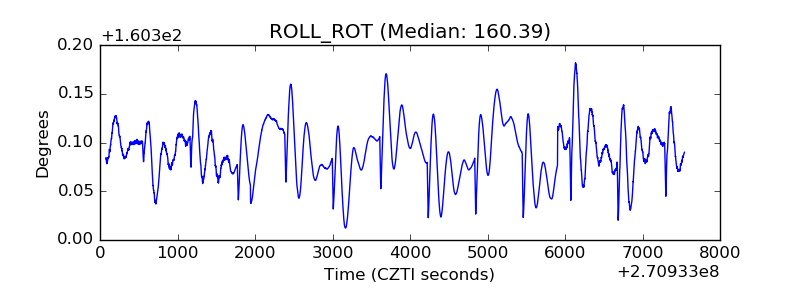 |
| _Roll_DEC | 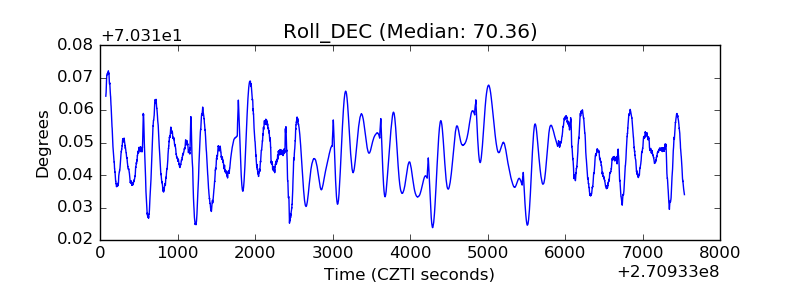 |
| _Roll_RA | 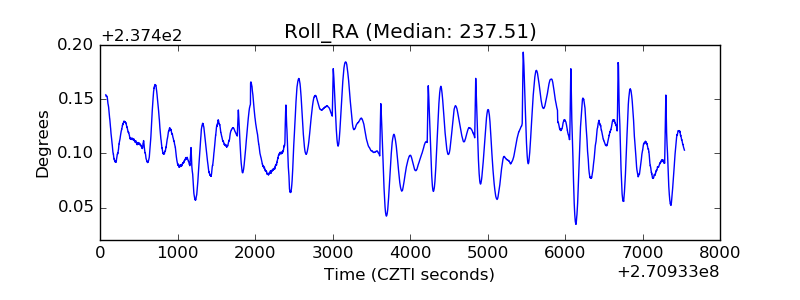 |
| Veto Counter | 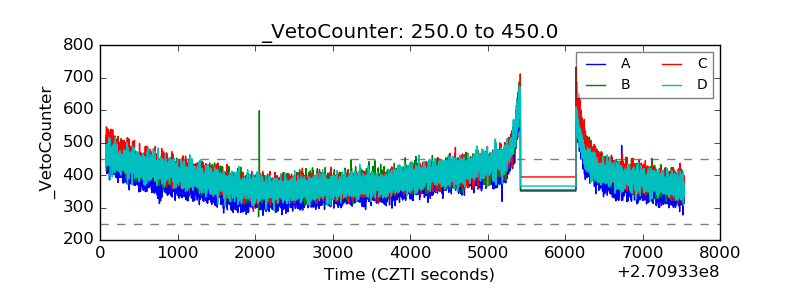 |