| Param | Original file | Final file |
|---|---|---|
| Filename | modeM0/AS1C03_001T01_9000002270_15390cztM0_level2.evt | modeM0/AS1C03_001T01_9000002270_15390cztM0_level2_quad_clean.evt |
| Size (bytes) | 894,447,360 | 105,534,720 |
| Size | 853.0 MB | 100.6 MB |
| Events in quadrant A | 3,655,719 | 737,946 |
| Events in quadrant B | 5,862,383 | 691,638 |
| Events in quadrant C | 3,423,956 | 746,078 |
| Events in quadrant D | 13,660,720 | 517,144 |
| Mode SS | |||
|---|---|---|---|
| Quadrant | BADHDUFLAG | Total packets | Discarded packets |
| A | 0 | 144 | 0 |
| B | 0 | 144 | 0 |
| C | 0 | 144 | 0 |
| D | 0 | 144 | 0 |
| Mode M0 | |||
|---|---|---|---|
| Quadrant | BADHDUFLAG | Total packets | Discarded packets |
| A | 0 | 15972 | 3 |
| B | 0 | 22451 | 2 |
| C | 0 | 14979 | 2 |
| D | 0 | 45567 | 2 |
| Mode M9 | |||
|---|---|---|---|
| Quadrant | BADHDUFLAG | Total packets | Discarded packets |
| A | 0 | 5 | 0 |
| B | 0 | 5 | 0 |
| C | 0 | 5 | 0 |
| D | 0 | 6 | 0 |
| Quadrant | Total seconds | Saturated seconds | Saturation percentage |
|---|---|---|---|
| A | 7208 | 60 | 0.832408% |
| B | 7208 | 816 | 11.320755% |
| C | 7208 | 19 | 0.263596% |
| D | 7208 | 3738 | 51.859046% |
Noise dominated data is calculated using 1-second bins in cleaned event files. If a bin has >2000 counts, and if more than 50% of those come from <1% of pixels, then it is considered to be noise-dominated and hence unusable.
| Quadrant | # 1 sec bins | Bins with >0 counts | Bins with >2000 counts | High rate bins dominated by noise | Noise dominated (total time) | Noise dominated (detector-on time) | Marked lightcurve |
|---|---|---|---|---|---|---|---|
| A | 7639 | 7210 | 25 | 25 | 0.33% | 0.35% | 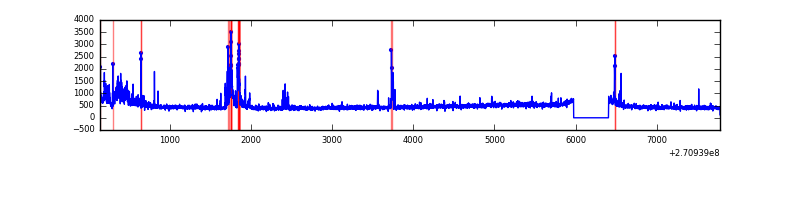 |
| B | 7639 | 7210 | 583 | 583 | 7.63% | 8.09% | 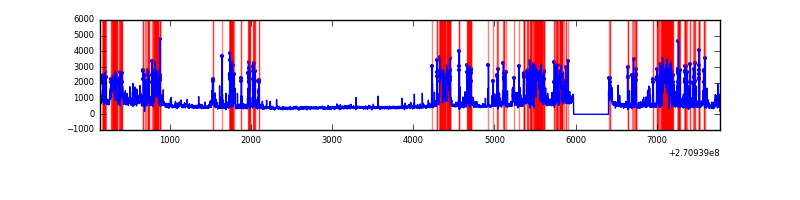 |
| C | 7639 | 7210 | 0 | 0 | 0.00% | 0.00% | 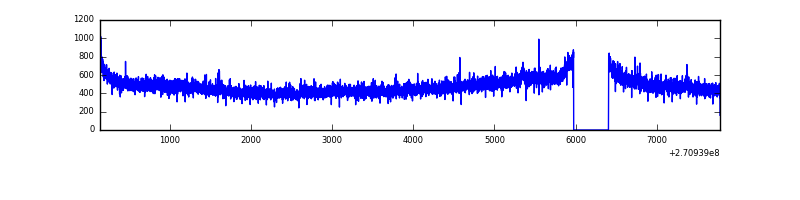 |
| D | 7639 | 7210 | 3410 | 3410 | 44.64% | 47.30% | 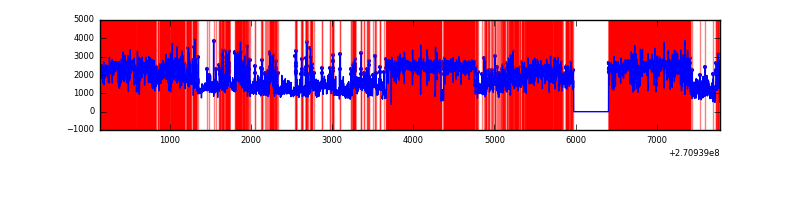 |
Top three noisy pixels from each quadrant. If the there are fewer than three noisy pixels in the level2.evt file, extra rows are filled as -1
| Pixel properties | Quadrant properties | ||||||
|---|---|---|---|---|---|---|---|
| Quadrant | DetID | PixID | Counts | Sigma | Mean | Median | Sigma |
| A | 14 | 238 | 374277 | 2208.68 | 827 | 810 | 169.1 |
| A | 9 | 143 | 47376 | 275.39 | 827 | 810 | 169.1 |
| A | 14 | 237 | 27213 | 156.15 | 827 | 810 | 169.1 |
| B | 10 | 245 | 2169085 | 14527.41 | 792 | 773 | 149.3 |
| B | 7 | 220 | 143279 | 954.77 | 792 | 773 | 149.3 |
| B | 8 | 3 | 130459 | 868.88 | 792 | 773 | 149.3 |
| C | 3 | 233 | 211804 | 1117.34 | 818 | 820 | 188.8 |
| C | 7 | 247 | 14700 | 73.51 | 818 | 820 | 188.8 |
| C | 7 | 238 | 7847 | 37.21 | 818 | 820 | 188.8 |
| D | 13 | 122 | 9160253 | 55437.55 | 659 | 637 | 165.2 |
| D | 9 | 68 | 733947 | 4438.28 | 659 | 637 | 165.2 |
| D | 5 | 222 | 466583 | 2820.09 | 659 | 637 | 165.2 |
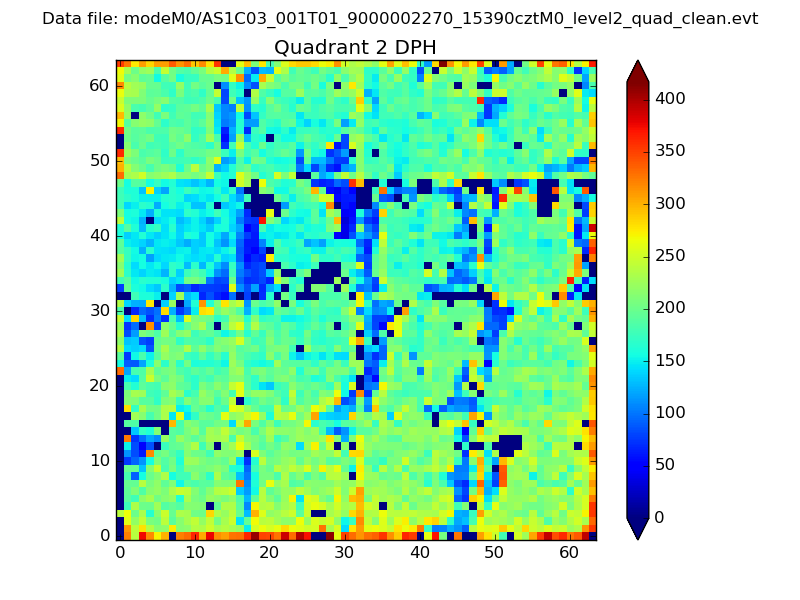
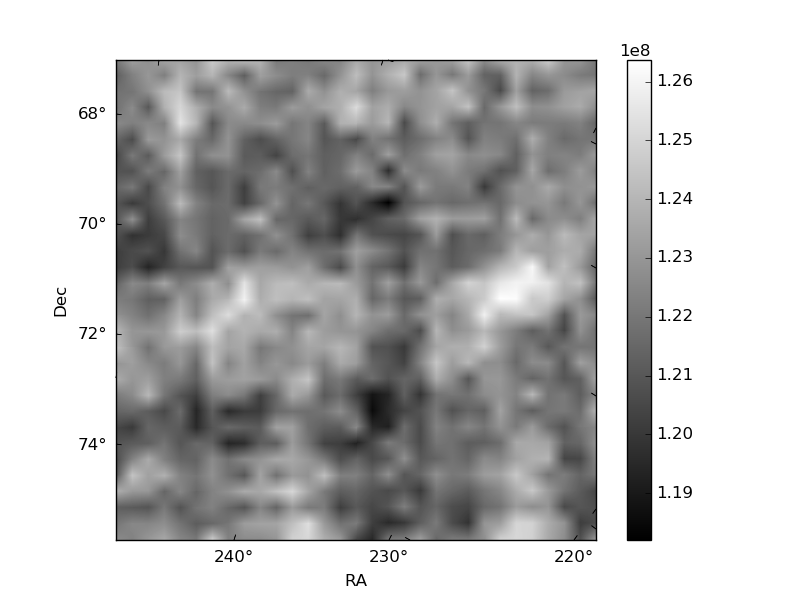
Histogram calculated using DETX and DETY for each event in the final _common_clean file
| Quadrant A | 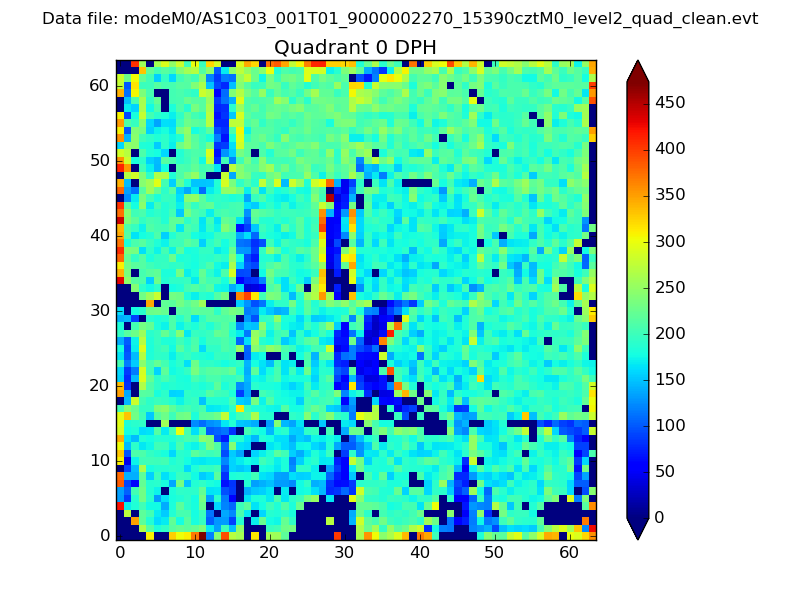 |
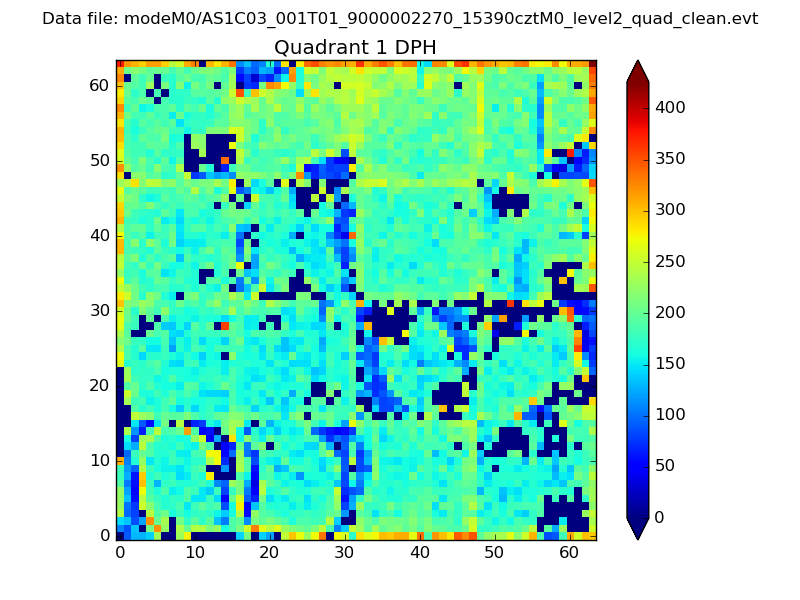 |
Quadrant B |
|---|---|---|---|
| Quadrant D | 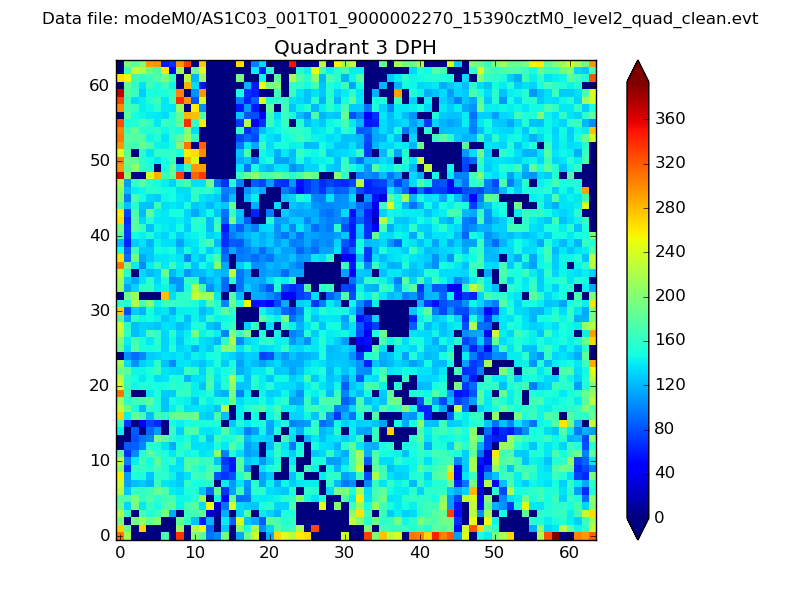 |
 |
Quadrant C |
| Plot type | Count rate plots | Images |
|---|---|---|
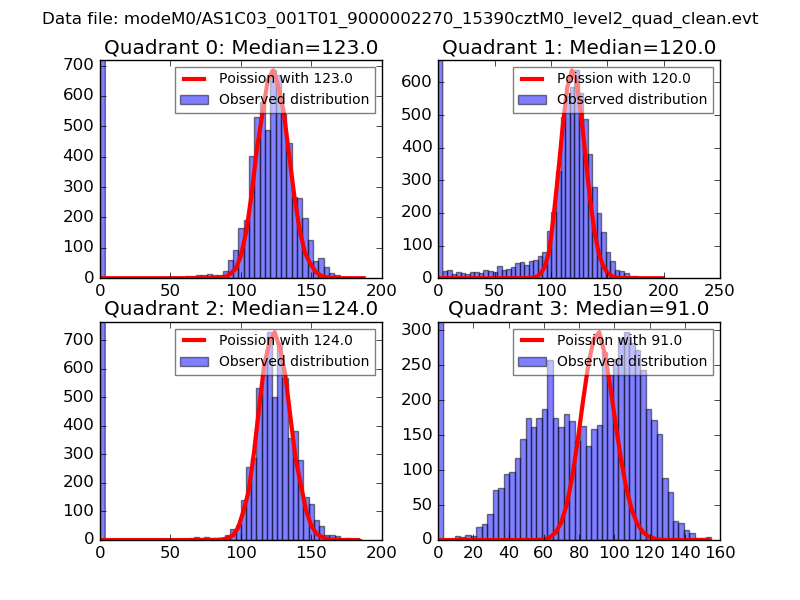
| Comparison with Poisson distribution Blue bars denote a histogram of data divided into 1 sec bins. Red curve is a Poisson curve with rate = median count rate of data. |
 |
 |
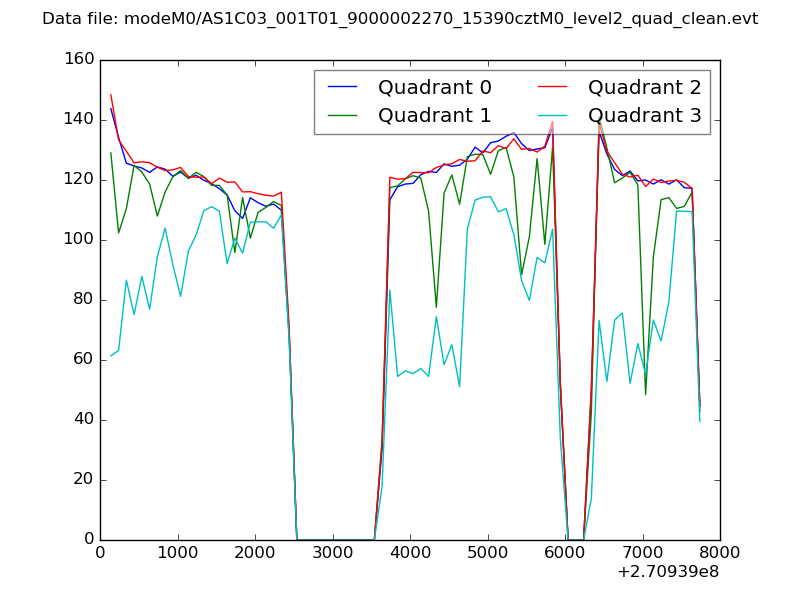
| Quadrant-wise count rates Data is divided into 100 sec bins |
 |
|
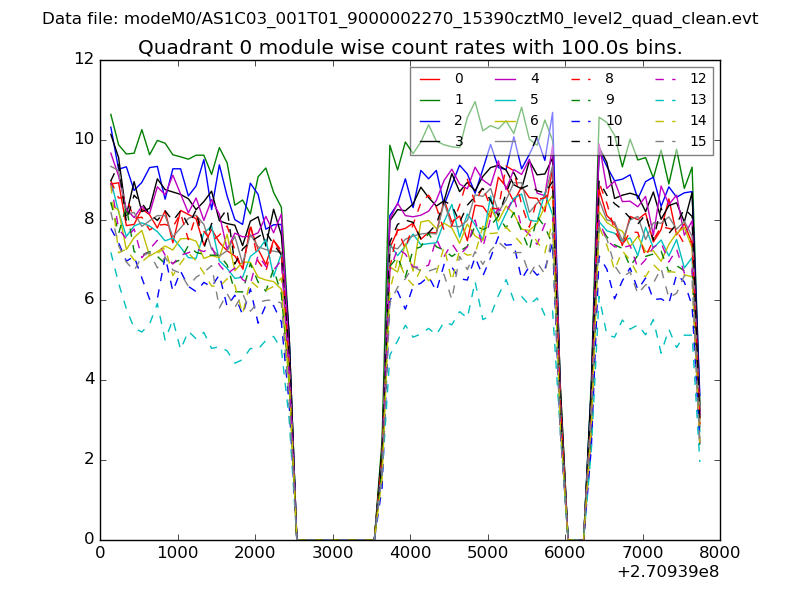
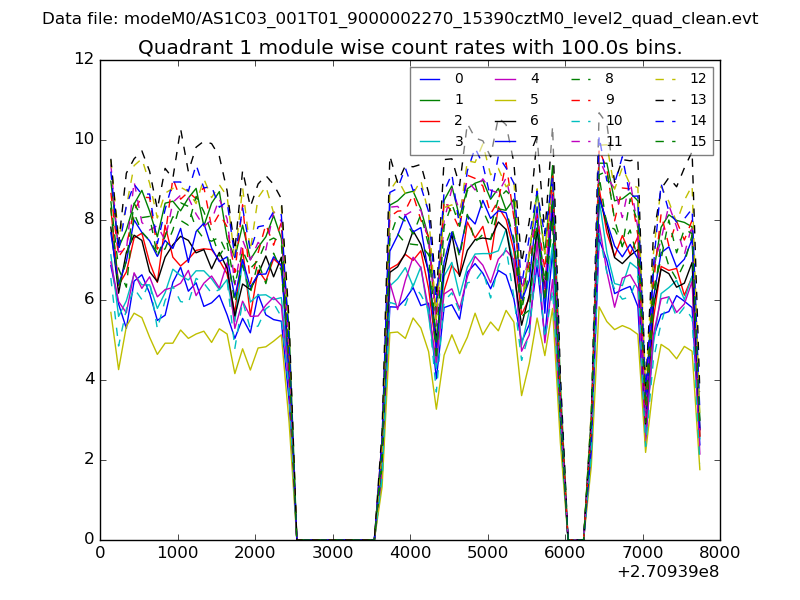
| Module-wise count rates for Quadrant A Data is divided into 100 sec bins |
 |
 |
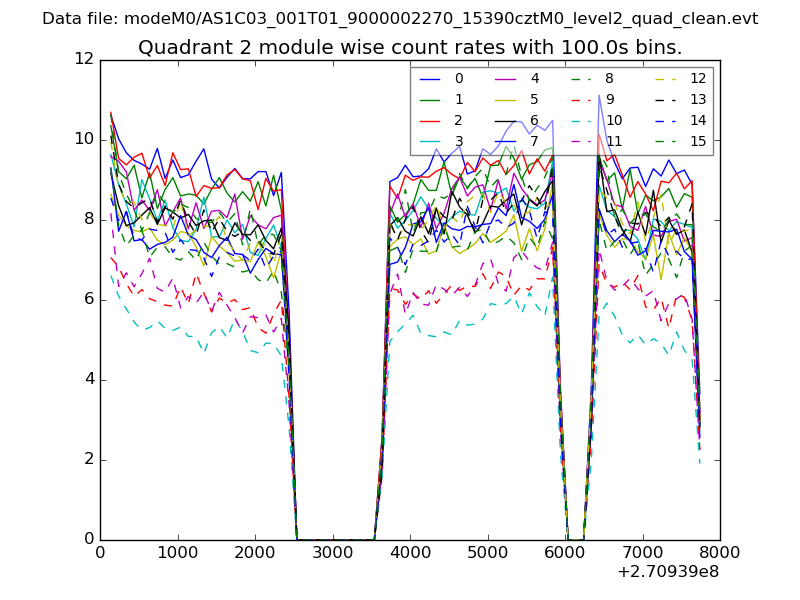
| Module-wise count rates for Quadrant B Data is divided into 100 sec bins |
 |
 |
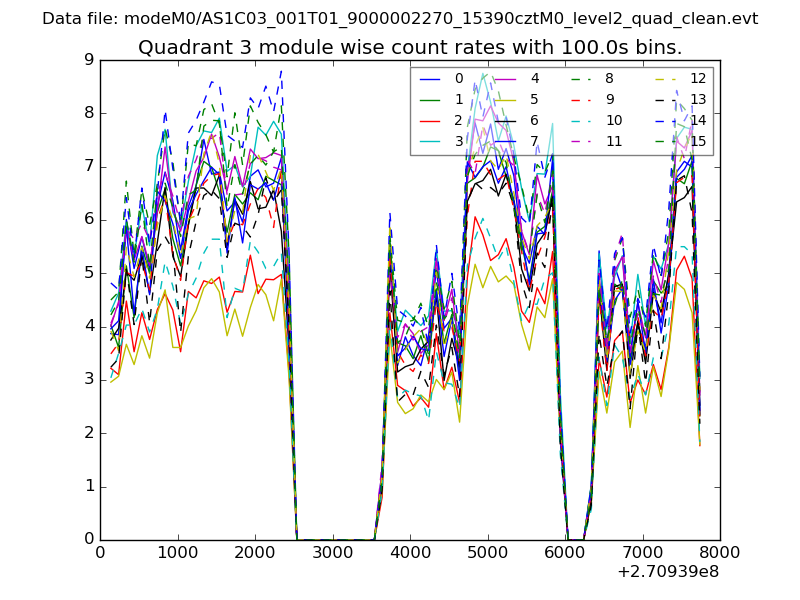
| Module-wise count rates for Quadrant C Data is divided into 100 sec bins |
 |
 |
| Module-wise count rates for Quadrant D Data is divided into 100 sec bins |
 |
 |
| Parameter | Plot |
|---|---|
| CZT HV Monitor | 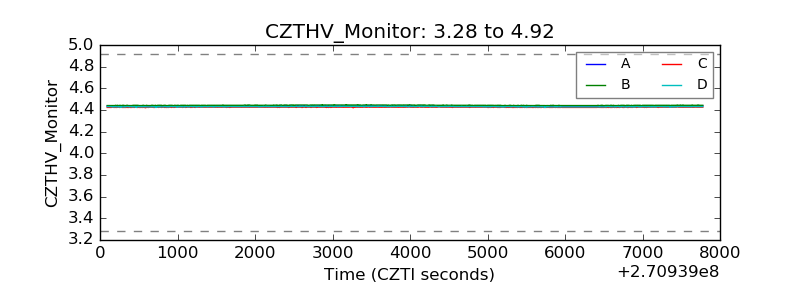 |
| D_VDD | 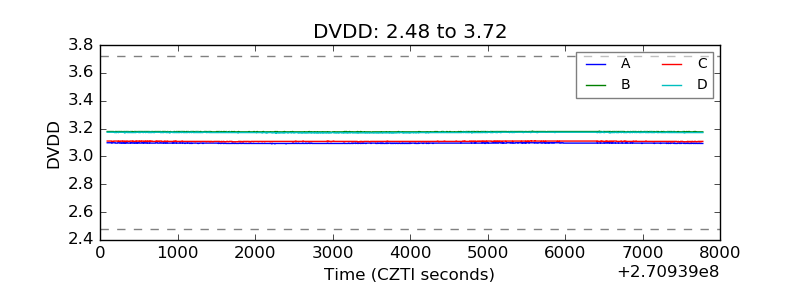 |
| Temperature 1 | 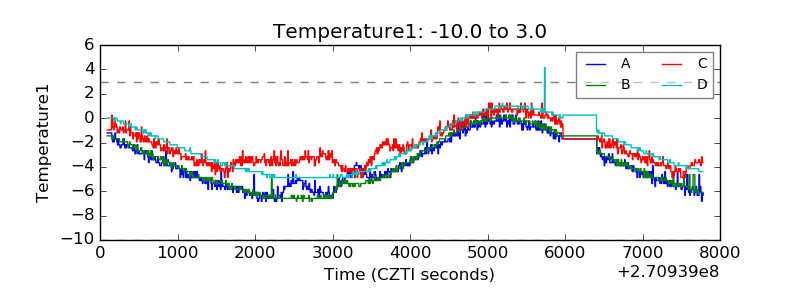 |
| Veto HV Monitor | 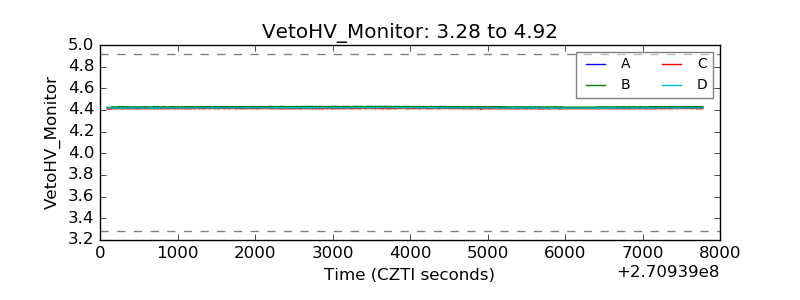 |
| Veto LLD | 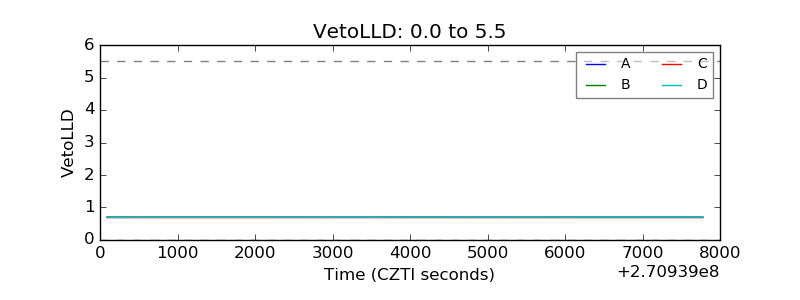 |
| Alpha Counter | 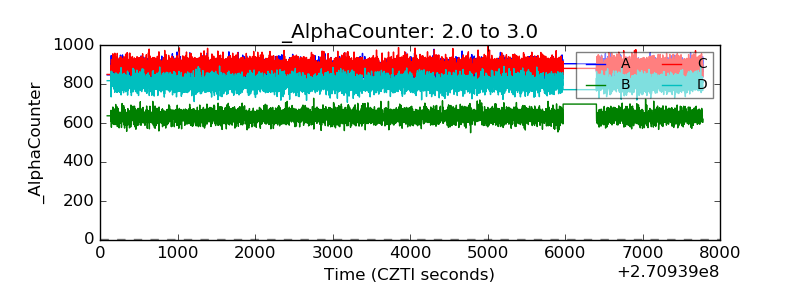 |
| _CPM_Rate | 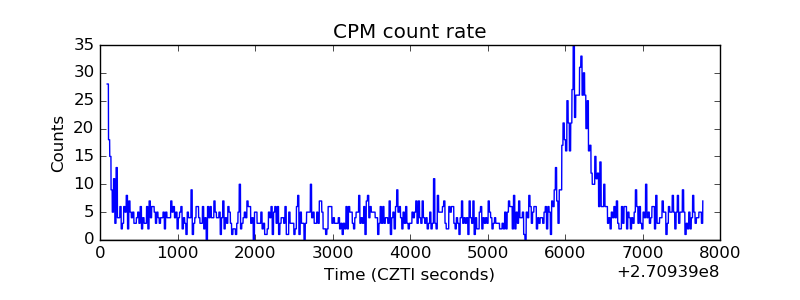 |
| CZT Counter | 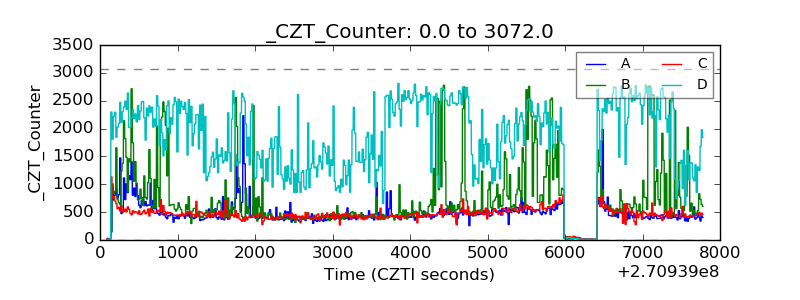 |
| +2.5 Volts monitor |  |
| +5 Volts monitor |  |
| _ROLL_ROT | 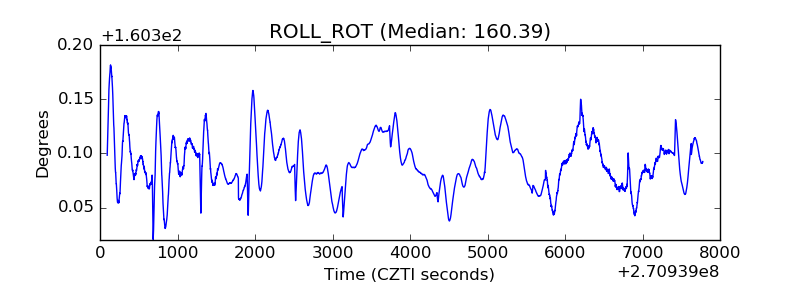 |
| _Roll_DEC |  |
| _Roll_RA | 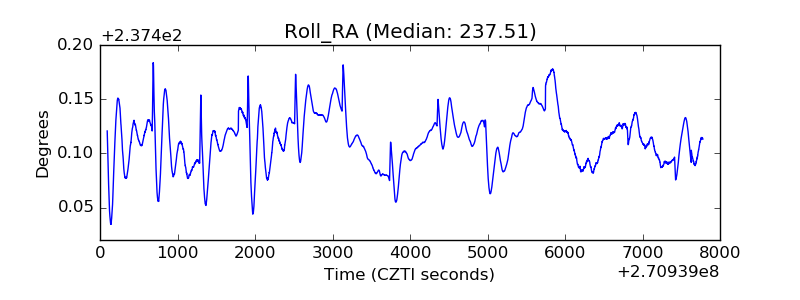 |
| Veto Counter | 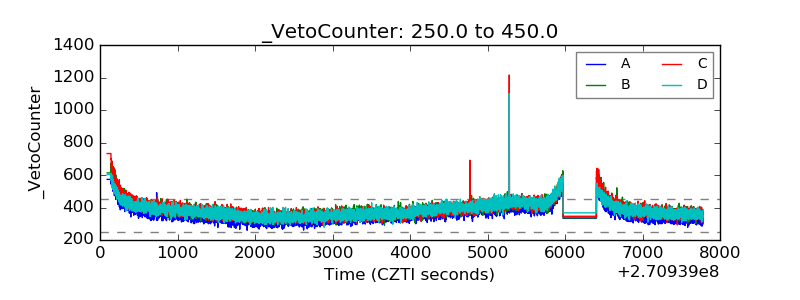 |