| Param | Original file | Final file |
|---|---|---|
| Filename | modeM0/AS1C03_001T01_9000002270_15391cztM0_level2.evt | modeM0/AS1C03_001T01_9000002270_15391cztM0_level2_quad_clean.evt |
| Size (bytes) | 919,097,280 | 117,184,320 |
| Size | 876.5 MB | 111.8 MB |
| Events in quadrant A | 3,629,750 | 807,526 |
| Events in quadrant B | 6,824,524 | 764,243 |
| Events in quadrant C | 3,755,399 | 812,090 |
| Events in quadrant D | 13,099,508 | 621,724 |
| Mode SS | |||
|---|---|---|---|
| Quadrant | BADHDUFLAG | Total packets | Discarded packets |
| A | 0 | 158 | 0 |
| B | 0 | 158 | 0 |
| C | 0 | 158 | 0 |
| D | 0 | 158 | 0 |
| Mode M0 | |||
|---|---|---|---|
| Quadrant | BADHDUFLAG | Total packets | Discarded packets |
| A | 0 | 16362 | 3 |
| B | 0 | 25630 | 2 |
| C | 0 | 16440 | 2 |
| D | 0 | 44272 | 2 |
| Mode M9 | |||
|---|---|---|---|
| Quadrant | BADHDUFLAG | Total packets | Discarded packets |
| A | 0 | 8 | 0 |
| B | 0 | 8 | 0 |
| C | 0 | 8 | 0 |
| D | 0 | 8 | 0 |
| Quadrant | Total seconds | Saturated seconds | Saturation percentage |
|---|---|---|---|
| A | 7799 | 40 | 0.512886% |
| B | 7799 | 997 | 12.783690% |
| C | 7799 | 29 | 0.371843% |
| D | 7799 | 3376 | 43.287601% |
Noise dominated data is calculated using 1-second bins in cleaned event files. If a bin has >2000 counts, and if more than 50% of those come from <1% of pixels, then it is considered to be noise-dominated and hence unusable.
| Quadrant | # 1 sec bins | Bins with >0 counts | Bins with >2000 counts | High rate bins dominated by noise | Noise dominated (total time) | Noise dominated (detector-on time) | Marked lightcurve |
|---|---|---|---|---|---|---|---|
| A | 8550 | 7802 | 5 | 5 | 0.06% | 0.06% | 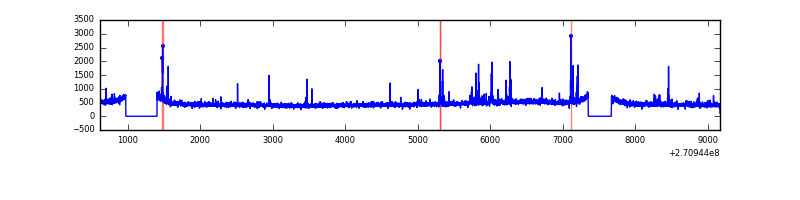 |
| B | 8550 | 7802 | 678 | 678 | 7.93% | 8.69% | 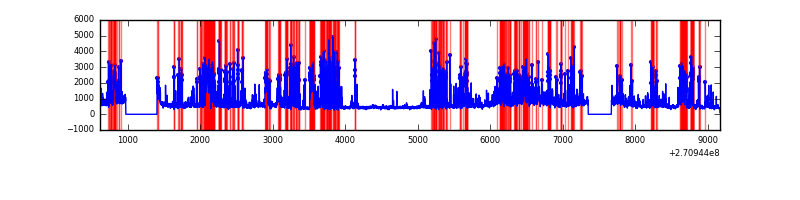 |
| C | 8550 | 7802 | 0 | 0 | 0.00% | 0.00% | 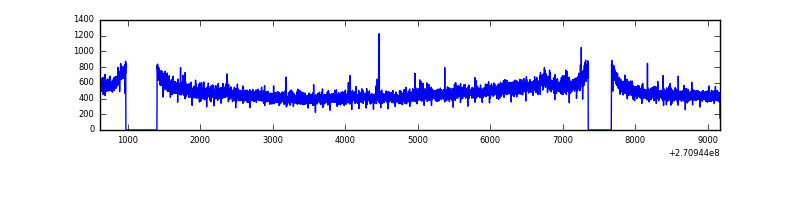 |
| D | 8550 | 7802 | 3015 | 3015 | 35.26% | 38.64% | 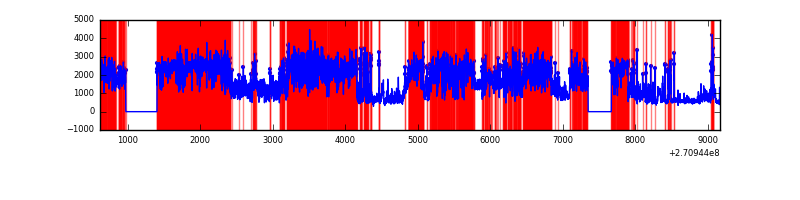 |
Top three noisy pixels from each quadrant. If the there are fewer than three noisy pixels in the level2.evt file, extra rows are filled as -1
| Pixel properties | Quadrant properties | ||||||
|---|---|---|---|---|---|---|---|
| Quadrant | DetID | PixID | Counts | Sigma | Mean | Median | Sigma |
| A | 14 | 238 | 64393 | 344.6 | 904 | 881 | 184.3 |
| A | 9 | 143 | 29175 | 153.52 | 904 | 881 | 184.3 |
| A | 13 | 248 | 21071 | 109.55 | 904 | 881 | 184.3 |
| B | 10 | 245 | 2737508 | 16679.2 | 865 | 844 | 164.1 |
| B | 10 | 16 | 203343 | 1234.17 | 865 | 844 | 164.1 |
| B | 7 | 220 | 113116 | 684.27 | 865 | 844 | 164.1 |
| C | 3 | 233 | 247360 | 1188.3 | 893 | 897 | 207.4 |
| C | 10 | 22 | 8784 | 38.03 | 893 | 897 | 207.4 |
| C | 13 | 61 | 6452 | 26.78 | 893 | 897 | 207.4 |
| D | 13 | 122 | 9068502 | 48448.75 | 752 | 726 | 187.2 |
| D | 2 | 33 | 464847 | 2479.78 | 752 | 726 | 187.2 |
| D | 9 | 68 | 284471 | 1516.04 | 752 | 726 | 187.2 |
Histogram calculated using DETX and DETY for each event in the final _common_clean file
| Quadrant A | 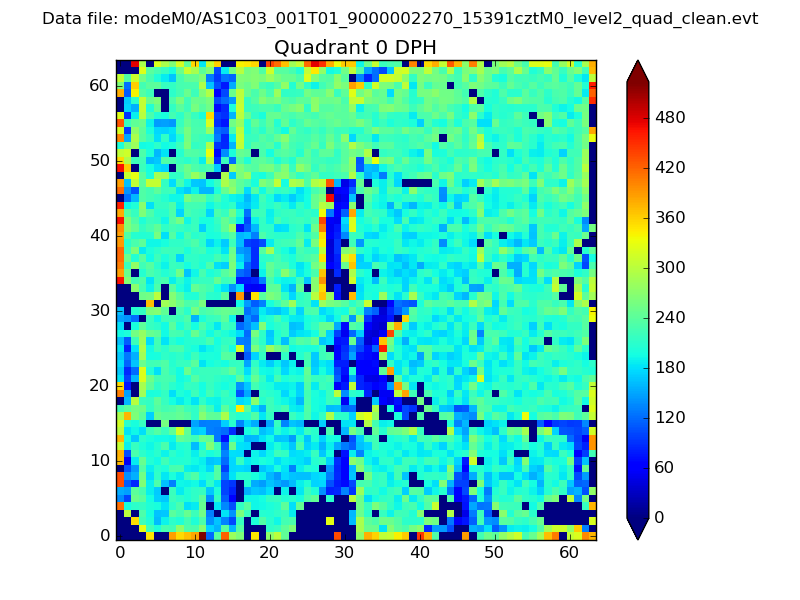 |
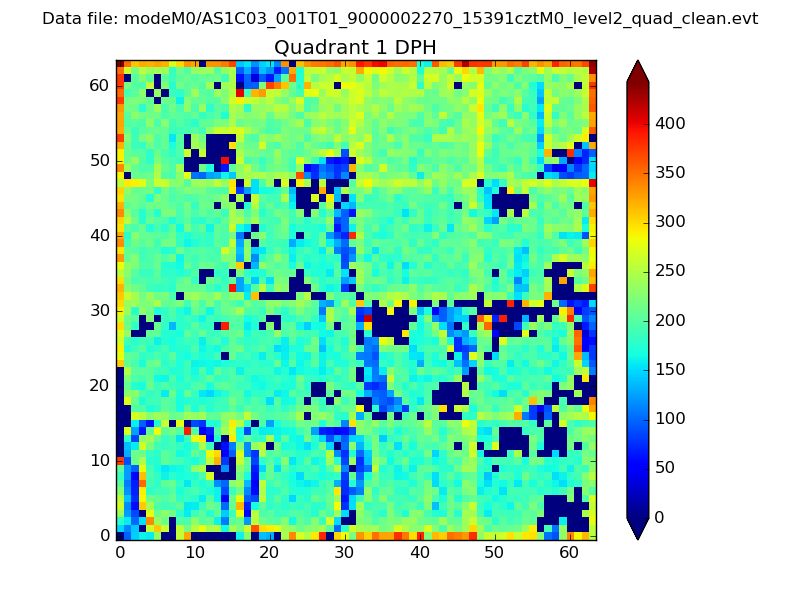 |
Quadrant B |
|---|---|---|---|
| Quadrant D | 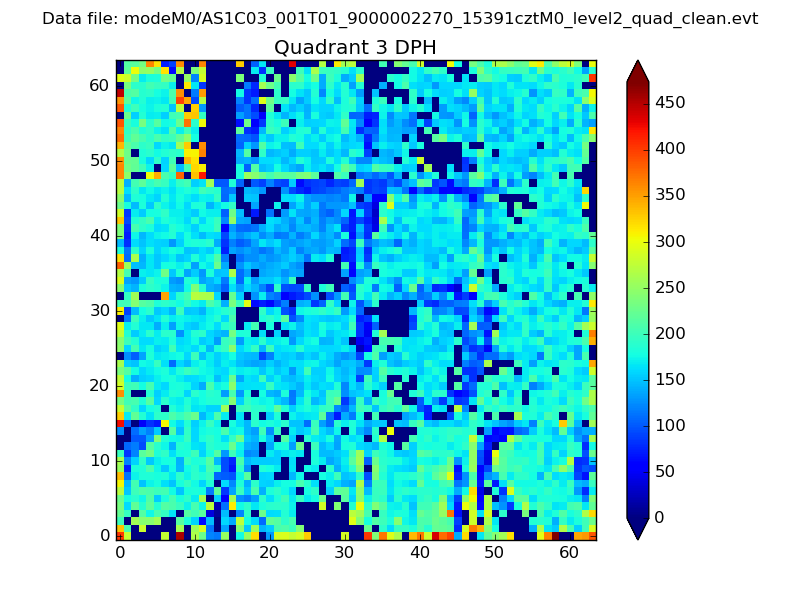 |
 |
Quadrant C |
| Plot type | Count rate plots | Images |
|---|---|---|
| Comparison with Poisson distribution Blue bars denote a histogram of data divided into 1 sec bins. Red curve is a Poisson curve with rate = median count rate of data. |
 |
 |
| Quadrant-wise count rates Data is divided into 100 sec bins |
 |
|
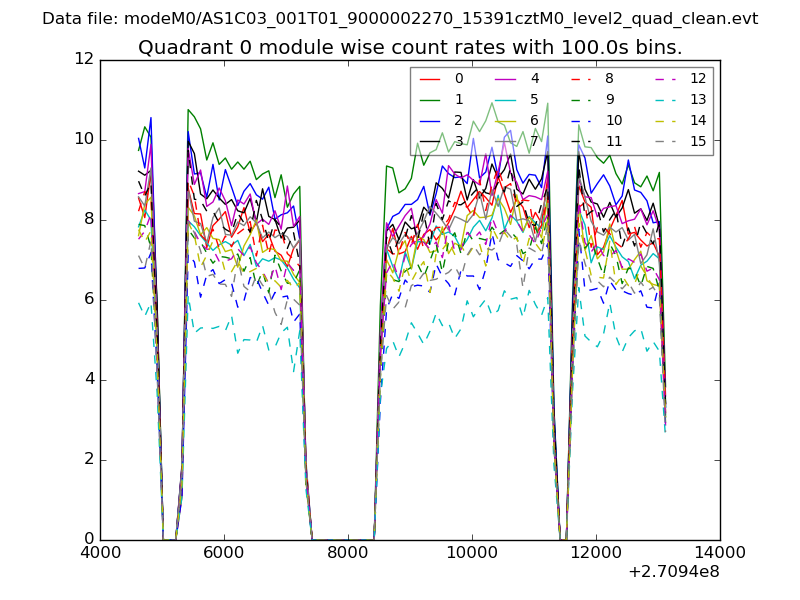
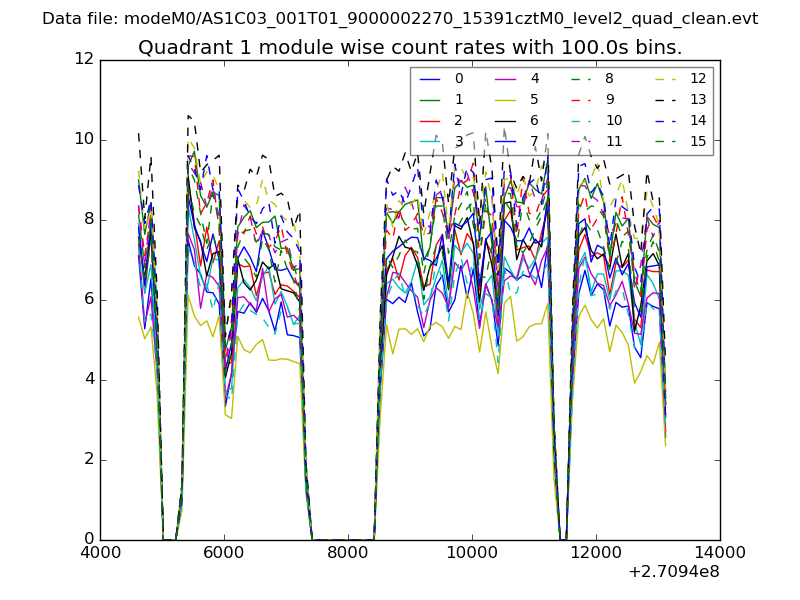
| Module-wise count rates for Quadrant A Data is divided into 100 sec bins |
 |
 |
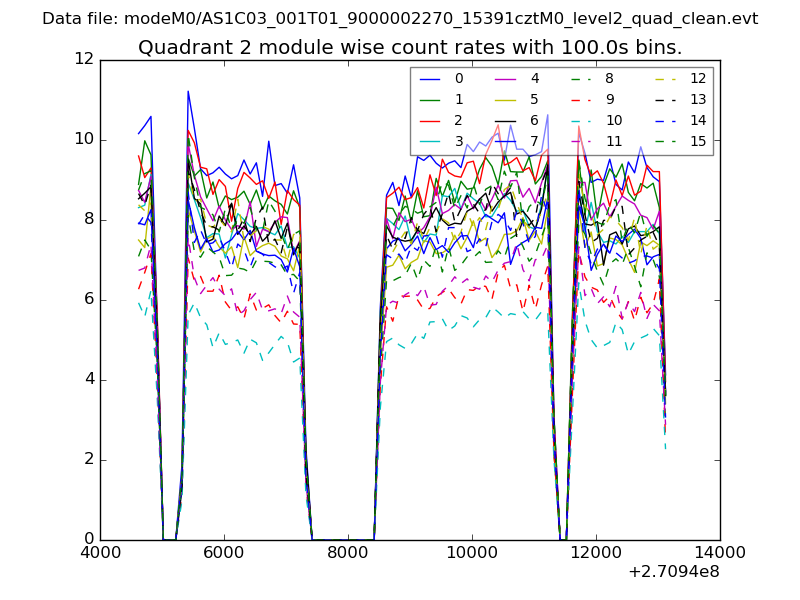
| Module-wise count rates for Quadrant B Data is divided into 100 sec bins |
 |
 |
| Module-wise count rates for Quadrant C Data is divided into 100 sec bins |
 |
 |
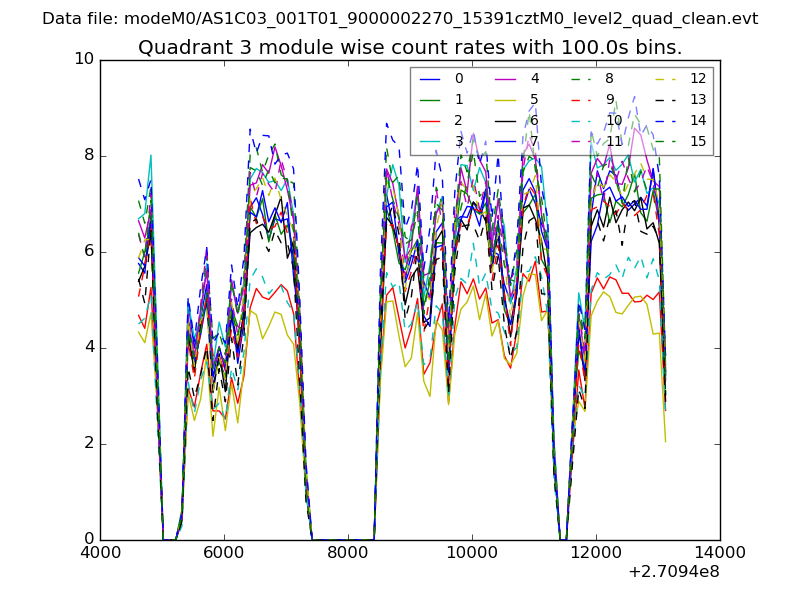
| Module-wise count rates for Quadrant D Data is divided into 100 sec bins |
 |
 |
| Parameter | Plot |
|---|---|
| CZT HV Monitor | 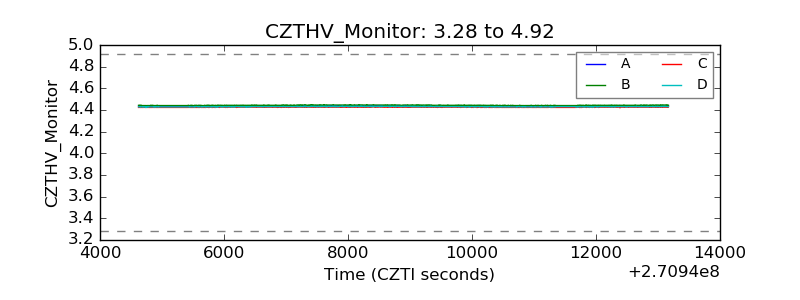 |
| D_VDD | 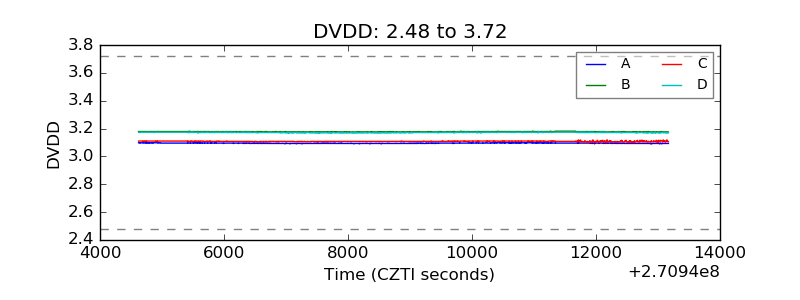 |
| Temperature 1 | 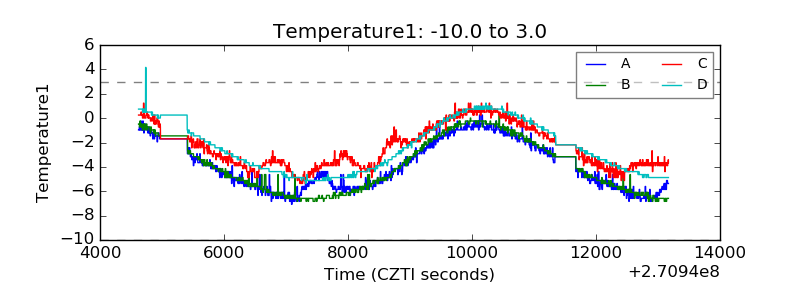 |
| Veto HV Monitor | 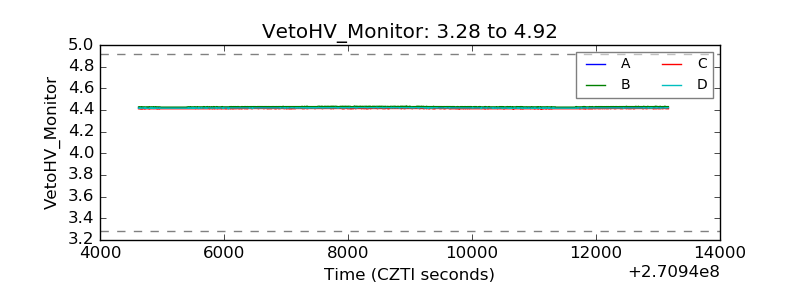 |
| Veto LLD | 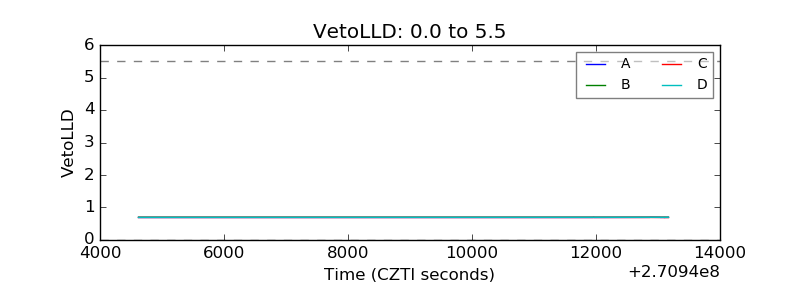 |
| Alpha Counter |  |
| _CPM_Rate | 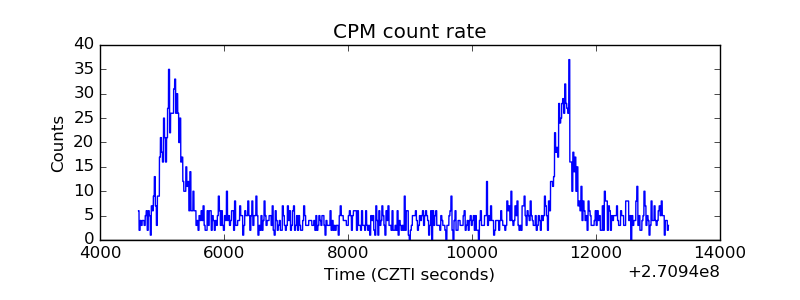 |
| CZT Counter |  |
| +2.5 Volts monitor |  |
| +5 Volts monitor |  |
| _ROLL_ROT | 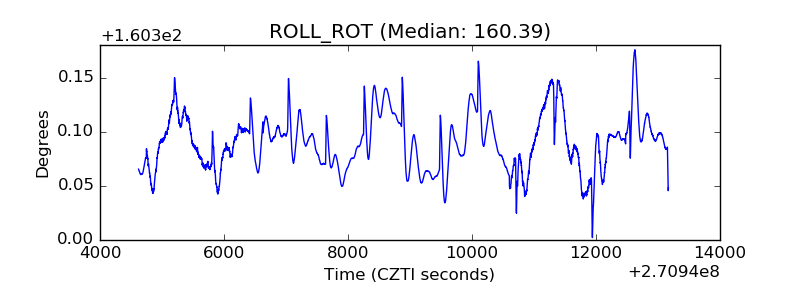 |
| _Roll_DEC | 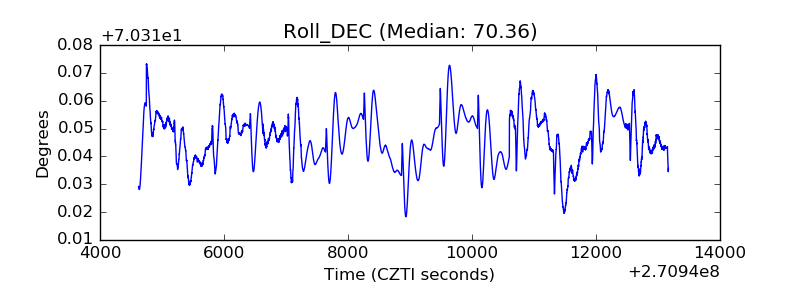 |
| _Roll_RA | 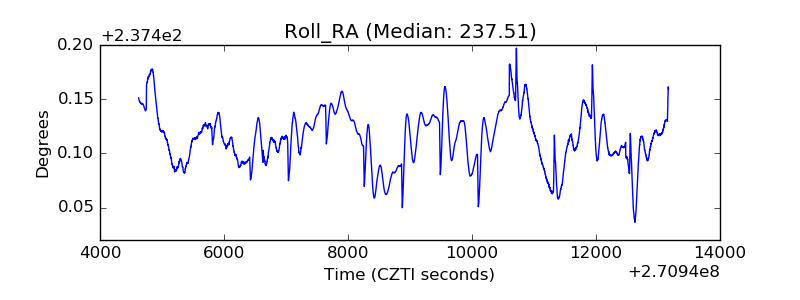 |
| Veto Counter | 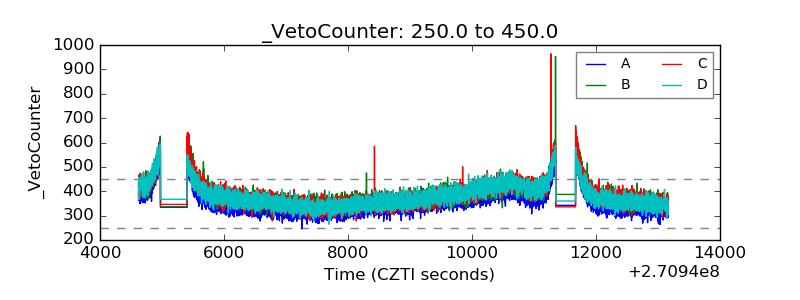 |